![Marketing Leaders Share Best Social Media Dashboards They Use for Their Business and Clients [Free Templates Included]](https://cdnwebsite.databox.com/wp-content/uploads/2022/06/25110543/best-social-media-dashboard.jpg "Marketing Leaders Share Best Social Media Dashboards They Use for Their Business and Clients [Free Templates Included]")
Table of contents
When you are managing multiple social media accounts, you need a single source where you can monitor and analyze your performance in real-time.
That’s why creating social media dashboards can be beneficial. Instead of having to log into multiple accounts multiple times a day to monitor performance, you can see it in a few dashboards.
In this post, we’re taking a closer look at the best social media dashboards companies we surveyed use. For each example, there is a corresponding template you can download.
- What Is a Social Media Dashboard and How Is It Helpful to a Business?
- Most Popular Social Media Platforms Used for Marketing
- 5 Social Media Dashboards Used By Marketing Experts
- Build a Social Media Dashboard for Free in Databox

What Is a Social Media Dashboard and How Is It Helpful to a Business?
A social media dashboard allows you to measure and track the impact that social media has on your business — from sales and marketing to recruiting and customer service.
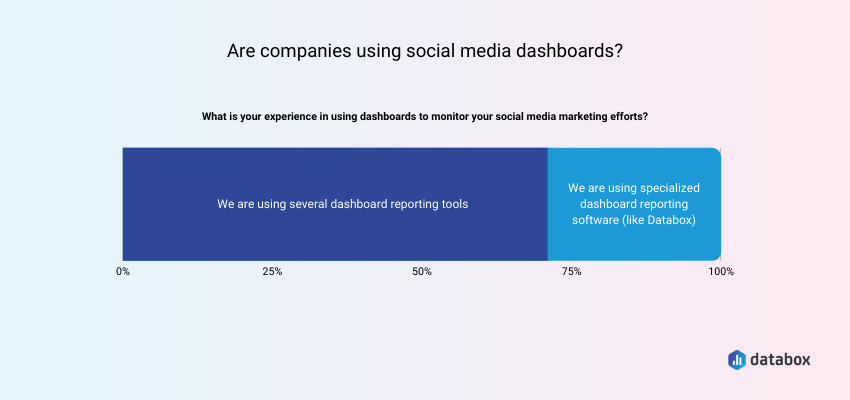
In fact, 71% of our survey respondents are using several dashboard reporting tools, and 29% are using specialized dashboard reporting software like Databox.
For additional context, we surveyed 42 marketers who use dashboards to monitor their social media efforts. 60% of these respondents were B2C services or products. Another 16% were B2B services or products. And, 24% were agencies.
Most Popular Social Media Platforms Used for Marketing
When it comes to social media platforms most companies use for marketing, it turns out that 95% of our surveyed companies use Facebook, 90% use Instagram, 74% use Twitter, and 71% use Linkedin.
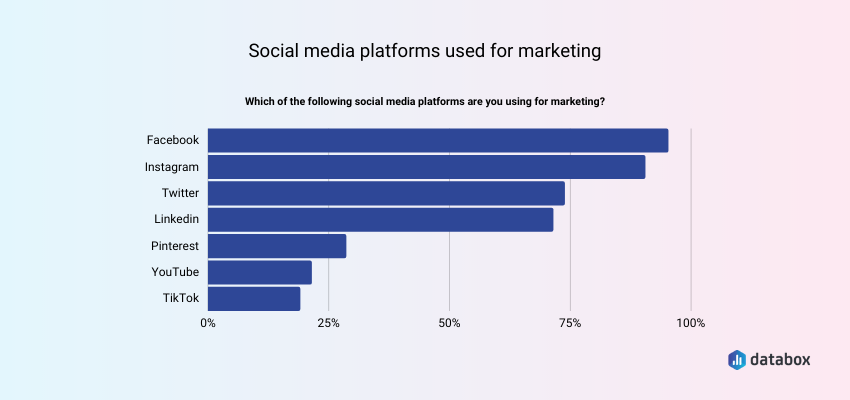
It was interesting to note given the recent popularity of TikTok that less than 30% of the companies are using it.
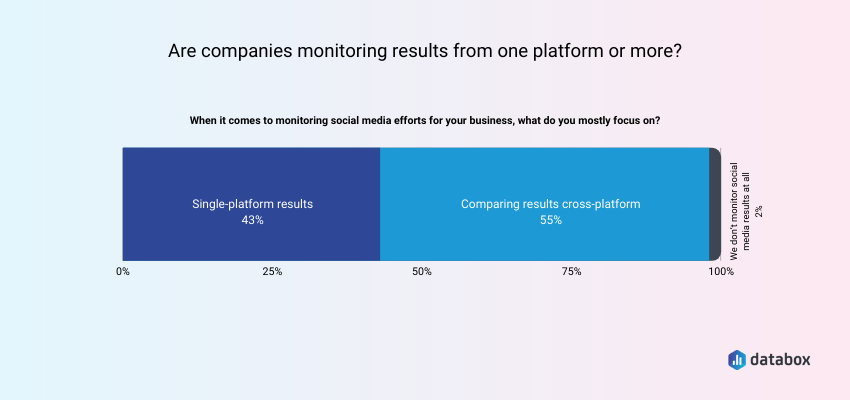
In addition, when monitoring social media efforts for their businesses, more than half of the surveyed companies stated that they mostly focus on comparing results cross-platform.
5 Social Media Dashboards Used By Marketing Experts
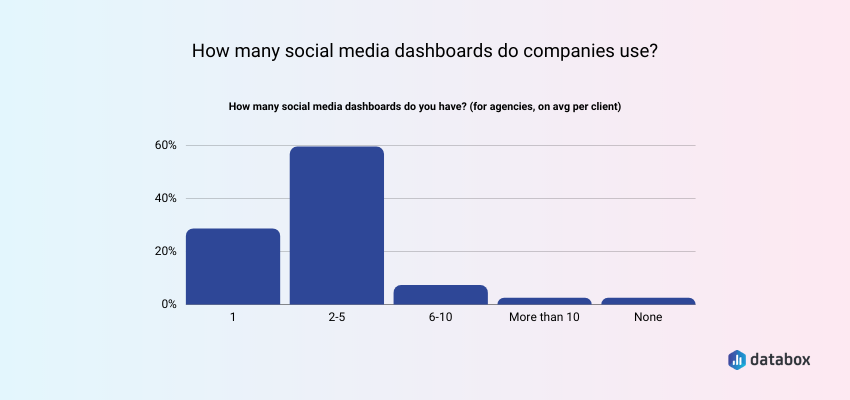
Did you know that more than half of the companies we surveyed have between 2-5 social media dashboards they use?
In this section, we’re taking a closer look at the five best social media dashboards.
- Social media overview dashboard
- Social media management dashboard
- Social media engagement dashboard
- Monthly social media dashboard
- Audience growth dashboard
1. Social Media Overview Dashboard
A social media overview dashboard is beneficial for showing the impact of social media to c-level executives.
Metrics:
- Follower growth
- Reach
- Impressions
- Clicks
- Comments
- Shares
- Likes
Results: Displaying all of your metrics in one easy-to-scan dashboard allows people to compare results over a weekly, monthly, quarterly, or annual view.
“For the high-level view, this is enough to say how social is doing – especially when you can provide a monthly, quarterly, and annual comparison,” says Colton De Vos of Resolute Technology Solutions. “This gives leaders and managers insight into how things are going as whole without getting into the weeds of individual platforms, post schedules, and other nitty-gritty details. It’s especially powerful if you can extract select examples like top-performing posts with rationale for why they excelled.”
Here is an example of a social media overview dashboard from Databox. This Instagram dashboard provides you with insights about your overall account health and performance. The dashboard is fully customizable meaning you can include/exclude metrics as you see fit, change the visualizations and colors, and even include additional data sources.

2. Social Media Management Dashboard
A social media management dashboard is designed for your social media team. It should help you and your team be able to see what’s happening at any given moment.
Metrics:
- Follower reach
- Engagement post clicks
- Mentions
- Likes / Reactions
- Reach
- Impressions
- Clicks
- Comments
- Shares
- Posts published
- Posts scheduled
- Average video watch time
Results: It should make it easier for your team to manage multiple social media accounts at one time.
“It should be able to mesh your networks together to inspect data however you wish,” explains Mike McClung of Integrity Cash Home Buyers. “It should also give you a bird’s-eye view of your social media calendar and let you plan content ahead of time. Moreover, it should enable users to monitor multiple social media campaigns, keywords and hashtags.”
Rakhi Oswal of Edrio adds, “I feel a social media dashboard should look like a comprehensive overview of my social media position across all platforms. So, I aim to create an aggregated social media dashboard for quick references. My company’s social media dashboard includes vital social media metrics like content engagement, followers, reach, impressions, post clicks, likes, comments, shares, retweets, mentions, and average video watch time.”
PRO TIP: Here Is Your Go-To Dashboard for Tracking and Reporting on Marketing Efforts Across Multiple Social Media Platforms
To monitor the impact of your social media marketing efforts, you may have to log into multiple tools to check how your accounts on different social networks are performing and spend hours compiling a comprehensive report. But, with Databox, social media reporting doesn’t have to be a time-consuming chore anymore.
Now you can quickly assess your social media performance in a single dashboard that monitors fundamental metrics, such as:
- Sessions by social source. See the total number of sessions each social media channel generates on a monthly basis.
- Total number of Facebook page likes. See the total number of likes your Facebook page has acquired over time.
- Number of followers. View the number of followers you have on any social media channel – LinkedIn, Twitter, and/or Instagram.
Now you can benefit from the experience of our social media experts, who have put together a plug-and-play Databox template showing the most important KPIs for measuring the impact of your social media marketing efforts from multiple channels. It’s simple to implement and start using as a standalone dashboard or in marketing reports, and best of all, it’s free!

You can easily set it up in just a few clicks – no coding required.
To set up the dashboard, follow these 3 simple steps:
Step 1: Get the template
Step 2: Connect your Social Media accounts with Databox.
Step 3: Watch your dashboard populate in seconds.
3. Social Media Engagement Dashboard
A social media engagement dashboard is a mix between your overview dashboard and the granular one for your social media marketing team. This allows you to see your most engaging content by channel without being bogged down in the minutia of every single mention, post scheduled, etc.
Metrics:
- Post likes
- Post shares
- Post views
- Post comments
- Post engagement rate
- Follower growth numbers
- Most popular posts by channel
- Total mentions
- Referral traffic by post
- Social media sentiment
- Audience demographics
“A social media dashboard must of course include the essential KPIs of engagement and followers,” says Simon Kingsnorth. “However this only gives you data, not real insight and dashboards should always provide insight. To be truly impactful they need to focus on your goals. They should therefore look at engagement in detail (likes, views, shares, comments). Engagement for the month versus last month (all KPIs should be versus last month).
It should show engagement rate and follower/subscriber numbers over a 12-month period to show monthly and annual patterns. Within this it should be annotated to highlight campaigns or market factors that have caused any specific peaks and troughs.
It should also include the most popular posts by channel to understand trends on content and channel-specific behavior.
It should also include social listening such as top mentions and how your brand and product are being discussed – the volume of mentions and the sentiment of good or bad opinion.
Coming back to your goals – this is an area that many people forget with social media dashboards. How much traffic are your posts and channels delivering. How much of this traffic is converting or meeting the goal behavior (form fill, read blog, etc). If relevant you could also include a value here to show the revenue generated by this activity. This is the true mark of success.
Finally, it is also worth looking at the audience. The demographics and geographies of the audiences can influence engagement and content planning so this can answer the “Why” behind the data you’re seeing and help you shape future social activity.”
Here is an example of a social media engagement dashboard from Databox. This Google Analytics social media dashboard helps you to evaluate your social media efforts’ effectiveness by tracking metrics such as traffic by social media channel, goal conversions, bounce rate, etc. The dashboard is fully customizable meaning you can include/exclude metrics as you see fit, change the visualizations and colors, and even include additional data sources.

4. Monthly Social Media Dashboard
A monthly social media dashboard for clients is a must if you are a social media marketing agency.
Metrics:
- Audience size
- New contacts per channel
Organic social growth by channel - Paid social ad performance
For example, Ashley Parkinson of ClearPivot says, “We create monthly databoards for each client we sign on to start tracking results. Social media data is included on the general dashboards for new contacts and sessions per month. We have also found it helpful to look at the audience size, and new contacts per channel overall. As well as the specific growth for organic social as well as ads. These boards usually look at the organic, sessions and audience size across the channels on one page and then break down the ads for each platform on their individual pages of the looped dashboard.
Having the ads separated out lets us show better results and show the clients exactly what their ad spend goes to. We have noticed that the organic growth being all on one page allows them to see how all the channels are performing as a whole.”
Here is an example of a monthly social media dashboard from Databox. This dashboard is perfect for clients who want a general overview of their social media performance without getting into too much detail. This dashboard summarizes how their brand is doing within the social community. Like other dashboard examples we shared, this dashboard is fully customizable.

5. Audience Growth Dashboard
If you are focused on live streaming (be it on Twitch, Youtube, Tiktok, Instagram, Facebook, or Youtube), then an audience growth dashboard is beneficial.
Metrics:
- Total streamers
- Earnings per follower
- Most popular live streams
“Our social media reports revolve around growth,” says Sammy Shayne of Couch Fame. “Audience growth is the most important KPI for our streamers, and our company. We measure this metric for each of several streaming apps, and also compile them for an overall look at each streamer’s performance, and the company as a whole. We also break down earnings per follower for each streamer as well as the entire company, and base all of our growth goals starting here.”
Here is an example of an audience growth dashboard from Databox. With this YouTube channel performance dashboard, you can track your subscriber rate, likes, comments, shares, and other useful video engagement metrics to determine the success of your video marketing strategy. Like other dashboard examples we shared, this dashboard is fully customizable.

Build a Social Media Dashboard for Free in Databox
If you are looking to display how social media impacts other marketing campaigns or channels, then using Databox can make this process a lot easier.
Not only can you create a dashboard in minutes using our drag-and-drop interface, but you can also connect to hundreds of sources like HubSpot, Salesforce, Google Analytics, Facebook Ads, and more.
Ready to create your first social media dashboard? Create your free Databox account here.