Table of contents
Hello everyone. Welcome to another episode of Data Snacks. I’m Monja, a product marketer here at Databox.
Today, we’re going to talk about identifying which website pages drive the most conversions using Google Analytics metrics. This helps us better understand what type of content helps convert visitors to customers and where exactly the conversions we want to see happen most often. Using that information, we can optimize our pages for better engagement and conversion going forward.
We will also help you set up goals for your pages that will help you easily track their overall success and compare the most effective ones to those that are underperforming to prioritize our efforts to optimize them.
In this episode of Data Snacks, I’m going to show you how to:
- Discover which pages drive the most conversions by tracking the right set of metrics
- Learn how to set conversion goals and track their completion rate
- Apply tips that can boost conversions on your pages
Below, you can view the full episode or keep reading for a fully transcribed version of the episode, complete with relevant screenshots.
Let’s start!
Tracking Conversions in a Dashboard
Here’s what I want to see––I want to use Google Analytics to get the relevant data on-page conversions.
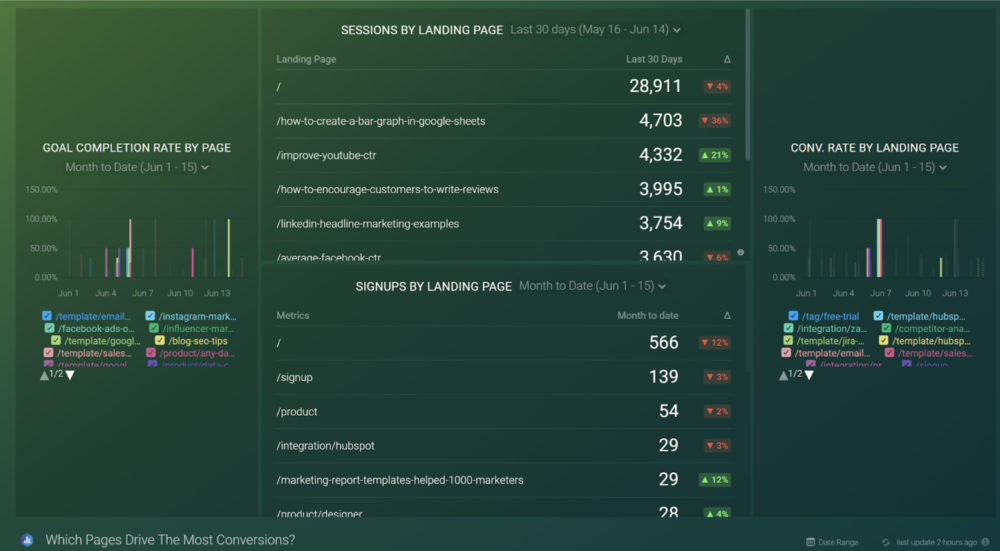
From the Databox Designer, I’m going to the Metrics Library and selecting Google Analytics as the data source, then drag and drop the following metrics – Sessions by Landing Page and Signups by Landing Page. Now, at a glance, you can see whether there is a consistent relationship between sessions and signups on your landing pages.
We can see here that our content is winning when it comes to sessions, while the signups mostly come from our product pages. The leading page is our website’s home page in both cases, as most people start there.

We can interpret from this that our blogs are engaging visitors, while our product pages provide enough information to get people to sign up. Of course, there is always room for our marketing team to further optimize our posts in order to drive more signups from our blog and make better use of our website traffic. This will also have a positive impact on our visit-to-signup conversion rate down the road.
Next, I want to look at individual page conversion rates, so I’m going to add the Conversion Rate by Landing Page metric. Here, it is clear that our free trial page converts best, as we would expect. Next, we see that several of our template pages are doing well, which is one of our goals for improving signups. This also means that there is room for improvement on other pages to drive more conversions.
How do we know if we are making progress?
Simple, by creating a custom metric – Goal Completion Rate by Page
The idea is that we can set a conversion goal for each of our pages and then improve optimization and content until we achieve desired results.
By regularly checking this dashboard, we can see if our ideas are working or not and then continue changing and experimenting to meet our goals. Ideally, we want to see improvement across all of our landing pages.
What is a Good Conversion Rate and How to Obtain it
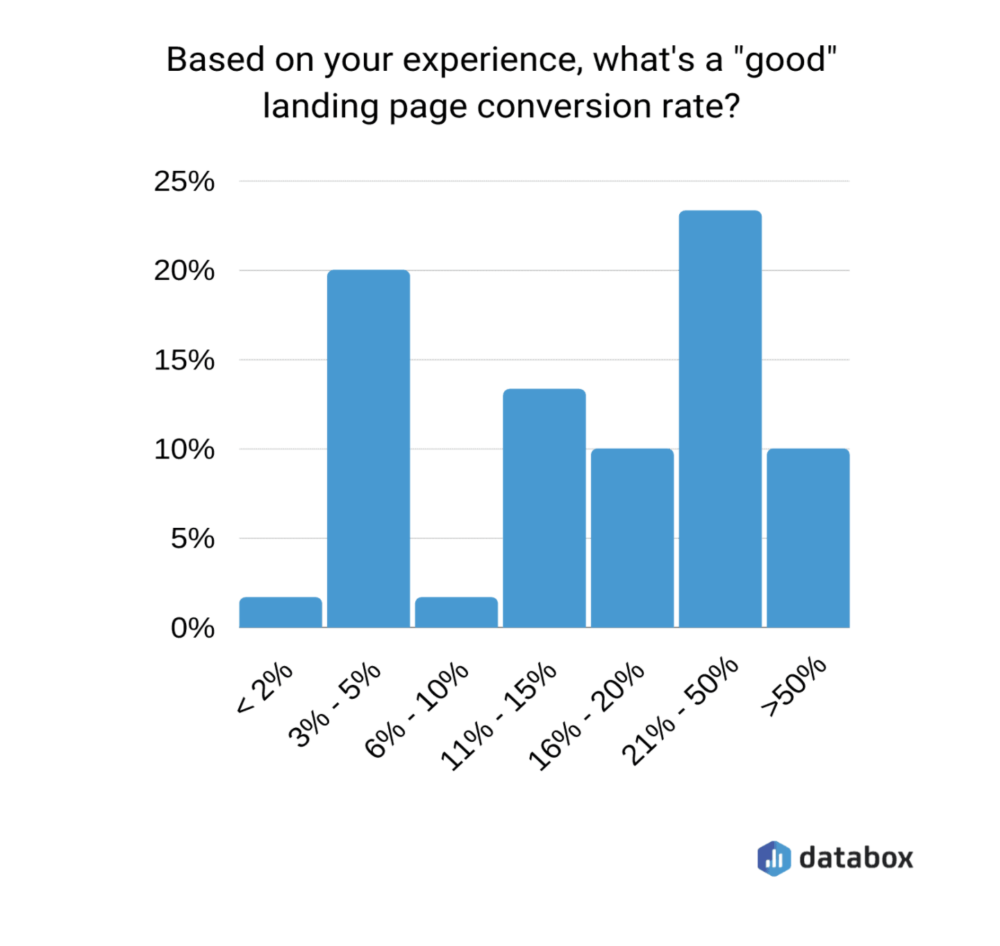
So what should you aim for? According to a Databox survey – about 23% of respondents agree that a good landing page conversion rate should range between 21 and 50 percent. However, 20% of the surveyed experts insist that a good conversion rate is between 3 and 5%. Your conversion goals should be based on business growth goals and your available marketing resources.

To improve your landing page conversion rates, you can try some of the following tips and monitor how they perform –
- Start with a generic, repeatable conversion research audit – that will give you insight into each of your landing pages.
- Set SMART goals – if you have multiple offers on your landing pages it can confuse users and make them lose sight of the offer on the landing page.
- Finally, use compelling images, like the data visualizations in Databox dashboards that tell a story and convey value to your visitors.
There are certainly more insights you can pull from this visualization––these examples were just a few to get you started.
Setting goals, like desired conversion rates for your landing pages, will help you improve your content as you will strive to reach them. And by comparing your pages, you can decide which ones can be improved.
If you need help tracking and visualizing which pages drive the most conversions or setting conversion goals, our Support team can actually help build your first dashboard for free.
Just create your free Databox account and reach out to our team either via chat or email.
See you next time.


