


Table of contents
What if you could unlock the secrets to your industry’s online performance and gain a competitive edge?
Our comprehensive report on website traffic benchmarks offers just that, providing valuable insights across various industries to help you navigate the digital landscape with ease. Take a closer look at six critical metrics which present a clear picture of your industry’s current performance.
We examined sessions, users, pageviews, bounce rate, new users, and time on page across 15 industries, considering the unique factors that shape each one. From business types and seasonality to marketing strategies and industry trends, we’ve got you covered.
Industry benchmarks provide useful context, but they only tell part of the story. If your traffic is above or below industry average, the next step is understanding why. Teams now rely on AI data analyst like Databox MCP to ask specific questions about traffic trends and receive answers grounded in their actual data and historical performance. Because it understands how the business defines its metrics, it can explain whether changes are driven by seasonality, campaign shifts, or longer-term patterns, making benchmark comparisons more practical and easier to interpret.
Are you ready to seize the opportunity and elevate your business to new heights? We will cover:
- Website Traffic Benchmarks by Industry
- Sessions
- Users
- Conversion Rates Across Industries
- Pageviews
- Website Traffic Sources Analysis
- Bounce Rate
- New Users
- Average Time on Page
- Mobile Website Traffic Statistics

Website Traffic Benchmarks by Industry: Insights from Original Data
Understanding how your website’s performance compares to industry benchmarks can provide valuable insights for growth and optimization strategies. Website traffic is a crucial metric for businesses across all industries.
Let’s dig into the detailed breakdown of website traffic benchmarks by industry for Sessions, Users, Pageviews, Bounce Rate, New Users and Average Time on Page.
Sessions
Across all industries, the median value of website sessions for April 2023 was 3.93K.

Let’s take a closer look at sessions across different industries:
| Industry | Sessions |
| Apparel & Footwear | 18.16K |
| Automotive | 11.2K |
| Construction | 2.24K |
| Consulting & Professional Services | 2.58K |
| eCommerce & Marketplaces | 9.57K |
| Education | 6.54K |
| Food | 10.43K |
| Health Care | 4.21K |
| Health & Wellness | 4.29K |
| Information Technology & Services | 3.56K |
| Industrials & Manufacturing | 3.85K |
| Real Estate | 3.22K |
| SaaS | 3.16K |
| Technology | 4.32K |
| Travel & Leisure | 7.87K |
The Apparel & Footwear industry is the standout performer with the highest number of sessions, reaching 18.16K, which is nearly five times the overall median of 3.93K. Automotive, Food, eCommerce and Marketplaces, Education, and Travel & Leisure industries also excel in user engagement, significantly surpassing the median value. In contrast, Construction and Consulting & Professional Services report fewer sessions, indicating lower engagement. Other industries, such as Health Care, Health & Wellness, and Technology, align closer to the median, demonstrating average user interaction.
PRO TIP: To increase the number of sessions, create tangential content that targets low-hanging fruit keywords. Focus on topics related to your industry or niche, but not directly about your core offerings, and optimize for specific, long-tail search queries. This strategy enables you to reach a wider audience, tap into less competitive keywords, and drive more targeted traffic to your website. Additionally, ensure that your content is well-optimized and includes internal links for SEO to improve search rankings and user engagement.
To learn about growing your traffic, Brendan Hufford, the founder of Growth Sprints, shares how he grew ActiveCampaign’s traffic by 20% in just 30 days in our recent podcast episode.
Average Organic Traffic for Different Sectors
According to recent data, the median value of website sessions across all industries in April 2023 was 3.93K. However, this figure varies significantly between sectors. The Apparel & Footwear industry, for instance, reaches an impressive 18.16K sessions. This high traffic volume indicates a strong online presence and consumer engagement in this sector.
Users
Across all industries, the median number of users for April 2023 was 3.02K.
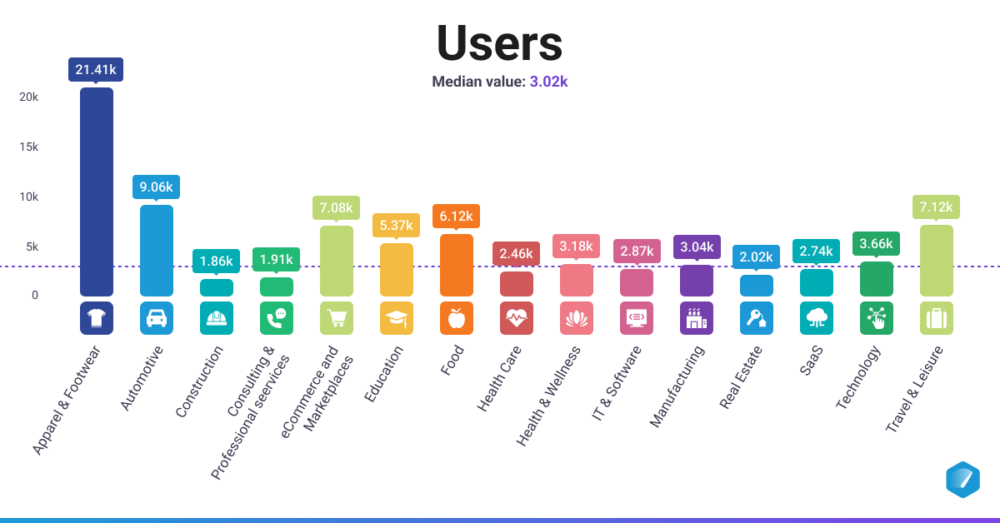
Let’s take a closer look at the number of users across different industries:
| Industry | Users |
| Apparel & Footwear | 21.41K |
| Automotive | 9.06K |
| Construction | 1.86K |
| Consulting & Professional Services | 1.91K |
| eCommerce & Marketplaces | 7.08K |
| Education | 5.37K |
| Food | 6.12K |
| Health Care | 2.46K |
| Health & Wellness | 3.18K |
| Information Technology & Services | 2.87K |
| Industrials & Manufacturing | 3.04K |
| Real Estate | 2.02K |
| SaaS | 2.74K |
| Technology | 3.66K |
| Travel & Leisure | 7.12K |
The users benchmarks really shine a light on notable imbalances across industries. The Apparel & Footwear industry outpaces all others in user counts, boasting 21.41K users, more than seven times the median of 3.02K. Automotive, eCommerce and Marketplaces, Education, Food, and Travel & Leisure industries also exhibit strong user counts, well above the median, indicating strong user bases. In contrast, Construction and Consulting & Professional Services record fewer users, while the remaining ones align closely with the median.
PRO TIP: To effectively track users on your website, focus on the ratio of new vs. returning visitors. This helps you understand the effectiveness of your marketing campaigns in attracting new users and the success of your content in retaining current ones. Analyze user demographics and behavior to refine your marketing strategies, and use this information to optimize user experience, increase engagement, and drive conversions.
Conversion Rates Across Industries
While traffic volume is important, conversion rates provide a more nuanced view of website performance. Conversion rates can vary widely depending on the industry, target audience, and nature of the product or service offered. For instance, e-commerce sites typically aim for conversion rates between 2-3%, while B2B companies might consider rates above 10% as successful.
It’s worth noting that the Construction sector, despite having one of the lowest numbers of pageviews at 4.24K, may still achieve high conversion rates if their traffic is highly targeted and qualified. This underscores the importance of quality over quantity when it comes to website traffic.
Pageviews
Across all industries, the median value of pageviews for April 2023 was 8.82K.

Let’s take a closer look at the number of pageviews across different industries:
| Industry | Pageviews |
| Apparel & Footwear | 192.86K |
| Automotive | 25.79K |
| Construction | 4.44K |
| Consulting & Professional Services | 4.24K |
| eCommerce & Marketplaces | 33.39K |
| Education | 35.88K |
| Food | 21.03K |
| Health Care | 9.95K |
| Health & Wellness | 6.9K |
| Information Technology & Services | 8.68K |
| Industrials & Manufacturing | 8.01K |
| Real Estate | 9.03K |
| SaaS | 7.14K |
| Technology | 11.27K |
| Travel & Leisure | 26.8K |
The pageviews benchmarks also show incredible variance between industries. The Apparel & Footwear sector stands out with an impressive 192.86K pageviews, more than 20 times higher than the median value. In stark contrast, the Consulting & Professional Services sector has the lowest number of pageviews at 4.24K, which is less than a third of the median. Industries such as Automotive, eCommerce & Marketplaces, and Education exhibit significant above-average Pageview counts, while the Construction sector falls below.
PRO TIP: Track your website’s pageviews using a cumulative line graph to easily monitor growth or declines month-over-month. This helps you spot trends quickly and make any necessary adjustments to improve performance. Additionally, identify and leverage your website’s top-performing pages by using table visualizations. That way, you can concentrate your efforts on high-performing content, which can drive further engagement and conversions.
Website Traffic Sources Analysis
Organic Search vs. Paid Search Traffic
Understanding the sources of your website traffic is crucial for developing effective marketing strategies. Organic search traffic, driven by SEO efforts, often provides a sustainable and cost-effective source of visitors. Paid search, on the other hand, can deliver quick results but requires ongoing investment.
According to recent statistics, nearly half (46%) of U.S. sites reported generating between 1,001 and 15,000 monthly visitors in 2023. For B2B sites specifically, more than four in ten (41.2%) generated between 1,000 and 10,000 monthly visitors. These figures provide a benchmark for businesses to assess their traffic performance relative to their peers.
Impact of Social Media, Email, and Direct Traffic
While search engines remain a primary source of traffic for many websites, social media, email marketing, and direct traffic play increasingly important roles. Each of these channels offers unique advantages and can be particularly effective for certain industries or business models.
For instance, social media can be especially powerful for B2C brands in the Apparel & Footwear industry, which saw 192.86K pageviews in April 2023, more than 20 times the median across all industries. This highlights the potential of social platforms for driving high volumes of traffic in consumer-focused sectors.
Bounce Rate
Across all industries, the median bounce rate for April 2023 was 60.78%.
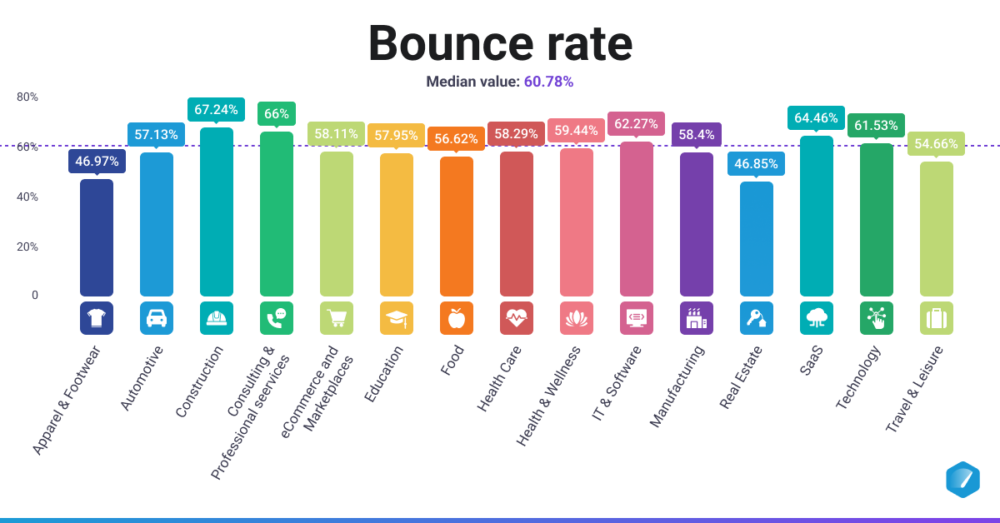
Let’s take a closer look at bounce rates across different industries:
| Industry | Bounce Rate |
| Apparel & Footwear | 46.97% |
| Automotive | 57.13% |
| Construction | 67.24% |
| Consulting & Professional Services | 66% |
| eCommerce & Marketplaces | 58.11% |
| Education | 57.95% |
| Food | 56.62% |
| Health Care | 58.29% |
| Health & Wellness | 59.44% |
| Information Technology & Services | 62.27% |
| Industrials & Manufacturing | 58.4% |
| Real Estate | 46.85% |
| SaaS | 64.46% |
| Technology | 61.53% |
| Travel & Leisure | 54.66% |
The bounce rate metrics exhibit a relatively narrow range of values among industries, with most clustering near the overall median value. The Construction industry experiences the highest bounce rate at 67.24%, only about 7% higher than the median. On the other hand, the Real Estate and Apparel & Footwear sectors enjoy the lowest bounce rates, both at roughly 14% below the median. The remaining industries have bounce rates that closely align with the median value, demonstrating a general trend towards similar bounce rate levels across industries.
PRO TIP: The best ways to improve your bounce rate are to improve the user experience of your website and to ensure your content aligns with user search intent. Optimizing load times and interlinking content are all basic steps. Faster sites are more pleasant to browse through, and speed definitely helps with search rankings. Optimize file sizes, eliminate code bloat, and streamline the design to ensure that visitors who visit your website stick around.
New Users
Across all industries, the median number of new users for April 2023 was 3.66K.
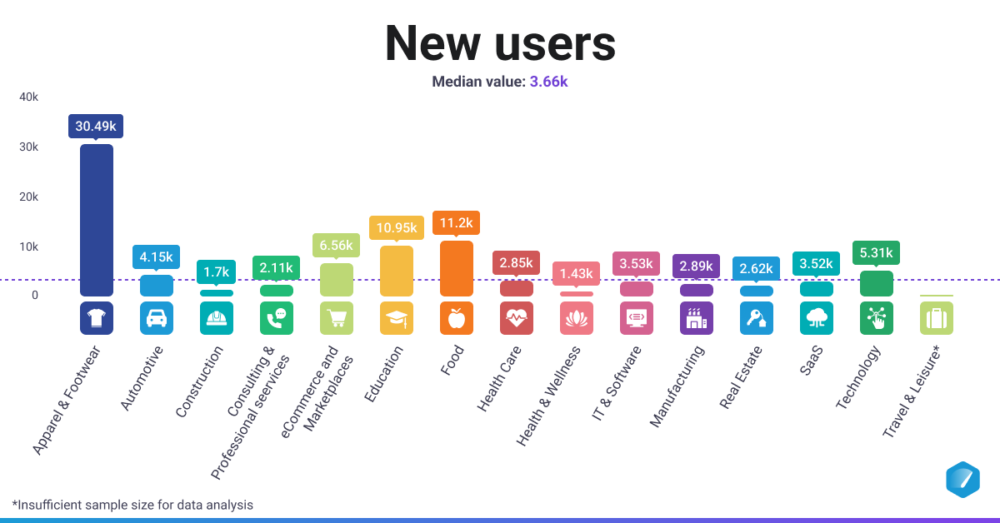
Let’s take a closer look at new users across different industries:
| Industry | New Users |
| Apparel & Footwear | 30.49K |
| Automotive | 4.15K |
| Construction | 1.7K |
| Consulting & Professional Services | 2.11K |
| eCommerce & Marketplaces | 6.56K |
| Education | 10.95K |
| Food | 11.2K |
| Health Care | 2.85K |
| Health & Wellness | 1.43K |
| Information Technology & Services | 3.53K |
| Industrials & Manufacturing | 2.89K |
| Real Estate | 2.62K |
| SaaS | 3.52K |
| Technology | 5.31K |
| Travel & Leisure | MISSING |
The new users benchmarks show significant disparities among different sectors. Apparel & Footwear leads the pack with 30.49K new users, more than eight times the median value of 3.66K. On the other hand, the Health & Wellness sector has the lowest number of new users at 1.43K, well below the median. The Construction sector is close by with 1.7K new users. Industries such as Education, Food, and eCommerce & Marketplaces show above-average new user counts, while the remaining sectors cleave closer to the median.
PRO TIP: The first step is to look closely at your analytics and find solutions that draw targeted new users. Then, based on your findings and goals, you can consider design changes, SEO or marketing strategy updates, and generating more backlinks. Identify what your target audience needs help with and dial in your content to provide it.
Average Time on Page
Across all industries, the median value for the average time on page for April 2023 was 1m 31s.

Let’s take a closer look at the average time on page across different industries:
| Industry | Time on Page |
| Apparel & Footwear | MISSING |
| Automotive | 1m 25s |
| Construction | 1m 46s |
| Consulting & Professional Services | 1m 36s |
| eCommerce & Marketplaces | MISSING |
| Education | 1m 28s |
| Food | 1m 8s |
| Health Care | 1m 27s |
| Health & Wellness | 1m 26s |
| Information Technology & Services | 1m 43s |
| Industrials & Manufacturing | 1m 23s |
| Real Estate | 1m 34s |
| SaaS | 1m 45s |
| Technology | 1m 46s |
| Travel & Leisure | MISSING |
The average time on page varies marginally across industries, with most adhering closely to the median of 1m 31s. The Construction, SaaS, and Technology industries exhibit the longest engagement, all around 15 seconds above the median. In contrast, the Food industry records the shortest time on page at 1m 8s. However, data is missing for the Apparel & Footwear, eCommerce and Marketplaces, and Travel & Leisure industries, limiting the scope of the analysis.
PRO TIP: The best way to ensure visitors spend more time on your site is to make your website easy to navigate and mobile-friendly. You can also add interactive multimedia elements like videos, polls, quizzes, graphs, or infographics to make your content more engaging and encourage visitors to spend more time on your website.
Mobile Website Traffic Statistics
Mobile vs. Desktop Traffic Comparison
The shift towards mobile browsing has been one of the most significant trends in web traffic over the past decade. Understanding the balance between mobile and desktop traffic is crucial for optimizing user experience and conversion rates.
Recent data shows that mobile devices were responsible for nearly half of all web traffic, with desktops accounting for more than a third (38%) of internet browsing. This underscores the importance of mobile-responsive design and mobile-optimized content for businesses across all industries.
Mobile User Expectations and Behavior
Mobile users typically have different expectations and behaviors compared to desktop users. They often seek quick, easily digestible information and may be more likely to abandon sites that aren’t mobile-friendly.
Given that mobile devices account for nearly half of all web traffic, businesses must prioritize mobile user experience. This includes fast loading times, easy navigation, and content that’s easily readable on smaller screens.
Website User Experience Metrics
Average Time on Page
The average time users spend on a page is a key indicator of content engagement and relevance. Longer time on page generally suggests that visitors find the content valuable and are more likely to convert.
While specific benchmarks vary by industry, businesses should aim to keep visitors engaged for as long as it takes to convey their key messages and encourage desired actions.
Bounce Rate Benchmarks
Bounce rate measures the percentage of visitors who leave a site after viewing only one page and is a crucial metric for assessing user engagement. High bounce rates may indicate issues with content relevance, user experience, or site performance.
Industry averages for bounce rates can range from 20% to 70%, with lower rates generally being more desirable. However, it’s important to interpret bounce rates in the context of your specific business goals and website structure.
Factors Influencing Website Traffic
Website Load Speed Impact
Website load speed is a critical factor affecting both user experience and search engine rankings. Slow-loading sites can lead to high bounce rates and lost conversions.
With mobile devices accounting for nearly half of all web traffic, optimizing load speeds for mobile users is particularly crucial. Even a one-second delay in page load time can significantly impact user engagement and conversion rates.
Design and User Interface Considerations
A well-designed website with an intuitive user interface can significantly improve user engagement and conversion rates. This includes clear navigation, visually appealing layouts, and easy-to-use forms and interactive elements.
The success of the Apparel & Footwear industry in driving high traffic volumes (18.16K sessions, nearly five times the overall median) may be partly attributed to their focus on visually appealing, user-friendly designs that showcase products effectively.
Strategies to Increase Website Traffic
SEO Optimization Techniques
Search Engine Optimization (SEO) remains one of the most effective long-term strategies for increasing organic traffic. This involves optimizing content, improving site structure, and building high-quality backlinks.
Given that only 31% of websites receive more than 50,000 unique visitors per month, there’s significant room for growth through effective SEO strategies for many businesses.
Content Marketing for Traffic Growth
Content marketing, when done effectively, can significantly boost website traffic and engagement. This involves creating valuable, relevant content that addresses your target audience’s needs and interests.
The fact that the median website gets 20,000 unique visitors per month suggests that there’s substantial potential for growth through strategic content marketing efforts.
Analyzing Website Traffic Data
Key Performance Indicators (KPIs) to Track
Tracking the right website KPIs is crucial for understanding and improving website performance. Key metrics to monitor include unique visitors, pageviews, bounce rate, average time on site, and conversion rate.
Across all industries, the median value of pageviews for April 2023 was 8.82K. This provides a useful benchmark for businesses to assess their performance against.
Tools for Website Traffic Analysis
There are numerous tools available for analyzing website traffic, ranging from free options like Google Analytics to more advanced paid solutions. These tools can provide detailed insights into traffic sources, user behavior, and conversion patterns.
By leveraging these tools effectively, businesses can gain the insights needed to optimize their websites and marketing strategies, potentially joining the 11% of sites that receive between 250,001 and 10 million monthly visitors.


