


Table of contents
- Which Website Engagement Metrics are Marketers Tracking (And How)?
- The 14 Website Engagement Metrics Every Marketer Needs to Track
- PRO TIP: How to track these 10 popular Google Analytics 4 metrics
- Boost Website Engagement By Monitoring Metrics That Matter
In the marketing world, acquisition metrics (like traffic) get a lot of press, but when we asked marketers about their essential website KPIs, many talked about measuring engagement on their sites.
That’s, in part, because traffic tells you more about the efficacy of promotion than it does about your website itself.
To get more detail around which metrics matter for website engagement and why we asked marketers to share their #1 most important measure of website engagement. Here’s what we learned.
Which Website Engagement Metrics are Marketers Tracking (And How)?
Of the marketers we spoke to for this article, nearly half said engagement metrics make up 26-50% of the metrics they track on a regular basis.

When we dug into which of those engagement metrics they found to be most important, the usual suspects—average time on page, bounce rate, and average session duration—led the pack.
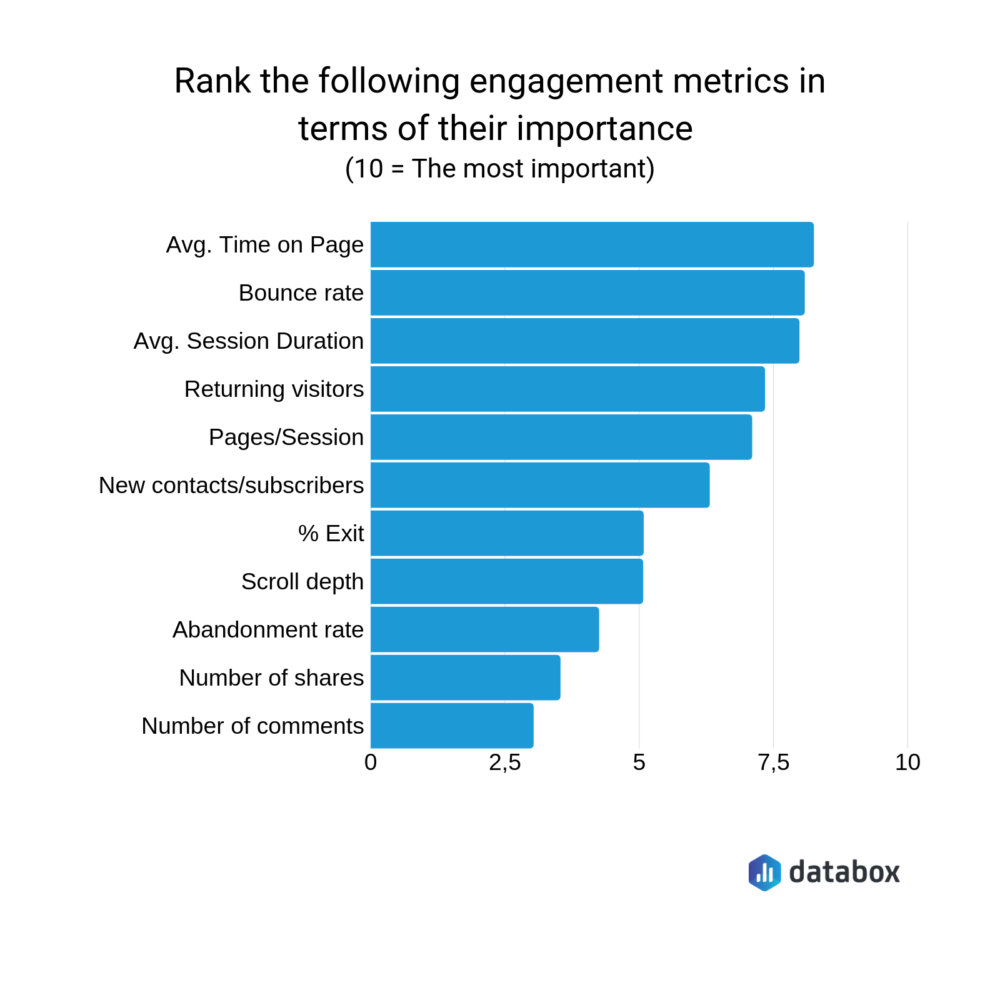
But we also heard about other engagement metrics that aren’t usually talked about as much.

Our research also found that a majority of the marketers we spoke with use Google Search Console to do all of this measurement and tracking.
The 14 Website Engagement Metrics Every Marketer Needs to Track
PRO TIP: How to track these 10 popular Google Analytics 4 metrics
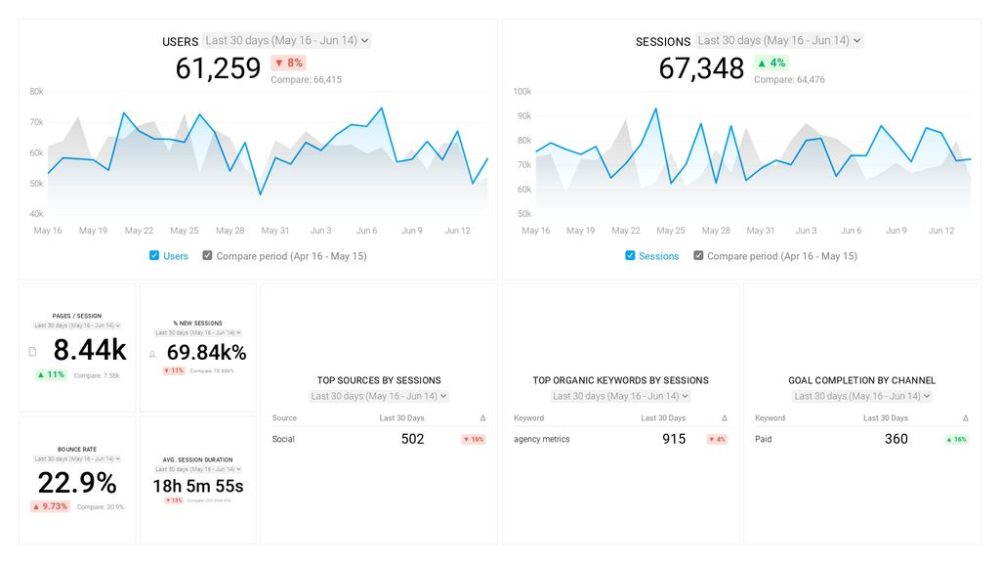
Sure, there are dozens (and dozens?) more Google Analytics 4 metrics you could track. But, starting with these 10 commonly tracked metrics will give you a pretty high-level view of how your marketing is working…
- Sessions: The number of sessions can tell you how many times people are returning to your website. Obviously, the higher the better.
- Sessions by organic keyword: Which organic keywords bring in the most traffic to your website? This may help you determine whether your SEO investments are paying off.
- Bounce rate: Do visitors leave shortly after landing on your website? Or do they stick around?
- Average session duration: How much time are people spending on your website? Users with a high average session duration are most likely relevant to your company.
- Goal completions: How many users responded to your call to action?
If you want to track these in Google Analytics, you might find the visualizations limiting. It’s also a bit time-consuming to combine all the metrics you need in one view.
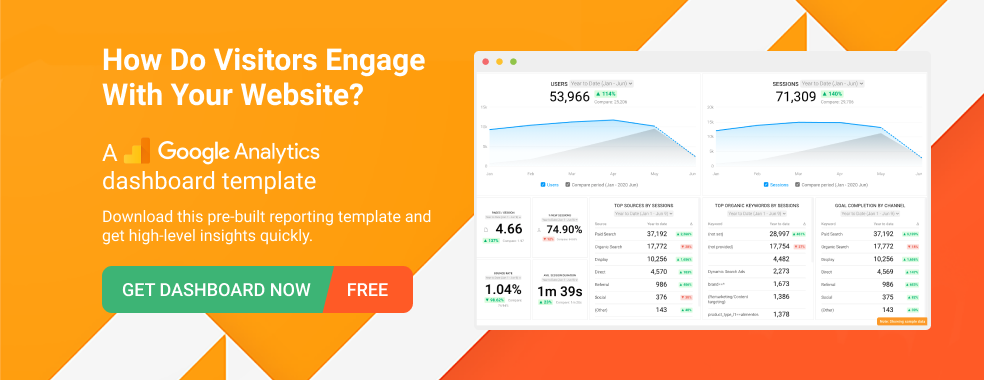
To better understand how your website performs in terms of traffic growth and conversions, we’ve made this plug-and-play dashboard that contains all the essential metrics for understanding how successful you are at optimizing different aspects of your website.
You can easily set it up in just a few clicks – no coding required.
To set up the dashboard, follow these 3 simple steps:
Step 1: Get the template
Step 2: Connect your Google Analytics account with Databox.
Step 3: Watch your dashboard populate in seconds.
1. Bounce Rate
“The bounce rate tells you how many website visitors opened your page and then went right back to Google. It can be a good indicator of how well your content is answering their questions and its readability,” explained Alice Stevens of Best Company.
“Bounce rate is crucial in determining whether something is wrong with your website and, therefore, why visitors aren’t exploring your site further,” added Fiona Kay of Nigel Wright Group.
“Just like in the real world, first impressions make a big difference on the web,” Maple Holistics’ Nate Masterson told us. “You can expect to see a high bounce rate if your visitors feel spammed by too many calls-to-action or feel bored by lack of quality web page design.”

“It’s all well and good having high traffic to your site, but if the bounce rate is also high, your content isn’t engaging people enough to stick around,” Katherine Rowland of YourParkingSpace added. “Ultimately you want your content to entice people into taking action, and if they aren’t then really what is the point.”
As far as analyzing bounce rate data, Dan Rawley of Twinkl advised looking for pages with the highest bounce rate to tackle first, “Filtering pages by those with the highest bounce rate allows you to easily spot where people aren’t engaging with the site as expected and take action.”
Beth Noll of Gift Observer recommends using 90% bounce rate as a benchmark, noting that overly high bounces “could be due to lack of guidance (call to action buttons) or that the website isn’t relevant to their search query. A high bounce rate could also be down to the site’s appearance and lack of trust (e.g. no HTTPS, slow at loading or lack of social and trust signals).”
Weidert Group’s Kelly Wilhelme told us it’s most useful to look at bounce rate over time to find anomalies and changes, saying, “It’s important to look at the bounce rate for your site over time to make sure it’s not increasing. This could indicate something is broken and have a negative impact on your SEO and organic traffic rank. The last thing you want is for Google to stop sending you traffic because users are not finding what they need.”
And Kris Gunnars of Search Facts shared this pro tip: “I like to change the bounce rate calculation in Google Analytics to an ‘adjusted’ bounce rate. By changing the Google Analytics snippet and adding a ‘setTimeout’ command, you can tell Google to count a visitor as not having bounced if they’re still on your site after 15 seconds.”
“With the adjusted bounce rate, the metric becomes much more meaningful,” Gunnars added. “A high rate means that people are leaving the site immediately after landing on it, which is clearly a bad thing.”
Use this web analytics dashboard to visually monitor your bounce rate data in real-time.
2. Pages Per Session (or Page Depth)
The pages per session metric is, in effect, what comes right after bounce rate. So the visitor didn’t bounce off the first page, what did they do next? How many more pages did they visit and engage with?
“How many pages are visitors viewing in a session? Are the people viewing the most pages from a specific cohort?” asked Alex Vale of Attio. “You can use the metric to reveal your most dedicated audience, and then tailor your output specifically for them.”
“It’s a fantastic way of understanding which pages are guiding users deeper into the website and which aren’t. It can reveal issues with internal linking, conversion rate problems, lack of multimedia on the page, and more,” said William Taylor of MintResume.
Dallin Hatch of Womply added, “It’s one of the best proxies to gauge both the value of your content to visitors and the optimization of your site layout.”
Quincy Smith of ESL Authority explained that pages per session is one of the most important metrics they measure. “Pages per session is a big one for us because we use content to drive users into our conversion funnel. The more pages a user views, the greater the chance that they’ll convert in some way.”
“If you are able to nurture a visitor’s interest and hold their focus over a range of pages, then they’re more likely to take action,” added Anna Kaine of ESM Inbound.

3. Average Session Duration
“Every marketer should be tracking average session duration,” said Joe Sloan of Challenger School.
“Average session time is one of the most telling website engagement metrics and holds great value in understanding how effectively your site meets the intent of users,” Kyle Kasharian of 9Sail added. “Higher average session times typically mean that user intent is being met and that users are engaging with your content.”
Sloan explained that “average session duration is great to understand what sources are resonating with your target market. For example, you can see if a recent Facebook campaign is attracting the right customers after just a few days, rather than waiting a few weeks to review the conversions. ”
“If the average session duration is higher than 60 seconds and users aren’t navigating or converting, there’s something wrong with the call-to-action,” explained Ayesha Ambreen of Right Solution. “If the average session duration is less than 30 seconds and people are bouncing off, the UI needs work.”
4. Click-Through Rate (CTR)
Antonella Weidman of WebTek told us that website engagement also comes down to click-through rate on your search results. “If your website is getting a lot of impressions in search but has a low click-through-rate, this is a sign that the title tag and meta description may need to be refined to entice more users to click.”
5. Exit Rate and Top Exit Pages
“If you could figure out the reasons people exit your website from a particular page, you could fix it to keep people on your website for longer. Longer stays not only win you SEO benefits but help you build relationships, too,” mused Zarar Ameen of CANZ Marketing.
That’s where looking at exit rate and your top exit pages come into play. As Rochelle Burnside of Best Company explained, “The most frequent exit pages are telling you when something is wrong. Take a look at your top exit pages and look for what they’re missing. Are they slow loading? Do they lack a CTA? Sometimes only a quick fix is required to turn an exit page around and increase conversions.”
Faizan Ali of WPBeginner shared some of the common reasons for a high exit rate, including:
- Hierarchical issues and poor information organization
- A missing call-to-action
- Including too much or too little information for a visitor to take the next step
“This is vitally important to your business because it helps you understand what your customers are thinking and how they respond to your website in general,” Colin Mosier of JSL Marketing & Web Design added. “Once you find where your customers leave your website the most, you can optimize this area and improve your customer acquisition.”
Editor’s note: Want to see all your key website engagement metrics in one, comprehensive dashboard? Download this free Google Analytics: Website Engagement (Data Snacks) template to bring together bounce rate, exit pages, average time on page, and more.

6. Returning Visitors
“More returning visitors means a bigger group of engaged people to build a relationship with,” noted Laetitia Caron of MedicalSearch.
“You have many ways to attract visitors to your website, but what really counts is the amount of (qualitative) visitors returning to your website,” Caron added. “Returning visitors mean your touchpoints are working, that people are satisfied after their first website visit.”
“Often, potential clients are browsing multiple providers,” explained Rigits Bookkeeping & Accounting’s Julia Kelly, “which means they may look at five or ten sites before contacting you. Increasing your returning visitors (especially around important keywords) is essential for winning that business.”
7. Time on Page
“Average time on page is the king,” Dan Young of Loud Digital said. “Combined with the Comparison data view, you can quickly see which pages let your website down or put users off.”
Doug Stewart of Appleton Creative added, “By looking at the average time spent on-page, you can help to determine the quality of your website traffic. For example, if you’re getting a significant amount of website visitors, but users are spending only seconds on a page, this could be a key indicator that your targeting strategies are off and need to be adjusted.”
G2’s Bridget Poetker echoed Stewart, saying, “Average time on page is a big indicator of how engaging your content is. The higher the number, the more your content most likely matches the exact search intent.”
“We like measuring this metric in conjunction with tools like HotJar to allow us to clearly visualize a customer’s on-page journey,” added Lewis Kemp of Lightbulb Media.
When it comes to improving average time on page, Johnny Santiago of Berify shared this advice, “To improve your website’s average time on page, you could try making your content more engaging by adding visuals such as images, gifs, or maybe even try embedding videos. Also, try enhancing the readability of your content by breaking up long paragraphs into smaller chunks and by adding bullet points.”
8. Goal Conversions and Event Tracking
Several of the marketers we heard from recommending tracking an engagement metric that doesn’t come standard with Google Analytics—by using the goal conversions and event tracking features to tailor GA to your own needs.
“The single most important website engagement metric is different for every website and every company. The most important engagement metric across the board is simply the most relevant action you want visitors to take,” explained Jorge Sheffy of Loclweb. “That means every website should have a goal set up in Google Analytics, and completion of that goal should be closely tracked.”

“Usually marketers focus too much on standard and average metrics, while events get ignored,” Nikola Kožuljević of Smartlook said.
Evan Elizabeth Harder of Hello Marketing Agency agreed. “I often see folks using gross traffic numbers to justify keyword value and content decisions. You’re better off setting up event tracking to understand what key phrases actually drive ROI. Then you can make smarter content decisions that drive real value.”
Christina Brodzky of MediaSesh pointed out that events can include micro-conversions like email newsletter signups, new blog comments, etc. and macro conversions like product purchases and revenue.
“B2B marketers should track how many times people clicked on that .pdf download button,” Kožuljević added. “Ecommerce owners can optimize their cart-to-purchase sequence by using events on specific interactions.”
Editor’s note: Need a better way to connect website engagement with the real, dollar value it drives? Download this free Targeting, Engagement, Revenue dashboard to view engagement metrics side-by-side with conversion rate, revenue per visit, goal conversions, and more.

9. Dollars Per Visitor
“Sometimes, it’s easy to get infatuated with total visits,” observed Antonella Pisani of FACT goods, “but it’s fairly easy to buy traffic.” Instead, Pisani recommends measuring more conversion-oriented metrics like dollars per visitor.
“By watching dollars per site visitor, you can ensure that you’re driving qualified traffic that’s translating into revenue.”
10-11. New Leads and Leads Per Visitor
New leads are “the resounding metric that signals the culmination of all your writing, tactics, and hard work that produces the coveted new lead,” Eric Melillo of COFORGE told us.
“The most important website engagement metric is the percentage of leads generated by the number of visitors,” said Jonathan Aufray of Growth Hackers. “The goal is to keep improving the conversion rate by changing the copy, using power words to entice people to contact us or give us their email address, etc. If this week, you have a conversion rate of 10%, let’s try to do 11% next week, 12% the following week, and on.”
“As new leads per visitor calculates how many visitors from your website’s traffic convert to leads, keeping a careful watch on this ratio will flag indicators if something on-page could be altered or optimized,” explained Leo Friedman of iPromo. “If your ratio is less than 2%, your marketing strategy could be driving traffic, but not potential customers with intent to buy.”
12. Conversion Path
Matt Desilet of Lola says the most important website engagement metric is funnel creation and conversion paths.
“While it’s not a ’round number’ metric, it gives you a visual understanding of the steps people take to convert on your site. This is the building block for creating your attribution model.”
“Pages per session is probably the closest number to track to see if you can’t reduce that number within conversion paths,” Desilet added.
13. Value by Source/Medium
In a similar vein, Andrew Seidman of Digital Reach recommends tracking value by each source/medium.
“Technically, this isn’t purely website-level, as it requires full-funnel tracking,” Seidman admitted, “but putting a dollar amount on clicks from each source and medium dramatically illuminates strategy.”
14. Link Sharing
“When someone views a web page and shares it on social media or on their website, it’s the ultimate form of website engagement,” Eddie Johnson of Anabolic Bodies mused.
“Every time a link is shared, it creates an expanding domino effect where more people are exposed to the content, who in turn can share it to even more viewers.” And that’s something you want to measure and encourage. That’s why Johnson recommends tracking link and social shares as part of your engagement analytics.
Boost Website Engagement By Monitoring Metrics That Matter
Tracking engagement metrics on your website can help you take your web analytics game one step further, developing a better understanding of how your target customers interact with and respond to the content you put out online.
By measuring a range of diverse website engagement metrics with a marketing dashboard, you’ll get a more rounded view—making it easier to identify blips and broken things, so you can optimize for more engagement from the visitors that matter for your business.

![Organic vs. Paid Social Media Strategies: Which Are Better for Achieving Marketing Goals? [Insights from 100+ Experts]](https://cdnwebsite.databox.com/wp-content/uploads/2020/07/17021427/google-ads-goals-1000x563.png)

