


Table of contents
We’ve added new campaign group metrics for LinkedIn Ads in Databox, allowing you to get even more granular into the performance of groups of campaigns you’re running on LinkedIn.
Campaign groups are used by advertisers on LinkedIn to group related campaigns, either by various target audiences, marketing objectives, demographics, etc., together.
By doing so, they can answer questions like:
- How does campaign engagement differ by region?
- Which ad type is most effective for various demographics?
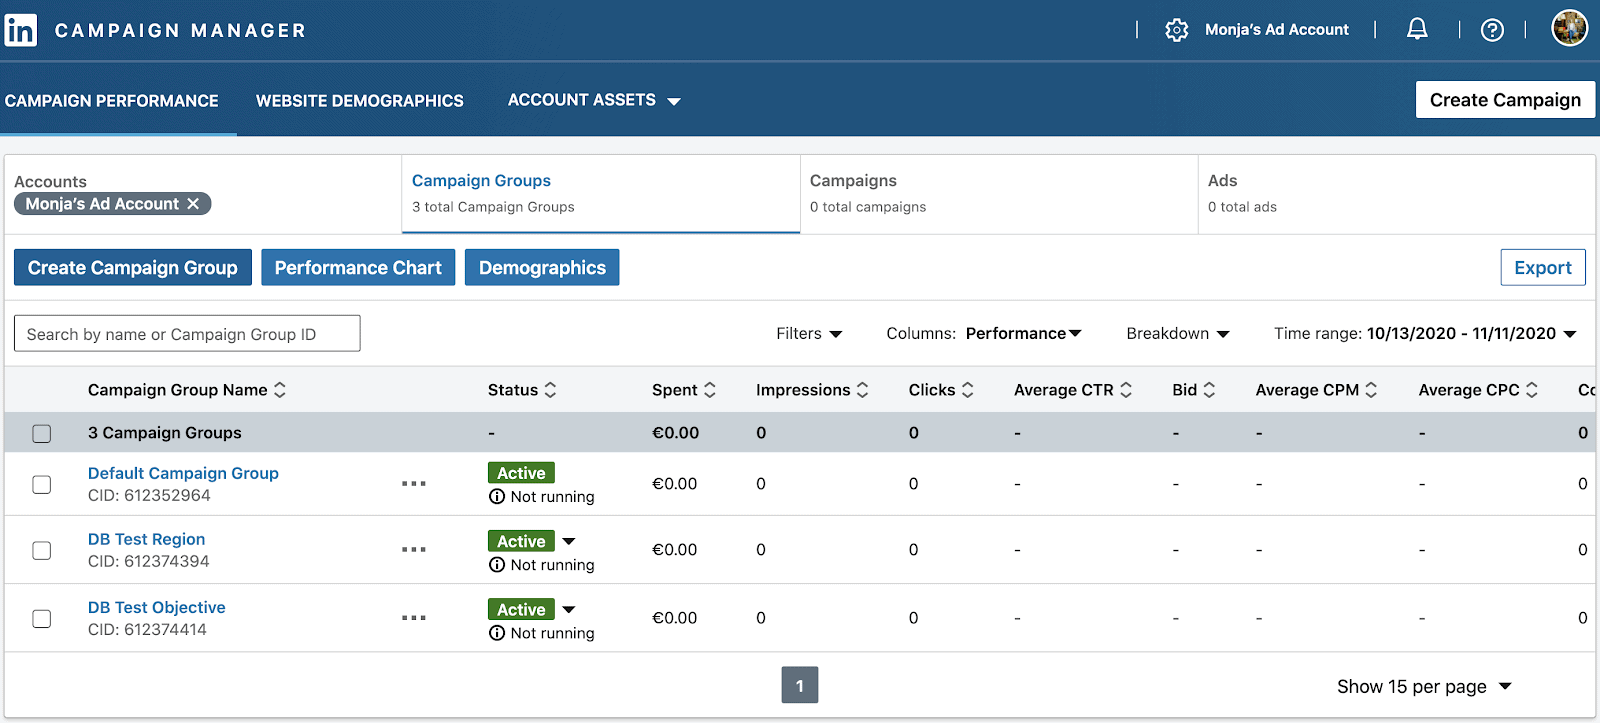
Campaign Groups are an organizational tool in your LinkedIn Ads Campaign Manager.
They’re accessible on your account’s overview page by selecting the Campaign Groups tab.
Once you have Campaign Groups set up in your LinkedIn Ads account, you can track and visualize their associated performance in Databox.
In Databox, Campaign Group has been added as a dimension to 11 basic LinkedIn Ads metrics. This means you can go beyond general metrics like impressions and clicks in order to dig into specific things like:
- Impressions by Campaign Group: So, let’s say you have a campaign group set up for all campaigns launched in the US, and one for all campaigns launched in the UK––you can compare impressions across both campaign groups to see which region is seeing more of your advertisements.
- Conversions by Campaign Group: Maybe you have a campaign group set up for all of your text ads and one for all of your sponsored InMail ads on LinkedIn. Now, you can measure both of these campaign groups against each other to see which ad type generates more conversions.
Each metric is pre-built, meaning all you have to do is drag-and-drop it into a dashboard and the visualization will populate automatically.

Which LinkedIn Ads Metrics Were Added to Query Builder?
With the 11 new LinkedIn Campaign Groups metrics now available in Databox, you can dig deeper into the performance metrics of your LinkedIn ad campaigns.
Here are all 11 New LinkedIn Ads metrics with the Campaign Groups Dimension ready for you to use:
- Impressions by Campaign Groups
- Clicks by Campaign Groups
- Conversions by Campaign Groups
- Leads by Campaign Groups
- Engagement by Campaign Groups
- Social Actions by Campaign Groups
- Spent by Campaign Groups
- Avg. CTR by Campaign Groups
- Avg. Engagement by Campaign Groups
- Avg. CPC by Campaign Groups
- Avg. CPM by Campaign Groups
If you haven’t done so already, you’ll want to set up your Campaign Groups on LinkedIn Ads first. This will allow you to visualize the performance of all of your campaign groups inside of Databox.
PRO TIP: Here Is Your Go-To Dashboard for Tracking and Reporting on Marketing Efforts Across Multiple Social Media Platforms
To monitor the impact of your social media marketing efforts, you may have to log into multiple tools to check how your accounts on different social networks are performing and spend hours compiling a comprehensive report. But, with Databox, social media reporting doesn’t have to be a time-consuming chore anymore.
Now you can quickly assess your social media performance in a single dashboard that monitors fundamental metrics, such as:
- Sessions by social source. See the total number of sessions each social media channel generates on a monthly basis.
- Total number of Facebook page likes. See the total number of likes your Facebook page has acquired over time.
- Number of followers. View the number of followers you have on any social media channel – LinkedIn, Twitter, and/or Instagram.
Now you can benefit from the experience of our social media experts, who have put together a plug-and-play Databox template showing the most important KPIs for measuring the impact of your social media marketing efforts from multiple channels. It’s simple to implement and start using as a standalone dashboard or in marketing reports, and best of all, it’s free!

You can easily set it up in just a few clicks – no coding required.
To set up the dashboard, follow these 3 simple steps:
Step 1: Get the template
Step 2: Connect your Social Media accounts with Databox.
Step 3: Watch your dashboard populate in seconds.
Getting Started
If you have any questions or need help getting set up, you can visit our Knowledge Base or send us a message at help@databox.com and let us know which metrics you would like to track.
Do you have improvement ideas or feature requests? Curious about what’s coming to Databox? Check out our interactive product roadmap that allows you to request, upvote, and stay updated on product updates.
For current Databox users, log in to your Databox account to start annotating your dashboards.
New to Databox? Start by creating your free account. From there, you’ll be able to connect your data from more than 70 different platforms.


