![Now You Can Track & Visualize Your Eventbrite KPIs in Real Time [New Integration]](https://cdnwebsite.databox.com/wp-content/uploads/2018/03/09172702/eventbrite-blog.jpg "Now You Can Track & Visualize Your Eventbrite KPIs in Real Time [New Integration]")
Table of contents
Ready to take your event marketing strategy to new heights?
Starting today, Databox can help.
We’re excited to officially announce our new integration with Eventbrite, where you and your team can now track your event marketing alongside your other marketing channels.
Not only will this help provide deeper insights into how your events perform, but now that you can track your event marketing metrics alongside your other channels, you can dig for deeper attribution insights and learn more about how each channel influences your overall company goals.
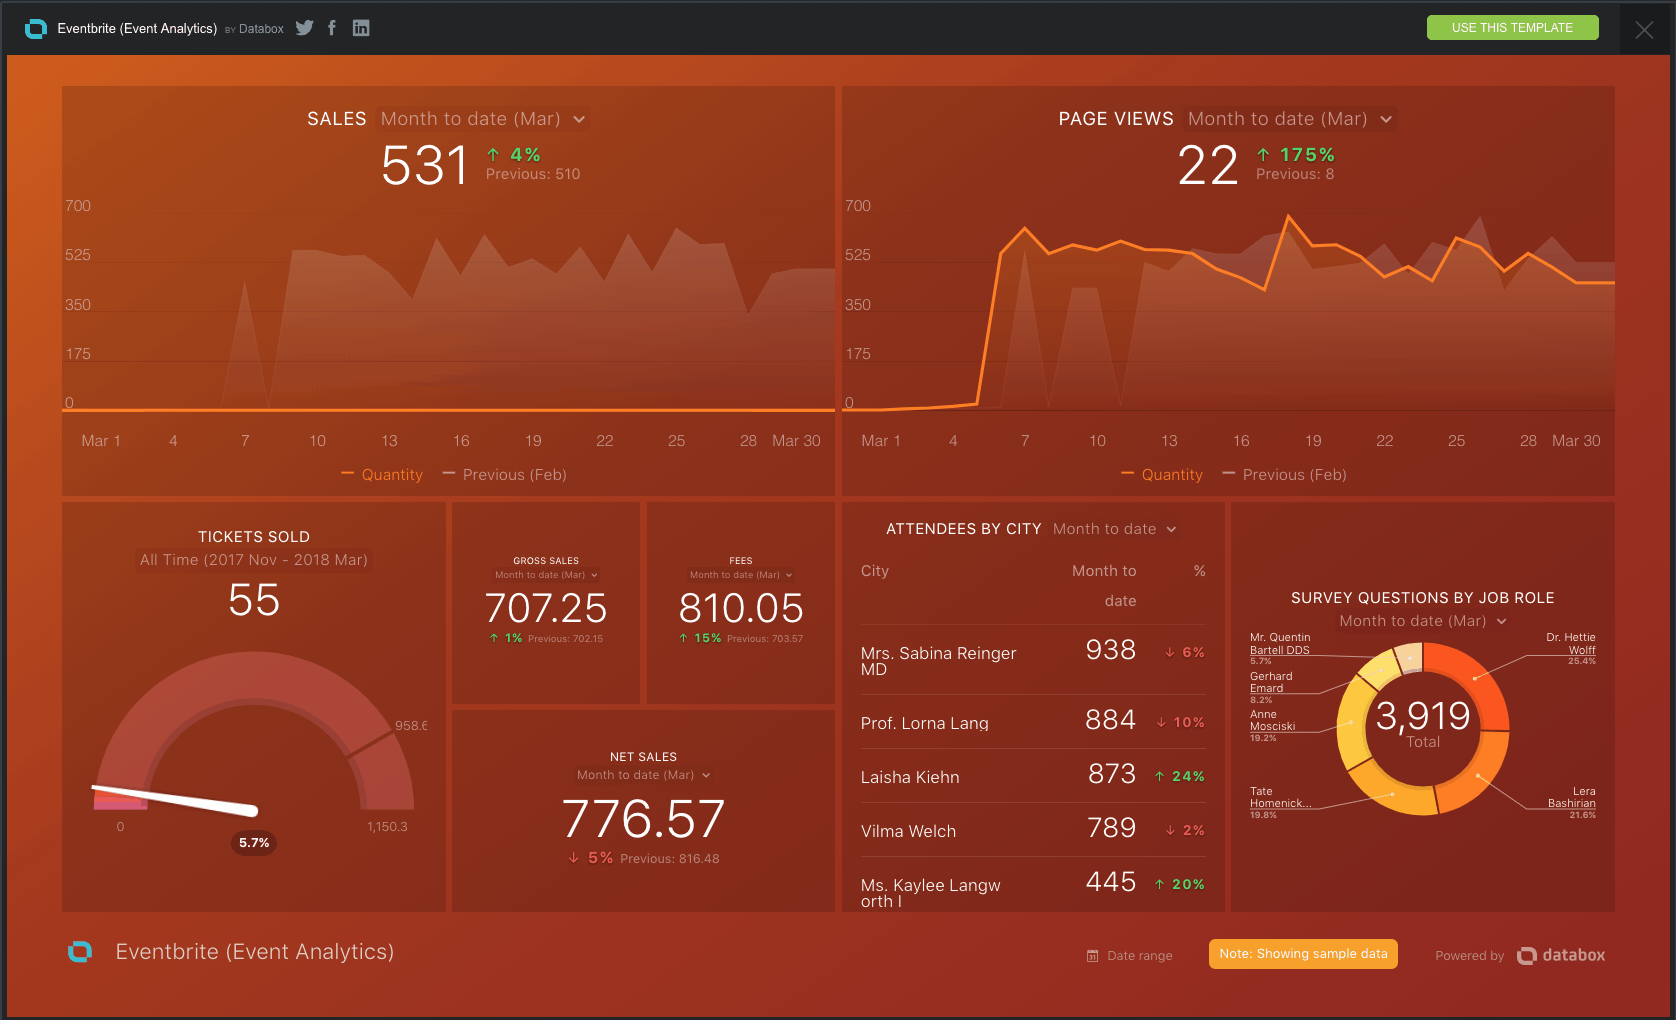
About the New Eventbrite Integration (w/ free template)
What this means for your event marketing
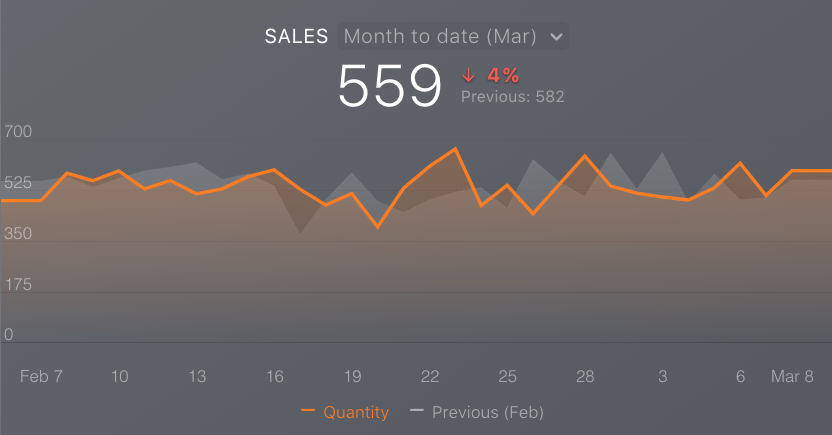
For starters, this allows you and your team to have a more detailed look at how your event is shaping up. Instead of tracking progress in tables or spreadsheets, you’ll have visual, more accessible views on progress toward your event goals in real time.
Just sent a big email campaign promoting next month’s event?
Planning on running some social promotions to drive ticket sales?
Your Eventbrite dashboard will allow you to monitor daily fluctuations so you can get a better handle on the specific channels and initiatives that are driving event sales.
Hit your event goals
Have a goal in mind for how many tickets you want to sell?
By creating goals in Databox around your specific events, you’ll also have a much better view on how you’re currently tracking toward that goal, as well as proportional estimations for staying on track, i.e. the number of tickets you need to sell every day, and every week, in order to hit your monthly goal.
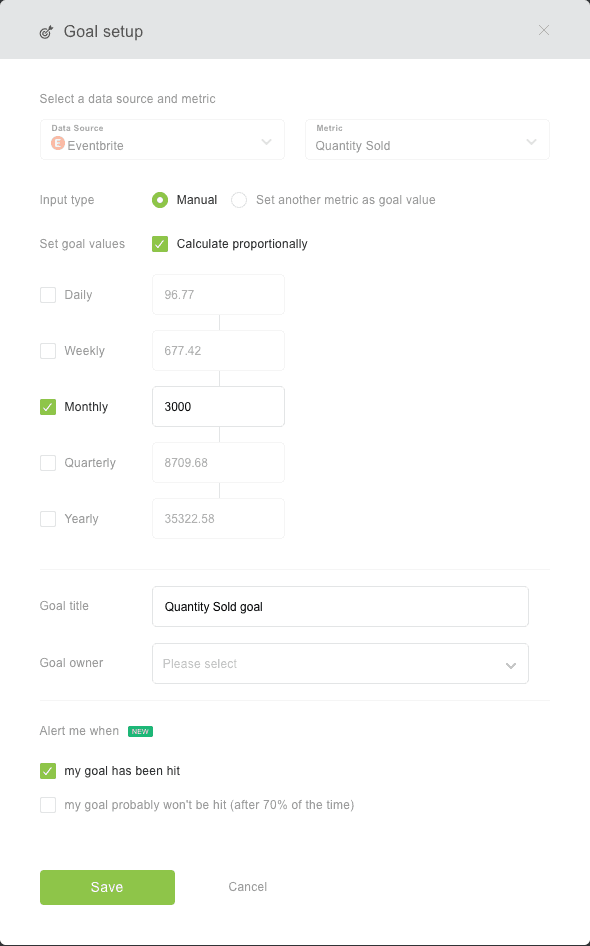
This not only helps direct your event marketing strategy but also allows everyone on your team to track progress toward your event goals at any given moment.

Getting started
While you can customize your dashboard later by adding different metrics and visualizations, the quickest way to get started is by downloading our Eventbrite template, which allows you to track some of your vital event KPIs right out of the box.