


Table of contents
You’re accustomed to tracking metrics in a certain way within popular tools like Google Analytics, Search Console, MailChimp, HubSpot, Facebook Ads, and Salesforce.
So, why do dashboard software and business intelligence tools make you figure out how to visualize data from these tools – all over again?
With Databox, we’ve pre-configured 3,000+ of the most common metrics from every integration we’ve built. Just connect any one of these 65 tools, then choose the metrics you want to instantly visualize.
But, with these latest updates in Databox, we didn’t just add a significant number of new pre-built Datablocks for every one of our integrations.
We also made improvements to help you quickly find and visualize the KPIs that are important to you.
Read on and discover why our customers consistently rate us the easiest to setup tool on the market.
See these updates in action
What’s new?
1,712 new pre-built Datablocks
Our Datablock Library now has 3,159 pre-configured Datablocks. And what’s best, we are also bringing new Custom and Calculated metrics to the Library.
Now, it’s easier than ever to add metrics like ‘Pageviews per Session by Device’ from Google Analytics or ‘Average CPC by Campaign’ from Facebook Ads.
Pre-built Datablocks are categorized into one of three groups: Basic, Custom, and Calculated.
- Basic Metrics are the metrics that come stock with any specific data source. Like ‘Sessions’ from Google Analytics. They are the most common metrics companies track and they don’t vary from company to company.
- Custom metrics use Query Builder to filter metrics by specific dimensions in order to pull even deeper insights. They’re less common metrics and ones that may be unique to your business. They are only available with the integrations that support Query Builder and for users that have Query Builder included in their plan.
- Calculated metrics use Data Calculations to combine data from any source and calculate new metrics, conversion rates, ROI, and more. These are ready to be used by users that have Data Calculations enabled.
To learn more about different types of metrics, read our help article here.
Improved left-hand side panel in Designer
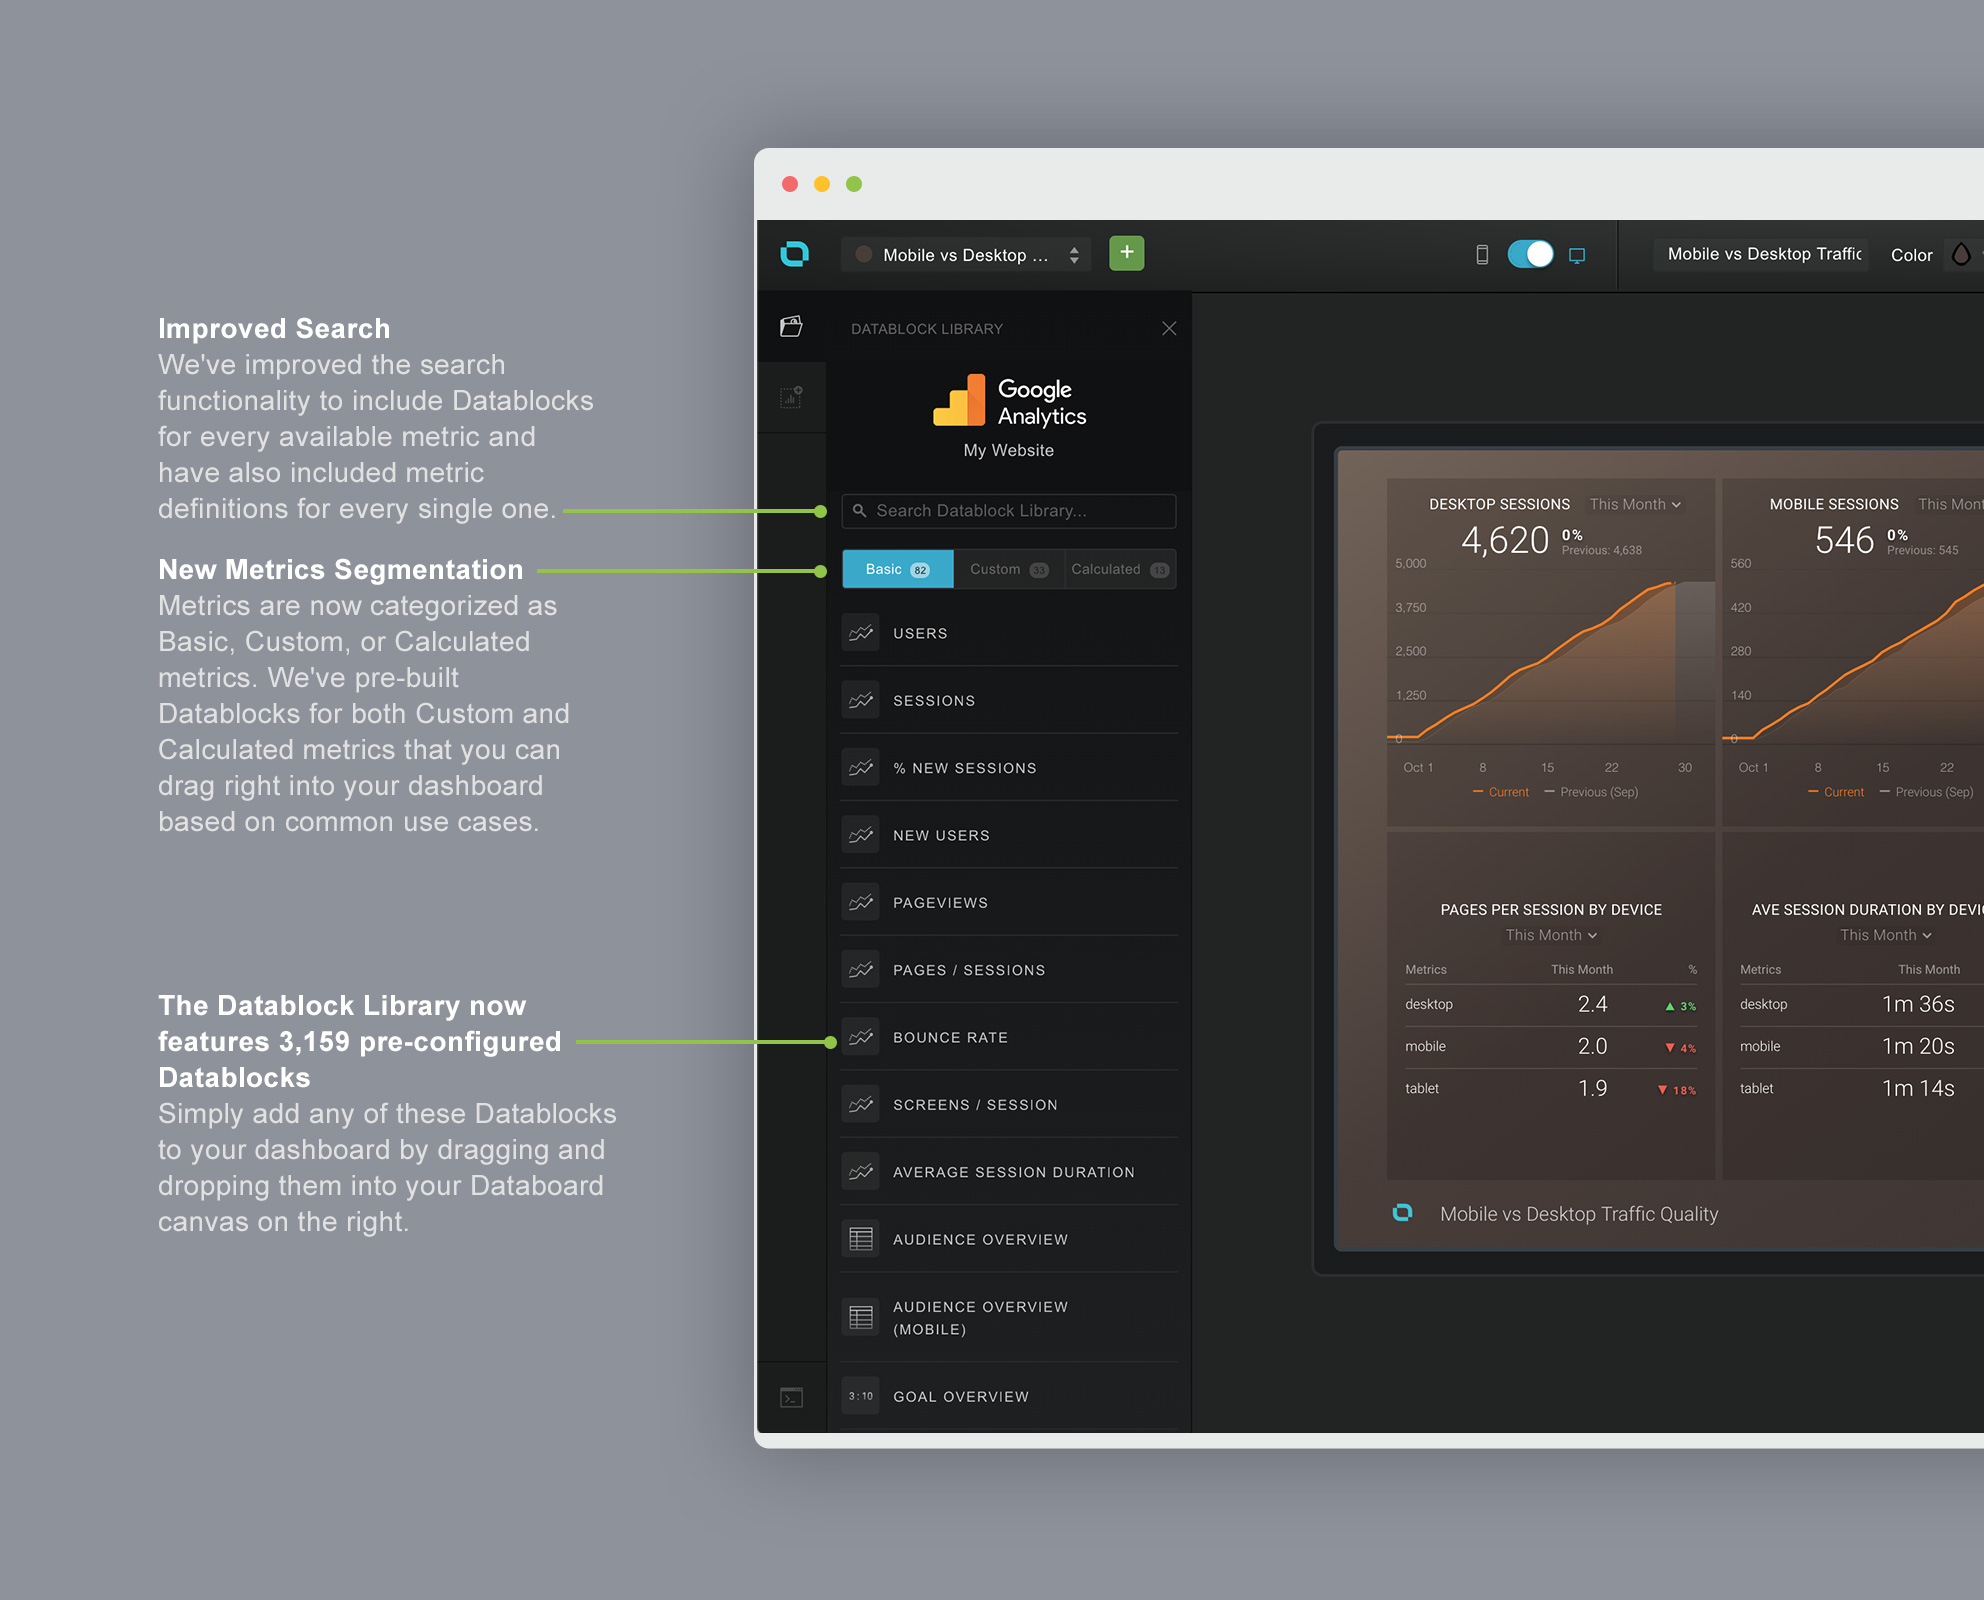
Using the Dashboard Designer, you can customize your view of performance and quickly pull the metrics you need, visualize KPIs in a variety of ways, and build beautiful dashboards–no code or design skills necessary.
Now that we’ve added over 1,000 new pre-configured Datablocks, the left-hand panel in the designer has been updated to display every available metric for any specific data source, including Custom and Calculated metrics. This makes it even easier to quickly build the perfect view of performance across every department of your company.
Simply drag & drop your desired Datablock to the Databoard canvas and the data will populate automatically. We’ve also added an improved search bar atop the Datablock Library to make it easier for you to find the metrics you need right now.
New ‘Metrics’ page
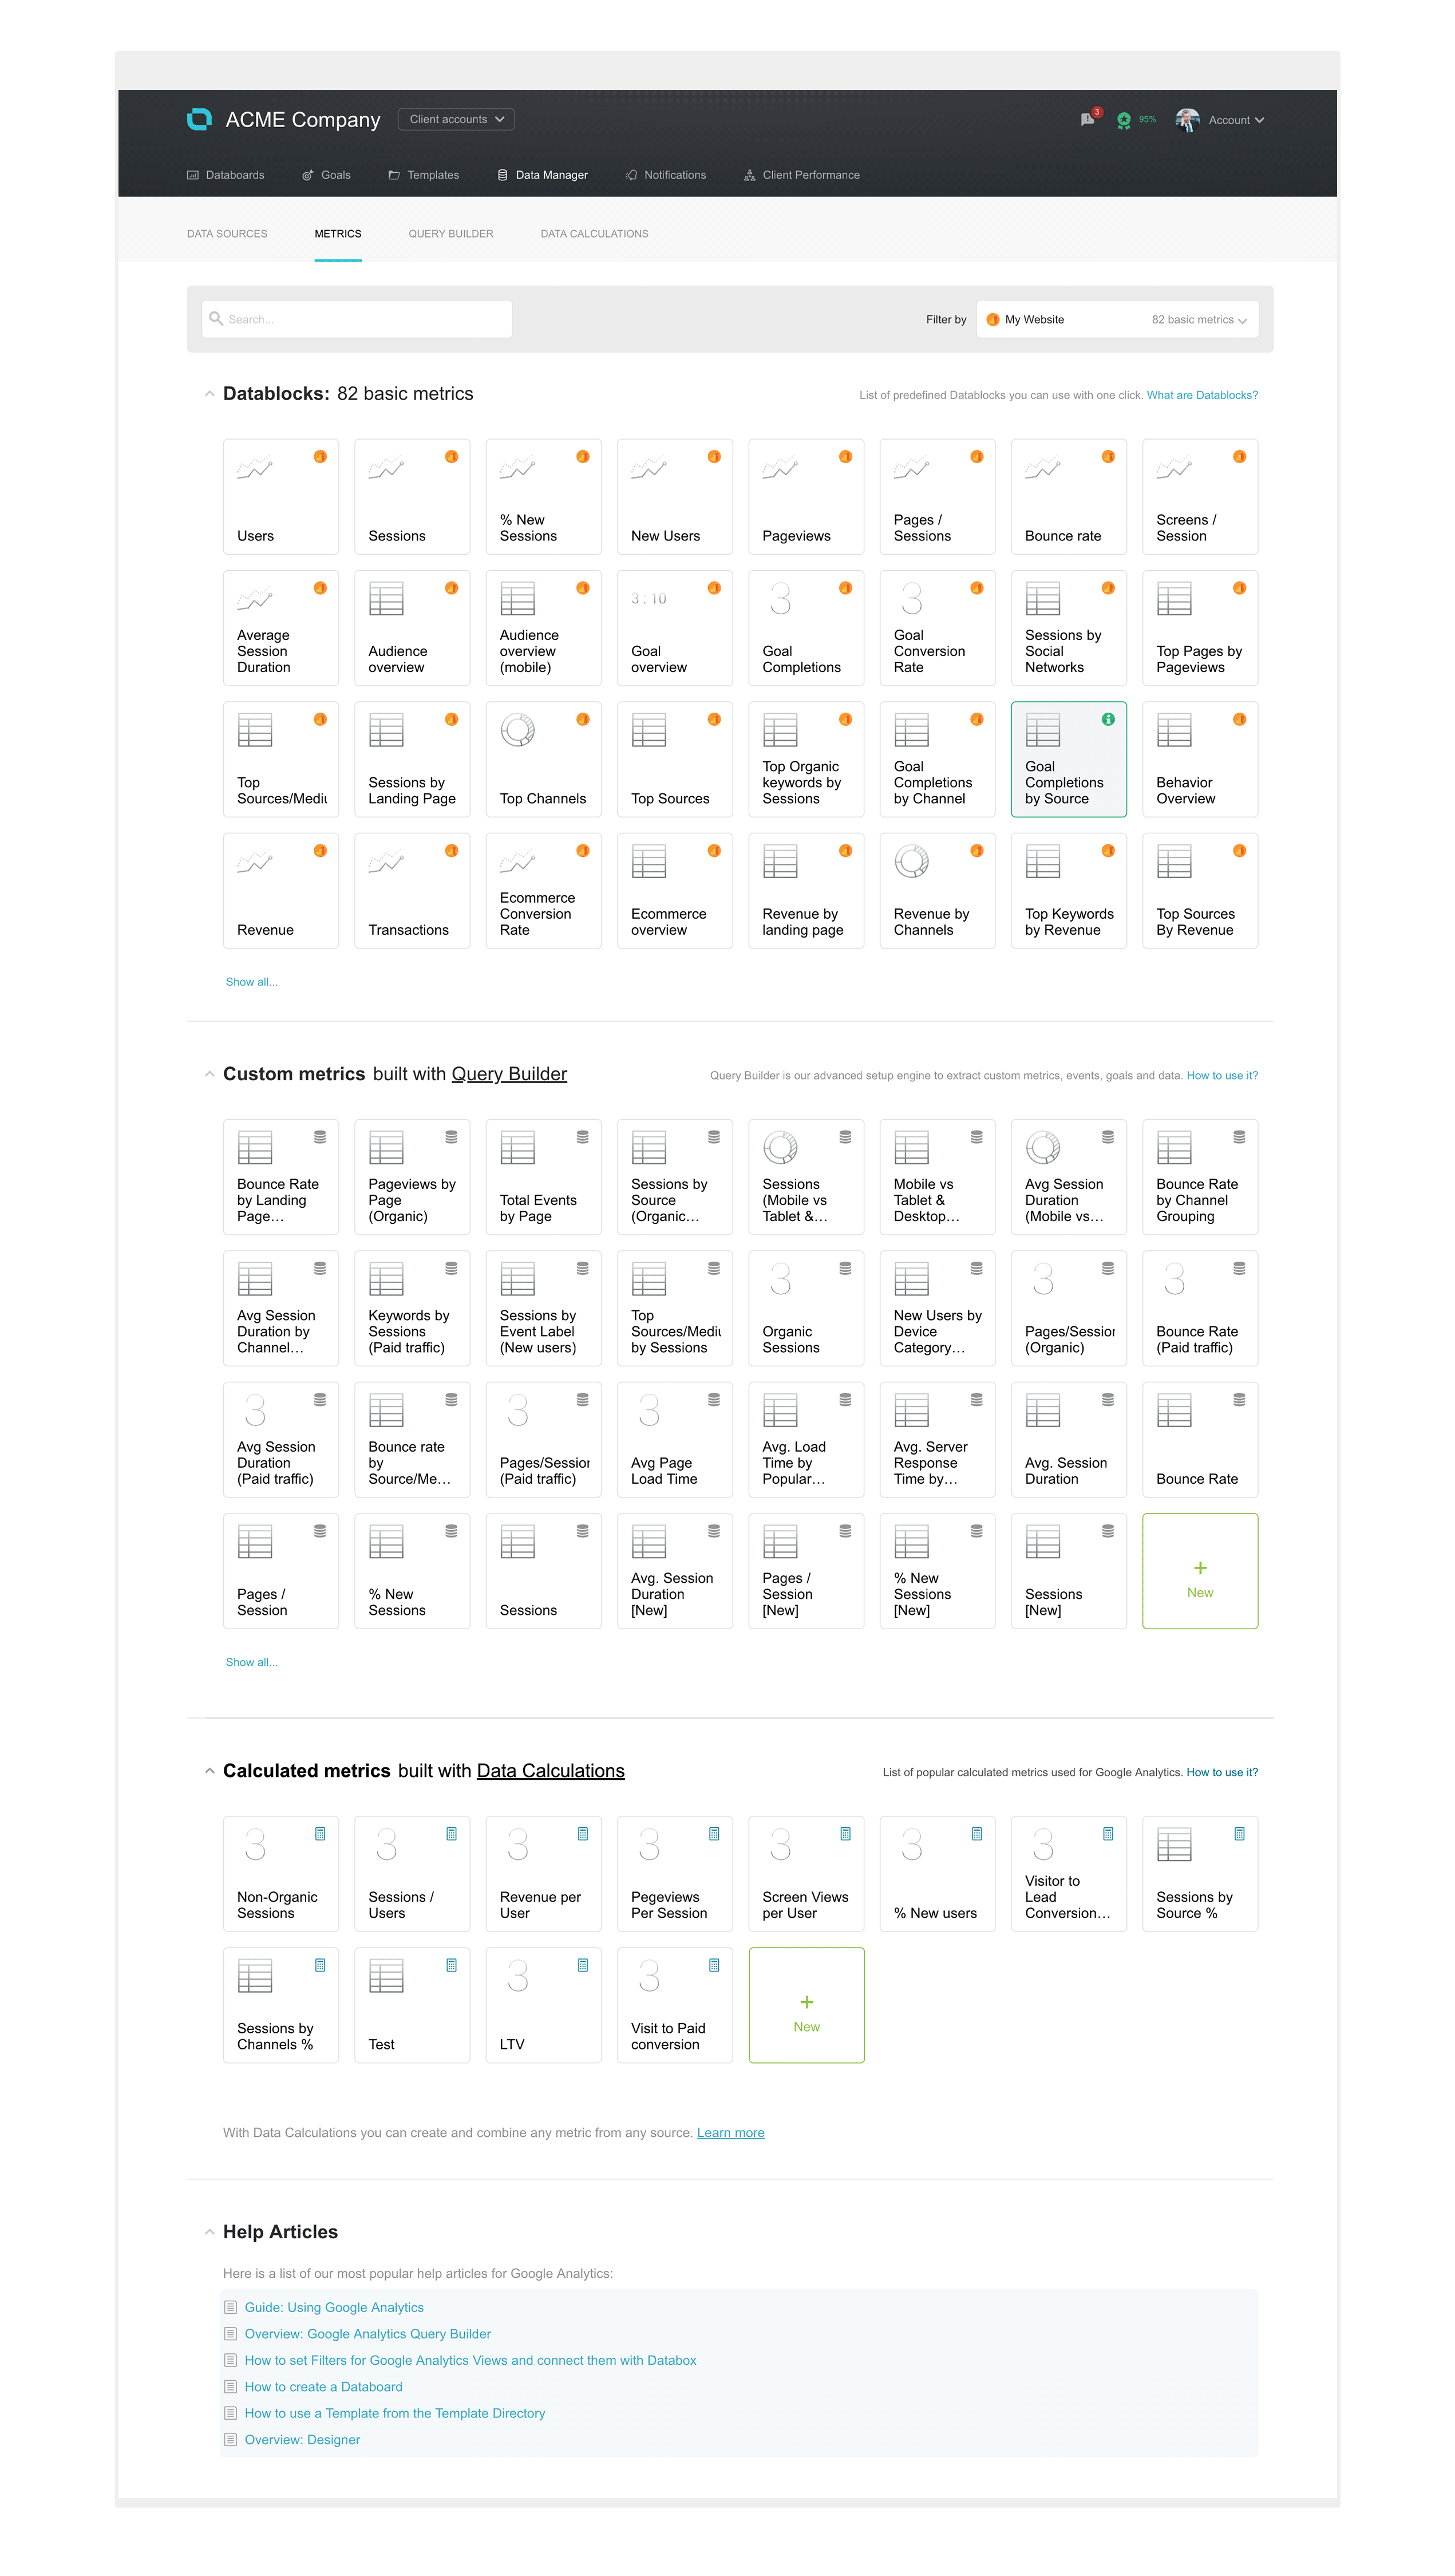
We have added a new page under the ‘Data Manager’ tab, with an overview of all available metrics for all our integrations.
You can also explore integrations that you haven’t connected yet to see which metrics we support.
On the bottom of the page, you’ll find relevant help articles for each integration with all the information you need to get your desired metric into Databox.
This new page is also fully actionable, meaning, you can add any of those metrics to your Databoards with just one click.
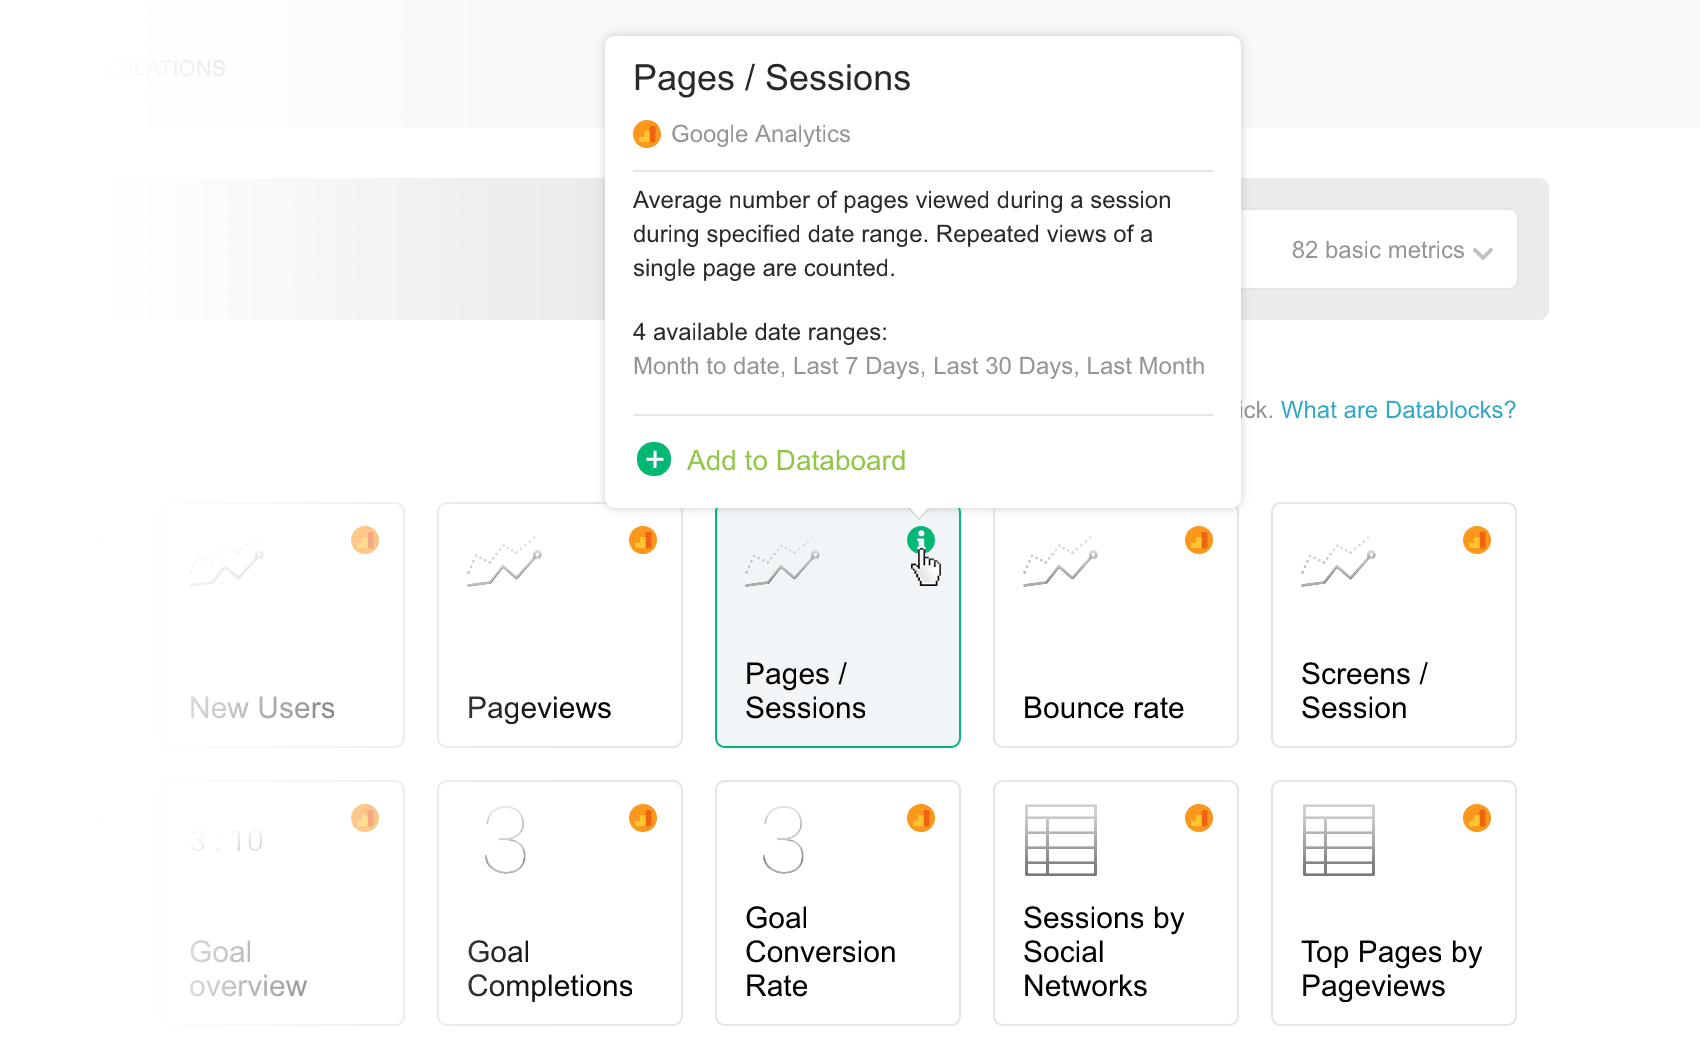
To learn more about a specific metrics, hover over the info (i) icon and you’ll see a full description of that metric, as well as all the available date ranges you can track with it.
Improved search
Since we’ve added so many new pre-configured Datablocks, it might be hard to find the metric you’re looking for without great search functionality.
Great news–we’ve improved the search algorithm so that any time you search, you’ll see every available Datablock for that metrics (one metric can have several Datablock visualizations) and their definitions, too.
For example, when you search for ‘Sessions’ in the search bar, you’ll also find ‘Sessions by Social Network’, ‘Sessions by Landing Page’, etc., in addition to ‘Sessions.’
The same improvements have been made when searching for a pre-built template, too.
Get Started
The Datablock Library is free. Build meaningful, multi-device dashboards in minutes.
Existing users who already have access to Databox can simply login here to check out these updates.
Don’t have an account yet? Create a free account here.
Want to play a role in helping make Databox (more) awesome? We’d love your feedback on these latest changes here.


