


Table of contents
Traffic alone won’t make you sales. You need to understand and direct that traffic down your marketing funnel.
But to do that, you need to first know what your traffic comprises of.
You need to know who’s coming to you, where they are coming from, what they are doing, and when they are leaving you.
A marketing analytics tool helps with just that.
In this guide, we’ve reviewed the top 10 marketing analytics tools out there — the ones that really make your life easy and are truly worth the money.
We’ve also shared how to choose the right marketing analytics tool just before the detailed reviews.
So, without further ado, let’s dive in!
How to Choose the Right Marketing Analytics Tools
When looking for the right marketing analytics tool, assess your options in two parts:
Part 1: Choosing by Functionality
Functionality refers to the capability of the tool (i.e., the features).
If you pick one with the most features, you’ll end up paying more than you need to. No marketer uses all the features after all.
To avoid overspending, focus on identifying the features you truly need. If you’re unsure of your requirements, start by ensuring the tool covers these six essential functionalities:
1. Data Integration and Connecting Data Sources
Integrating data from different sources is essential because it helps you see the full picture of your marketing efforts. For example, combining data from your email campaigns, social media, and website traffic can reveal how your customers interact with your brand across different channels.
Tools like Supermetrics are great at connecting these sources. They allow you to analyze all your marketing data in one place and make it easier to spot trends.
2. Real-Time Reporting and Dashboards
Real-time reporting is a key feature to seek in a social media analytics tool. It allows you to quickly adjust your marketing strategies based on what’s happening right now.
For example, if a social media post isn’t performing well, you can tweak it immediately rather than waiting for end-of-day reports. In this way, you won’t be late to the trend!
There are tools like Databox and Tableau that provide live dashboards to show you up-to-the-minute data, so you can make quick, data-driven changes.
3. Data Visualization
Visual tools like charts, graphs, and heatmaps simplify complex data – making the analytics tool easy to use and useful for everyone on your team.
For instance, a sales team can use visual dashboards to compare monthly performance metrics at a glance, while a marketing team might use heatmaps to identify which areas of a webpage attract the most attention.
Some of the top marketing analytics tools for data visualization include Tableau, which offers customizable and interactive visualizations to meet your team’s specific needs.
4. Advanced Analytics
Advanced analytics refer to sub-features like:
- Predictive analytics
- Machine learning
- Statistical analysis
- Data mining
- Custom reporting
Tools offering these advanced features include Adobe Analytics and Google Analytics 4.
5. Ease of Use
Look for tools with intuitive navigation, straightforward setup processes, and actionable insights.
HubSpot and Google Analytics are excellent examples of this. They provide easy-to-understand dashboards, customizable reports, and guided workflows that help users quickly access and interpret their data — making them accessible for both beginners and experienced marketers alike.
6. Customer Support and Help Resources
Strong customer support and accessible learning resources are something you should prioritize.
Tools like HubSpot and Whatagraph are known for excellent customer service and comprehensive help centers to assist users effectively.
Part 2: Choosing by Specialization/Type
Selecting a specialized tool after determining core functionalities is important because it allows you to focus on the specific areas that matter most to your business.
Here are your options:
1. Social Media Analytics Tools
These tools focus on tracking and analyzing social media metrics like engagement, follower growth, and content performance. Some of the top social media analytics tools are Sprout Social and Hootsuite. They offer in-depth insights and help you optimize your social media strategies and maximize ROI.
2. Website Analytics Tools
Monitoring your website’s performance is essential for understanding visitor behavior and improving user experience. Tools like Google Analytics and Hotjar provide valuable data on traffic sources, user journeys, and conversion rates.
3. Dashboard Analytics Tools
Centralizing data from various sources into a single dashboard helps streamline reporting and decision-making. Solutions like Databox and Tableau enable you to visualize key metrics from multiple channels in one place.
4. SEO Analytics Tools
SEO tools are specialized in monitoring search engine rankings and optimizing your site’s visibility. Platforms like Semrush and Ahrefs track keyword performance, backlinks, and competitor strategies and help you improve your search engine presence.
5. PPC Analysis Tools
Pay-per-click campaigns require precise analysis to maximize return on ad spend. Tools like Google Ads and Supermetrics are designed to track PPC performance. They offer insights into cost-per-click, conversion rates, and overall campaign effectiveness.
Top 10 Marketing Analytics Tools for Marketers & Biz Owners
1. Databox – Best for Dashboard Analytics
Databox is a powerful marketing analytics platform designed to centralize data from multiple sources into shareable dashboards and automated reports. It’s particularly well-suited for businesses that need a comprehensive yet user-friendly solution for tracking key performance indicators (KPIs) and visualizing data in real time.
With Databox, teams can consolidate their data from various platforms into a single, unified view. It makes monitoring progress and making data-driven decisions easier.

Main Features:
Some standout features of Databox include:
- One-click integration with over 100 data sources including Google Analytics, HubSpot, and Facebook Ads.
- Customizable dashboards empower users to view data as per their specific needs, whether it’s for tracking KPIs or monitoring campaigns.
- Forecasting and anomaly detection — these enable businesses to anticipate trends and proactively address potential issues.
Ease of Use, Pricing, and Reviews:
One of Databox’s strongest points is its ease of use. It seems as if the platform was typically designed with non-technical users in mind.
Here are a couple of examples of this tool’s simple yet intuitive drag-and-drop interface:
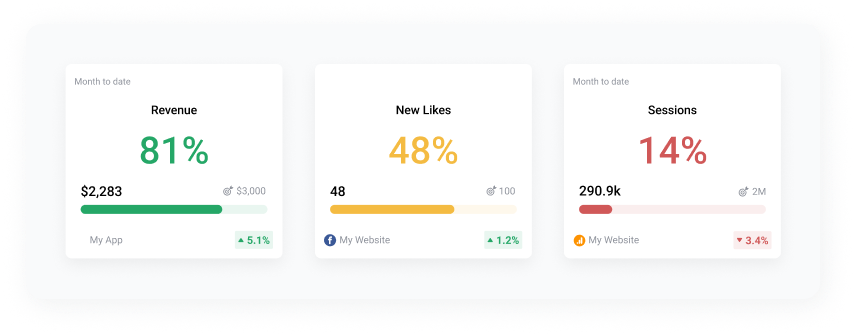
Metric Detail Page
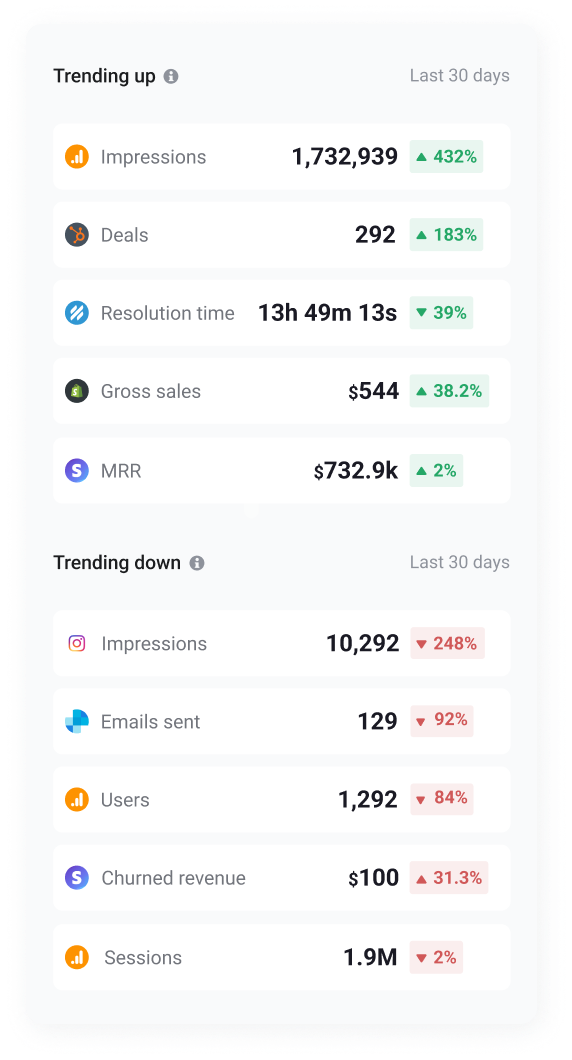
Performance Overview Page
With easy-to-navigate screens, setting up dashboards and acquiring reports are also a breeze.
In terms of pricing, Databox offers a free plan with basic features, including:
- Daily monitoring of key metrics
- Up to 3 data sources
- 5 GB storage
- All key integrations
- Up to 11 months of historical data
This is an attractive option for small businesses or teams just getting started with data analytics.
For those needing more advanced features (like Query Builder and SQL database integrations), there are paid plans starting at $49 per month. Reviews on platforms like G2 and Capterra reflect Databox’s strong reputation, with users rating it 4.7/5 and 4.6/5, respectively — and praising its user-friendly design and robust functionality.
Who Is It Best For and Example Scenario
Databox is best suited for small businesses and marketing agencies looking to centralize their data and enhance reporting processes.
For example, a marketing agency could use Databox to create real-time dashboards for their clients, integrating data from sources like Google Analytics, HubSpot, and Facebook Ads. This allows the agency to provide clear, up-to-date insights, helping clients make informed decisions without getting bogged down by data complexity.
2. Google Analytics 4 – Best for Website Analytics
Google Analytics 4 (GA4) is one of the most widely used web analytics platforms, offering comprehensive insights into website and app traffic, user behavior, and conversions. It tracks detailed user interactions across platforms and provides event-based data collection, allowing for a more nuanced understanding of user journeys.
You can monitor the impact of campaigns in real-time and create custom reports tailored to your specific needs.
Main Features:
Some key features of Google Analytics to consider are:
- It offers detailed metrics through event-based tracking, which allows businesses to understand user interactions, including demographic insights and behavioral patterns.
- You can track specific user actions, such as clicks, downloads, and scroll depth, and analyze custom conversion funnels to optimize the user journey.
- Advanced features use machine learning to predict user behavior, identify trends, and uncover insights automatically.
- Integrates smoothly with other Google tools like Google Ads and Looker Studio (formerly Google Data Studio) to provide a unified view of marketing efforts.
Ease of Use, Pricing, and Reviews:
GA4 is designed to be user-friendly, especially for those familiar with previous versions of Google Analytics. Beginners can get started by following the platform’s intuitive guidance or by watching tutorial videos.
However, setting up complex tracking and analysis requires more advanced skills. For that, you may need to hire a professional or complete Google Analytics courses.
The basic version of GA4 is free to use. For more advanced needs, including higher data limits and dedicated support, Google Analytics 360 is available for approximately €135,000 annually.
As for ratings, GA4 is well-rated – with a G2 score of 4.5/5 (over 6,100 reviews) and a Capterra score of 4.7/5 (over 7,500 reviews).
Who Is It Best For and Example Scenario:
GA4 is ideal for businesses of all sizes, from startups to large enterprises.
For instance, a small e-commerce business can use Google Analytics 4 to pinpoint which products are driving the most engagement and sales. This, in turn, enables them to optimize marketing campaigns and adjust inventory to better meet customer demand.
3. HubSpot – Best for Inbound Marketing Analytics
HubSpot is an all-in-one platform that you can use for:
- Email Marketing: Create and automate email campaigns. Personalize emails based on user behavior, and track their performance.
- Social Media Management (SMM): Schedule and manage posts across various social media platforms, monitor engagement, and analyze social media performance.
- Website Management: Track user behavior on your website, manage landing pages, and integrate your website data with other marketing efforts. But note that HubSpot does not offer full website-building capabilities.
Hubspot’s integrated marketing, sales, and service features make it easy for marketers to manage and optimize their entire inbound marketing strategy from a central location.

Main Features:
The main features of Hubspot are:
- Segment, personalize, and automate email campaigns with sophisticated workflows that target users based on behavior and engagement.
- Utilize lead scoring and automated follow-ups to nurture prospects and convert them into customers efficiently.
- HubSpot provides detailed attribution reporting to help you track the effectiveness of every touchpoint in the customer journey.
- Create custom dashboards that display key metrics and KPIs relevant to your business goals. You can track everything from website traffic to email open rates in one view.
Ease of Use, Pricing, and Reviews:
HubSpot is widely praised for its intuitive user interface — which makes it accessible for beginners while still offering advanced features that can become more complex as users dig deeper.
The platform provides free tools for basic use. Paid plans start at $800 per month for more robust capabilities.
HubSpot reviews reflect its strong performance & high user satisfaction. It’s got a rating of 4.4/5 on G2 and 4.5/5 on Capterra.
Who Is It Best For and Example Scenario:
HubSpot is ideal for B2B businesses looking to execute effective inbound marketing strategies and manage customer relationships seamlessly.
For example, a SaaS company can use HubSpot to track leads generated from specific landing pages, segment these leads based on their interactions, and automate personalized follow-up sequences.
4. Mixpanel – Best for Product Analytics
Mixpanel is a marketing analytics tool that’s best for product analytics. Businesses can track user behavior and engagement across websites and apps, including metrics like:
- Page click
- Page views
- Returning users
Mixpanel provides in-depth insights that help businesses enhance product usage and improve user retention by focusing on how users interact with their products. Its advanced segmentation capabilities enable businesses to create highly targeted marketing campaigns and personalized user experiences.

Main Features:
The key features offered by Mixpanel are:
- Precise monitoring of specific user actions and tracking of conversion paths to identify drop-off points and optimize the user journey.
- Allows experimenting with different variations of features or content and also allows segmenting users based on behavior for targeted marketing.
- Enables analyzing user retention over time and comparing different user groups to assess the impact of changes or new features.
- Provides up-to-the-minute insights and customizable reports to make data-driven decisions quickly.
Ease of Use, Pricing, and Reviews:
Mixpanel is user-friendly but has a moderate learning curve due to its advanced features. It offers comprehensive documentation and support for users to get acquainted with its functionalities.
There are three pricing plans offered by Mixpanel. These are as follows:
- Free plan (with basic features)
- Growth – starting at $28/month
- Enterprise – starting at a custom price.
In terms of reputation, Mixpanel has a super positive and strong reputation with G2 ratings at 4.5/5 (400+ reviews) and Capterra ratings at 4.5/5 (150+ reviews).
Who Is It Best For and Example Scenario:
Mixpanel is ideal for product teams and businesses looking to enhance user engagement and product usage. Its features are particularly beneficial for companies focused on optimizing their product experience through detailed user insights.
For example, a mobile app uses Mixpanel to track which features users interact with the most, conducts A/B testing on feature variations to enhance user retention, and leverages cohort analysis to understand long-term engagement patterns.
5. Tableau – Best for Big Data Analytics
Tableau is a top-tier data visualization tool known for its ability to transform raw, big data into dynamic and interactive dashboards. If you’re a data engineer or a marketer trying to convey a strong data store in the simplest way possible, then Tableau is for you!
Some of the best aspects, as highlighted by long-term users are as follows:
- You can learn and teach the tool in a couple of hours
- Drag-and-drop interface simplifies building visuals
- Connects with a range of data sources (excel, Google Sheets, and Big Query)
What’s more, you can perform SQL-like calculations instantly, reducing the load on your SQL server by avoiding too many conditions and subqueries.
Main Features:
Tableau’s most loved features are as follows:
- Offers a wide array of visualization options, including bar charts, scatter plots, heat maps, and geographic maps. You can customize these visualizations to meet your business’s specific needs.
- Integrates with numerous data sources, including SQL databases, cloud services like Google Analytics, and big data platforms like Hadoop.
- Utilizes artificial intelligence to provide users with insights they might not have uncovered on their own. It also supports predictive modeling to help anticipate future trends.
Ease of Use, Pricing, and Reviews:
As mentioned earlier, Tableau is easy to learn for beginners. But, like any other tool, mastering the more advanced features can be challenging and may require additional training or experience.
The platform’s pricing starts at $70 per user per month, with options for additional features and enterprise-level support. While this may be on the higher end for some businesses, the value provided by Tableau’s powerful analytics justifies the cost for many.
Here are the users’ ratings for Tableau on major platforms:
- 4.3/5 rating on G2 (based on over 1,800 reviews)
- 4.5/5 rating on Capterra (based on over 2,100 reviews)
Who Is It Best For and Example Scenario:
Tableau is ideal for enterprise businesses that need to visualize and analyze large datasets across various channels. It is particularly beneficial for organizations with an intensive data-driven culture that demands comprehensive insights from vast amounts of data.
For example, a retail chain like Target could use Tableau to track sales across different regions. By analyzing the data, they might find that winter clothing sells well in the Northeast but not in the Southwest. With these insights, Target could adjust its marketing and inventory, boosting sales and improving profitability.
6. Sprout Social – Best for Social Media Analytics
If you wish to grow your business primarily through Instagram, YouTube, LinkedIn, or other social media channels, Sprout Social is the tool you need to use.
It is an all-in-one social media management platform that excels in scheduling, publishing, and analyzing content across multiple social networks. It comes with features that:
- Boost engagement
- Track performance
- Explain audience behavior.
Sprout Social offers comprehensive insights into engagement metrics like likes, shares, and comments. This data helps businesses fine-tune their content strategies to better connect with their audience.
You can also use the platform’s social listening features to monitor brand sentiment and track relevant conversations in real time – and thus, actively manage your online reputation.
Main Features:
Some noteworthy features of Sprout Social are as follows:
- Easy scheduling & publishing. It allows you to maintain a consistent and committed social media presence by letting you schedule posts in advance and publish them across various platforms from a single interface.
- Real-time monitoring of conversations about your brand, tracking competitor activity, and gaining insights into audience sentiment to guide your strategy.
- CRM integration to deliver personalized communication and enhance customer relationships directly through your social media channels.
Ease of Use, Pricing, and Reviews:
On Sprout Social, it is easy for users to navigate and manage social media activities. However, some users note limitations in marketing automation capabilities.
As for pricing, the platform starts at $249 per month Those who have subscribed, usually leave positive feedback. There’s a 4.4/5 rating on both G2 (2,500+ reviews) and Capterra (500+ reviews).
Who Is It Best For and Example Scenario:
Sprout Social is ideal for marketing teams and agencies that prioritize improving social media engagement, tracking performance, and delivering comprehensive reports to clients or internal stakeholders.
For example, a digital marketing agency can use this social media analytics tool to manage multiple client accounts, schedule posts, monitor engagement metrics, and generate performance reports.
7. Whatagraph – Best for Multi-Channel Reporting
Whatagraph excels in aggregating data from over 40 different marketing platforms into a single, easy-to-understand report. It also simplifies the process with pre-built templates and a no-code interface, which makes it accessible to non-technical users.
If we compare the tool with HubSpot and Google Analytics, it seems to combine both their functionalities. With Whatagraph, you can enjoy a more focused solution for creating comprehensive, cross-channel reports without the need for extensive technical setup or integration.
All in all, it’s an excellent marketing analytics tool for agencies and small businesses.

Main Features:
The key features of Whatagraph are:
- Ready-made dashboard templates kickstart the reporting process, ensure consistency, and save time.
- It offers a holistic view of marketing performance with the ability to customize reports for specific needs.
- Combines data from multiple sources, including Google Sheets and BigQuery, to create comprehensive reports that reflect all aspects of your marketing efforts.
Ease of Use, Pricing, and Reviews:
Since Whatagraph offers a no-code interface, it is an extremely user-friendly marketing analytics tool. You can literally drag and drop data from multiple sources into pre-built templates. It’ll automatically generate complex, multi-channel reports without requiring you to write a single line of code or dealing with complicated integration.
There’s no free plan offered by Whatagraph. Their most basic plan begins at $249 per month, offering:
- Transfer data to BigQuery
- Pre-made data organization
- Live chat support
- Unlimited reports and dashboards
The features increase with pricing.
Like other marketing analytics tools in this list, Whatagraph has also received positive feedback — with a 4.5/5 rating on G2 (250+ reviews) and a 4.4/5 rating on Capterra (80+ reviews).
Who Is It Best For and Example Scenario:
Whatagraph is primarily for those who wish to generate efficient, visually appealing client reports. So, digital marketing agencies could make the best use of this tool.
They could integrate data from Google Analytics and social media channels —- and create comprehensive reports that highlight key metrics and insights in a visually engaging format — for their clients.
8. Semrush – Best for SEO Analytics
Semrush is one of the most comprehensive digital marketing tools out there. It offers a wide range of features that allow businesses to conduct an in-depth competitor analysis and grow their businesses online via content marketing.
What sets Semrush apart from tools like Whatagraph and Sprout Social is its deep focus on SEO analytics. It offers extensive keyword research capabilities, backlink auditing, and competitor website analysis — which are crucial for improving search engine rankings and online visibility.
Moreover, Semrush also integrates PPC campaign management and SEO writing assistants, which in turn, provides a more specialized approach compared to more general analytics platforms.
Main Features:
Semrush’s most loved features are:
- An advanced keyword research tool that provides in-depth metrics like keyword difficulty, search volume, and competitive density. It also includes a rank-tracking feature that monitors your website’s ranking for chosen keywords across different regions.
- Competitive analysis tools that allow you to dissect competitors’ strategies, including their top-performing keywords and backlink profiles. This helps refine your SEO tactics.
- Ad Builder tool allows you to create and test ad copies based on best practices and competitor data.
Ease of Use, Pricing, and Reviews:
Semrush is a tool that almost anyone can learn to use and even master — all on their own. This is because Semrush provides clear instructions every step of the way. When you hover your cursor over a specific feature, the tool displays text that explains what is the feature and how to use it.
Other than that, there are detailed guides available for each feature and functionality on Semrush’s blog space and social media channels.
But all of this ease comes at a good price too. Semrush offers three plans, and the most basic one begins at $139.95/month.
Here are Semrush’s ratings on notable platforms:
- G2: 4.5/5 (1,000+ reviews)
- Capterra: 4.6/5 (500+ reviews).
Who Is It Best For and Example Scenario:
Semrush is an ideal pick for content marketers and SEO professionals. It’s even a great pick for solopreneurs or small business owners who aim to boost organic search rankings and online visibility.
For example, a content marketing team can use Semrush to perform keyword research and competitor analysis to guide blog content creation.
9. Supermetrics – Best for Data Aggregation
Marketers and marketing teams are often using multiple data sources & data displaying tools at once. This makes data handling messy and confusing.
Supermetrics is a data aggregation tool that eliminates the ‘messy’ conditions. It’s capable of gathering data from over 100 data sources and sending it to ANY destination you’d like — it could be Google Sheets, Data Studio, or Excel.
It makes managing complex data sets much easier as marketers don’t have to manually transfer and organize. This also ensures extreme precision.

Main Features:
The best features offered by Supermetrics’ are:
- Collects data from multiple marketing platforms and automates data transfer to your preferred data storage or reporting tool. This feature is crucial for ensuring that all your marketing data is up-to-date and easily accessible.
- Offers pre-built templates specifically designed for Google Sheets and Data Studio. This saves time by enabling quick and efficient report generation. No need to start from scratch.
- Tracks and compares performance (across multiple channels) in one place. It gives a comprehensive view of how campaigns are performing across different platforms.
Ease of Use, Pricing, and Reviews:
The setup and interface of Supermetrics is rather simple. It’s easy for beginners. But advanced data manipulation may require some IT resources or technical expertise.
Supermetrics’ pricing is a bit complicated. You’ll be paying a different price for each data source. For example, if you wish to source data from Google/Looker studio, you’ll pay X dollars. And if you want to source data from Monday.com, you’ll be paying Y dollars. If you’re sourcing data from both of these places, then the billed amount would be X+Y dollars every month.
You can hop on a call with a Supermetrics rep to get a custom quote. Those who have already tried Supermetrics left a positive rating on Capterra (4.5 out of 5) and some users rated the tool 4.3 out of 5 on G2 reviews.
Who Is It Best For and Example Scenario:
Supermetrics is a good investment for medium-sized and large-scale businesses that need a reliable way to aggregate data. For example, a digital marketing team with 10+ long-term clients may need to use Supermetrics to automate data collection from different sources.
10. Adobe Analytics – Best for Enterprise Analytics
Adobe Analytics is a top-tier marketing analytics tool within the Adobe Experience Cloud — specifically engineered for large enterprises. It helps big businesses optimize their marketing strategies through in-depth analysis of customer journeys across digital platforms.
Main Features:
Adobe Analytics is particularly recognized for:
- Advanced data segmentation using machine learning models. This allows marketers to dig deep into customer data, uncover hidden patterns, and predict future trends with a high degree of accuracy.
- Real-time data tracking across various channels along with advanced cohort & flow analysis. This empowers marketers to conduct a detailed customer journey analysis. Ultimately, leading to higher conversions.
- Various attribution models. These allow businesses to accurately assess the impact of different marketing efforts and allocate resources more effectively.
Ease of Use, Pricing, and Reviews:
Unlike most other marketing analytics tools in this list, Adobe Analytics has a steep learning curve. Although it is highly customizable, it requires skilled analysts or marketing teams to utilize its full capabilities.
Owing to its advanced nature, the tool has a custom pricing model. The actual amount you pay depends on the data usage and the feature set required by the business.
Here are Adobe Analytics reviews:
- G2: 4.2/5 (700+ reviews)
- Capterra: 4.5/5 (300+ reviews).
Who Is It Best For and Example Scenario:
Adobe Analytics is best for large enterprises and organizations. For example, a global retail company that aims to monitor customers’ behavior across web and mobile channels – may be able to effectively use this tool. Such a company can use Adobe Analytics to find out the exact path taken by customers in their buying journey. This will help them figure out where do majority of drop-offs happen. And as a result, they can improve conversion rates & overall sales.
Conclusion
In today’s data-driven and highly competitive business landscape, the right marketing analytics tool can make or break your business. So, when choosing a tool, make sure you know the functionalities you require and it’d be excellent if you could narrow down your options by figuring out the exact type of marketing analytics tool you require.
Once you have both aspects figured out, pick the best marketing analytics tool to drive growth. The tools we’ve covered—Google Analytics, HubSpot, Mixpanel, Tableau, Sprout Social, Whatagraph, Semrush, Supermetrics, and Databox—each offer unique strengths tailored to different marketing needs.
We hope this guide made your decision-making process easier!


