


Table of contents
If you use Instagram in any professional capacity, you know its updates constantly give you something new to factor into your strategy. Whether it releases a brand new feature or an algorithm tweak, Instagram keeps you on your toes.
One way to keep steady as you deal with Instagram’s ever-changing landscape is to see how other businesses are doing. Sometimes, a dip in your metrics is just an industry trend, while other downward trends require action on your part.

Let’s explore the results for each metric:
Impressions
The median number of impressions across the industries we examined was 11.72K in August 2023.

Here’s what impressions looked like by sector:
| Industry | Impressions |
| Apparel & Footwear | MISSING |
| Automotive | 3.43K |
| Construction | 8.92K |
| Consulting & Professional Services | 4.16K |
| eCommerce & Marketplaces | 16.82K |
| Education | 12.6K |
| Food | 52.27K |
| Health Care | 40.28K |
| Health & Wellness | 59.16K |
| Information Technology & Services | 9.19K |
| Industrials & Manufacturing | 17.68K |
| Real Estate | 8.06K |
| SaaS | 4.29K |
| Technology | 10.67K |
| Travel & Leisure | 15.61K |
The Health & Wellness industry topped the list with a staggering 59.16K impressions. Its adjacent sector, Health Care, wasn’t too far behind at 40.28K impressions. Food also saw impressive performance, with a median of 52.27K impressions. Since these industries all play such a vital role in our lives, their content might be more engaging to an Instagram audience due to their nature. Among most of the sectors on our list, they could also have more opportunities to be visually engaging. While we didn’t get enough data to include the Apparel & Footwear industry on this list, it’d be interesting to see if it’d follow a similar trend.
Industries like Auto and Consulting & Professional Services lagged behind on the list at 3.43K and 4.16K impressions, respectively, possibly because of an inverse reason — it might just be harder to make appealing Instagram content about this subject matter.
EXPERT RECOMMENDATION: Start by evaluating all of your Instagram social media metrics. Instagram will show high-performing posts on a user’s main page more frequently than it will posts with lower performance. Check your overall performance as well as your post-by-post performance to see what content works best with your audience. Then, double down on the better-performing content types.
This metric monitoring works best when you make it a habit because you’ll catch a dip in performance as soon as possible, giving you an earlier chance to fix it. Our Social Media (Instagram Overview) dashboard displays your impressions and other important Instagram metrics in one place to make this practice easier.

Reach
Looking at all sectors, the companies we studied had a median reach of 7.21K for August 2023.

This is how the median reach played out by industry:
| Industry | Reach |
| Apparel & Footwear | MISSING |
| Automotive | 2.57K |
| Construction | 7.89K |
| Consulting & Professional Services | 2.69K |
| eCommerce & Marketplaces | 11.61K |
| Education | 8.12K |
| Food | 34.37K |
| Health Care | 14.62K |
| Health & Wellness | 31.62K |
| Information Technology & Services | 3.72K |
| Industrials & Manufacturing | 9.87K |
| Real Estate | 6.43K |
| SaaS | 2.83K |
| Technology | 4.07K |
| Travel & Leisure | 6.66K |
Reach numbers followed similar trends by industry to impression numbers, with food- and health-related industries thriving. Food took the lead at 34.37K impressions, with Health Care and Health & Wellness earning a median of 14.62K and 31.62K impressions. This performance may also relate to their default suitability for Instagram content.
EXPERT RECOMMENDATION: Impression and reach go hand-in-hand, so if you’re dealing with problems with one, you’re likely having trouble with the other. We already discussed how to evaluate your situation when your reach or impressions are low. Our additional expert recommendation for improving these numbers is to work on your Instagram captions. Front-loading the most important information and sharing personal stories are just two of the tactics we learned from our roundup of caption tips.
New Posts
The median number of new posts for businesses in all industries was 11 in August 2023.

Here’s the median number of new posts organized by sector:
| Industry | New Posts |
| Apparel & Footwear | MISSING |
| Automotive | MISSING |
| Construction | 9 |
| Consulting & Professional Services | 12 |
| eCommerce & Marketplaces | 12.5 |
| Education | 12 |
| Food | 11 |
| Health Care | 13 |
| Health & Wellness | 12.5 |
| Information Technology & Services | 11 |
| Industrials & Manufacturing | 12.5 |
| Real Estate | 13 |
| SaaS | 11 |
| Technology | 13 |
| Travel & Leisure | MISSING |
The number of new posts by industry is pretty consistent across the board. While the Construction sector had the lowest median at 9 posts, Health Care, Real Estate, and Technology had the highest at 13 posts. Both groups only deviated from the median of 11 posts for all industries by two posts.
EXPERT RECOMMENDATION: Is there a number to shoot for when planning your posts for the month? When we consulted the experts about their posting frequency, we discovered that businesses have varying strategies behind their schedules. But, many of them agreed on one thing: Focus on quality first and let that lead your cadence.
Another expert recommendation is to look at your performance by post and see which ones are delivering the most engagement. If you’re already posting a lot, but only some types of posts are driving your comments, likes, and new followers, maybe you could cut them entirely. Our Instagram Business (Post Performance) dashboard gives you the tools to try this tactic in one databoard.

New Followers
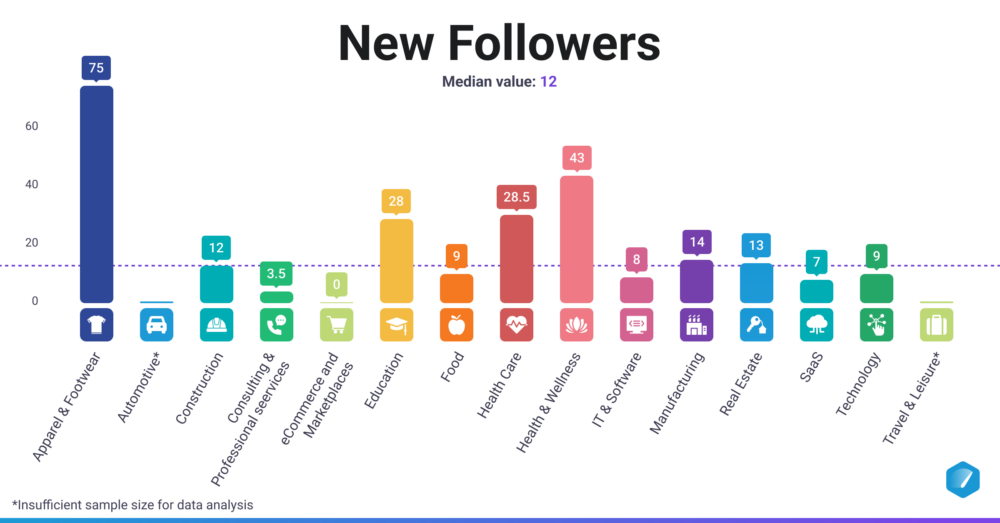
In August 2023, companies across sectors gained a median of 12 new followers.
Let’s look at follower growth by industry:
| Industry | New Followers |
| Apparel & Footwear | 75 |
| Automotive | MISSING |
| Construction | 12 |
| Consulting & Professional Services | 3.5 |
| eCommerce & Marketplaces | 0 |
| Education | 28 |
| Food | 9 |
| Health Care | 28.5 |
| Health & Wellness | 43 |
| Information Technology & Services | 8 |
| Industrials & Manufacturing | 14 |
| Real Estate | 13 |
| SaaS | 7 |
| Technology | 9 |
| Travel & Leisure | MISSING |
This is the first metric on this list with enough data to list the Footwear & Apparel industry, and it goes to show how much of a foothold it has on Instagram. This sector vastly outperformed the median of 12 new followers for all industries, with a median of 75 new followers.
There are multiple factors that could go into this sector’s success in gaining new followers. Fashion content has inherent visual appeal and quickly changing trends, plus it has the potential for influencer partnerships. Clothing and footwear brands also tend to invest heavily in their Instagram campaigns, hosting giveaways, contests, and interactive campaigns.
EXPERT RECOMMENDATION: When it comes to growing your Instagram followers, using more of Instagram’s features and following Instagram’s best practices is always a good first step. Our guide to the average number of Instagram followers includes more expert suggestions on the topic.
As you monitor your follower growth over the months, our Instagram Business (Audience Overview) dashboard can lend a hand. It breaks down your audience numbers and demographics so you know who’s engaging with your content.

Profile Visits
The companies in our industry-wide group had a median of 268 profile visits in August 2023.

Check out how each sector fared with profile visits that same month:
| Industry | Profile Visits |
| Apparel & Footwear | MISSING |
| Automotive | 65 |
| Construction | 212 |
| Consulting & Professional Services | 145 |
| eCommerce & Marketplaces | 311 |
| Education | 562.5 |
| Food | 806 |
| Health Care | 226.5 |
| Health & Wellness | 739 |
| Information Technology & Services | 261.5 |
| Industrials & Manufacturing | 344 |
| Real Estate | 206 |
| SaaS | 149.5 |
| Technology | 302 |
| Travel & Leisure | 441 |
Just as they did with impressions and reach, the Food and Health & Wellness industries far outperformed the median for all industries with 806 and 739 profile visits, respectively. This time, the Health Care sector stayed at a similar performance level as most other industries, with a profile visit median of 226.5.
The Auto and Consulting & Professional Services industries also fell behind other sectors in this metric, having a median of 65 and 145 visits each. The way these sectors’ subject matter lends itself to Instagram content could be causing these performance trends, as they could with the positive trends in the food and health sectors.
EXPERT RECOMMENDATION: One way to get more people to visit your profile is to follow the lead of some of the most engaging Instagram brands out there. They use tactics like high-quality visuals, authentic-feeling content, and community to get people to follow their profiles. We break down these top plays in our roundup of the best brands on Instagram.


