Table of contents
“With Databox, we can discover and act on performance insights quicker. One of our clients saw a 7x ROI from the work we were doing, which helped the conversation around reinvesting budget going into 2018. They just signed a new contract.” – Elise Karlsen Bye, Inbound Strategist at Inbound Norway
Inbound Norway was founded in 2017, but their founding team has years of experience working together in accelerating growth for clients. Their CEO, and the team of experienced strategists have worked to deliver successful inbound marketing campaigns for customers long before they joined together in their most recent venture.
So coming in, they knew exactly what needed to be done in terms of acquiring, servicing, and most importantly, retaining business. That’s why after only a couple months of operation, they signed on to become Databox Partners.
“We know our clients need to defend their marketing budgets. Marketing managers need to ask for new (or a higher) budget throughout the year. Having the ability to easily attribute performance and ROI is key in allowing our clients to justify that ask.”
Since founding Inbound Norway seven months ago, Databox has become an integral piece in helping them do just that, which helps them upsell and retain business.
How Traditional Reporting Methods Were Hurting Them
Like most agencies, Inbound Norway schedules monthly reporting meetings with their clients. Before Databox, preparing for these meetings meant waiting as late as possible to pull the data in order to present the most up-to-date view on performance.
But after strategists spend time pulling data from the various tools clients use, take all the relevant screenshots, and translate all of that into spreadsheets and slide decks, there wasn’t much time for a proper analysis or conversation around what could be improved and how.
How Inbound Norway Uses Databox to Improve Client Relationships
A better presentation leaves stronger impressions
“Impressions are important going into client meetings. Sometimes, we’re also meeting with other members of the organization beyond our point of contact. Especially during renewal meetings, the CEO is there, or the head of finance. Instead of presenting a bunch of disparate screenshots from different tools (with no consistency), the visuals of Databox allows us to have a much better first impression.
You can see it on the client’s face when we load Databox on the screen. Their boss is there, and now they’re comfortable with the data and the way we’re presenting it. It seems superficial, but every little detail is important.”
More time for strategy
“With Databox, we were able to discover an underserved area of one client’s funnel based on engagement scores logged in HubSpot. Previously, we had to create a bunch of different smart lists to see this same type of insight in HubSpot, but it wasn’t visualized in a simple way. This resulted in presenting all statistics in words – not visuals. With the funnel visualization in Databox, the client was able to easily see and understand where our focus and priority should be.
It led to a really great discussion with the client around things we could try in order to increase engagement in this area of the funnel.
The funnel visualization in Databox makes it easy for the client to understand and buy into specific areas of focus.”
How They’re Improving Acquisition and Sales Processes
After becoming certified partners of Databox, the first thing the team at Inbound Norway did was set up and use the product for themselves.
“It’s made our internal processes much more efficient. Every month we have an all-hands, general health check of all of our clients. Previously, we would need to pull all their client data from dozens of tools, pull screenshots from all of them, and sometimes even record their analysis in a notebook as talking points for the meeting.
Now all of that data is automatically pulled into Databox. We spend far less time preparing data, and much more time having productive discussions on strategies for improvement and what to do next.”
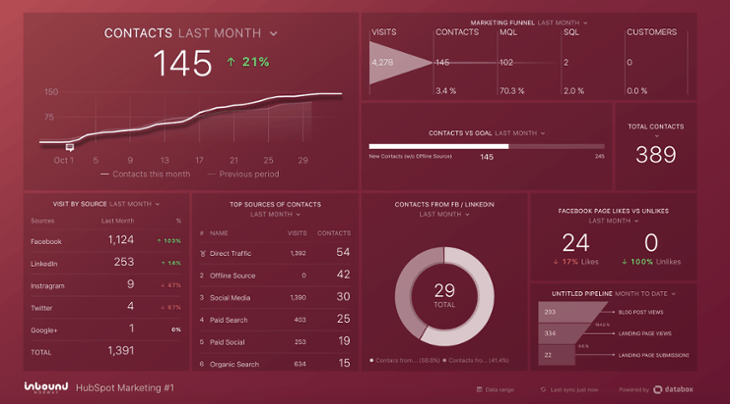
To stay on top of their own marketing funnel, and to identify areas that need more resources or attention, Inbound Norway has several Databoards set up, like the one pictured below, in order to continue growing demand and acquisition in addition to their client work.

“This dashboard is made solely based on data from HubSpot. On the top left, you can see the number of contacts as well as the percentage increase over the previous period. We have also created a funnel that illustrates our customers’ entire sales journey all the way from when they visit the site until they become leads, MQLs, SQLs, and finally, customers,” Karlsen wrote in a recent post.
“This gives us a good insight into where we need to add resources. For example, you can see that our conversion rate from visits to leads (contact) are above average. Also, we have a relatively high conversion rate from lead to MQL, but low conversion rate from MQL to SQL. This is where we’ll need to add more resources to achieve the goal: more customers.”
Sales and Marketing Alignment
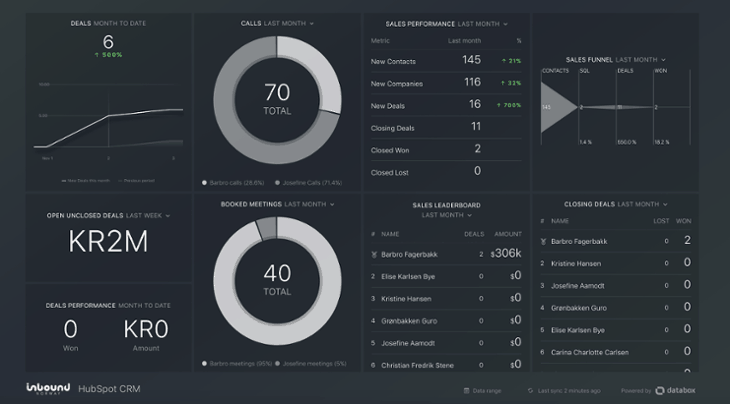
“A salesperson and a marketer are not necessarily measured on the same KPIs, so why should they have the same dashboard?” said Karlsen.

“We created a separate overview for our salespeople including the most important parameters for them: How many deals are in the pipeline? When do the salespeople meet their goals for the number of booked meetings? Do they get enough SQLs from the marketing team? How many deals do they win and how many do they have open?”
See why >1,000 agencies are already using Databox to improve reporting, client strategy, and overall retention and upsell
Becoming a Databox partner is free. Create your free agency account and start delivering better client reports in less time, and take advantage of our partnership program training, community and co-marketing benefits to acquire, retain, and grow client revenue.


