Table of contents
“All we need to do is improve this one marketing KPI that has been holding us back for months. After that, the sales will start flowing in!”
If you are a seasoned marketer, you have probably told yourself some version of this story at one point or another.
You can’t seem to meet your growth goals, so you search for direction in order to get back on track. You feel that if you identify the metrics that need improvement, you will refocus your efforts to get over that one barrier that has been stopping you.
“If we just get more traffic to the site, then…”
“If only we could lower the cost-per-click on our ads, then…”
“If we just produced more content, then…”
With your renewed focus, the sales will soon follow.
Although this sounds like a logical series of events, it can actually lead you to waste months or years of time and money. In order to understand the flaws in this plan, think back to the purpose of your marketing in the first place.
Here is the most important question that your marketing should answer:
“How will this product make me a better version of myself?”
OR
“How will this brand make me a better version of myself?”
If you prefer a visual version:
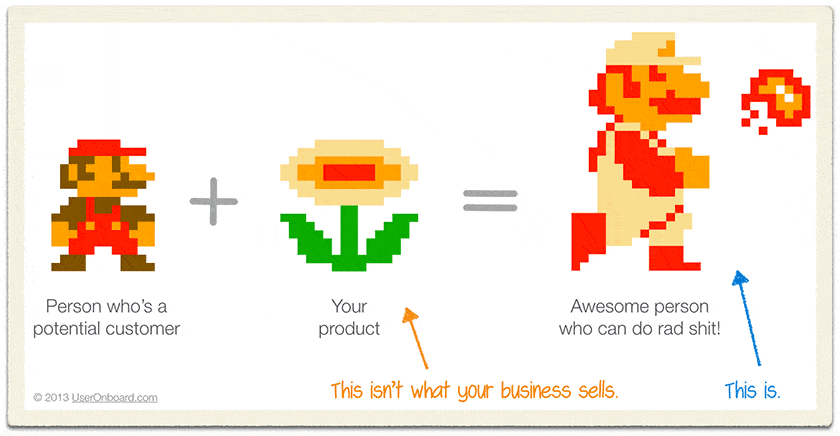
This is a totally different framework for evaluating your marketing success. It requires you to rethink why you are tracking your KPIs in the first place.
“If we generate more traffic to our site (or lower CPC, or produce more content), will we have proof that visitors believe our product will make them better versions of themselves?”
This is the question that will determine whether visitors later become customers. And if your metrics do not reflect it, you will find that marketing metric improvements do not actually increase sales.
In order to investigate this fundamental difference in marketing strategy, I interviewed Tom Shapiro, CEO of Stratabeat and author of the new book Rethink Your Marketing. Tom shared the strategies he used to help three clients refocus on the overlooked metrics that would lead to increased sales.
Case 1: The Desire for More Traffic
A pasta brand approached Tom with a request for an SEO proposal. Their overall goal was to introduce more potential customers to their brand, and they felt their best option was to increase organic traffic. They believed that more visits to the site equaled more brand impressions, which would mean more sales in supermarkets.
But when Tom reviewed their actual analytics, he began to see a different story materialize.
The Challenge: Since the brand equated site visits to brand exposure, they had neglected the actual quality of the site. According to Tom, “Nobody was going beyond a single page per visit. Nobody was watching more than one of the many videos on the site, and of those site visitors, nobody was finishing any of the videos. In other words, no one was enjoying the experience. The website wasn’t worth their time.”
In fact, more visits to the site may have meant more NEGATIVE brand experiences! First of all, if nobody actually engages with your brand, they probably will not remember it when they go to the supermarket. Or, if they do remember your brand, they may only recall the content they did not enjoy on the site.
Here is the analogy Tom offers:
“If you are looking at a road as a marketer and you see potholes, do you go in and fill the potholes? Because that means the customer will have a smoother road on their journey, right?
But what if that road is going off a cliff? Then filling the potholes is a complete waste of time.
In that case you would actually be causing damage to your brand by filling the potholes, because these prospective customers now have a bad brand experience. As a marketer, you need to think holistically about the customer’s objectives and corresponding experience, and if the road for the customer journey isn’t going in the right direction, you should build a new road that goes in a different direction instead.”
The Metrics: Obviously, an increase in the number of organic visitors was not going to move this company forward. Tom re-evaluated which metrics indicated a positive brand experience.
He chose to focus on behavioral metrics like pages per visit, time on page, pageviews, bounce rate, exit rate, and common navigational paths through the website.
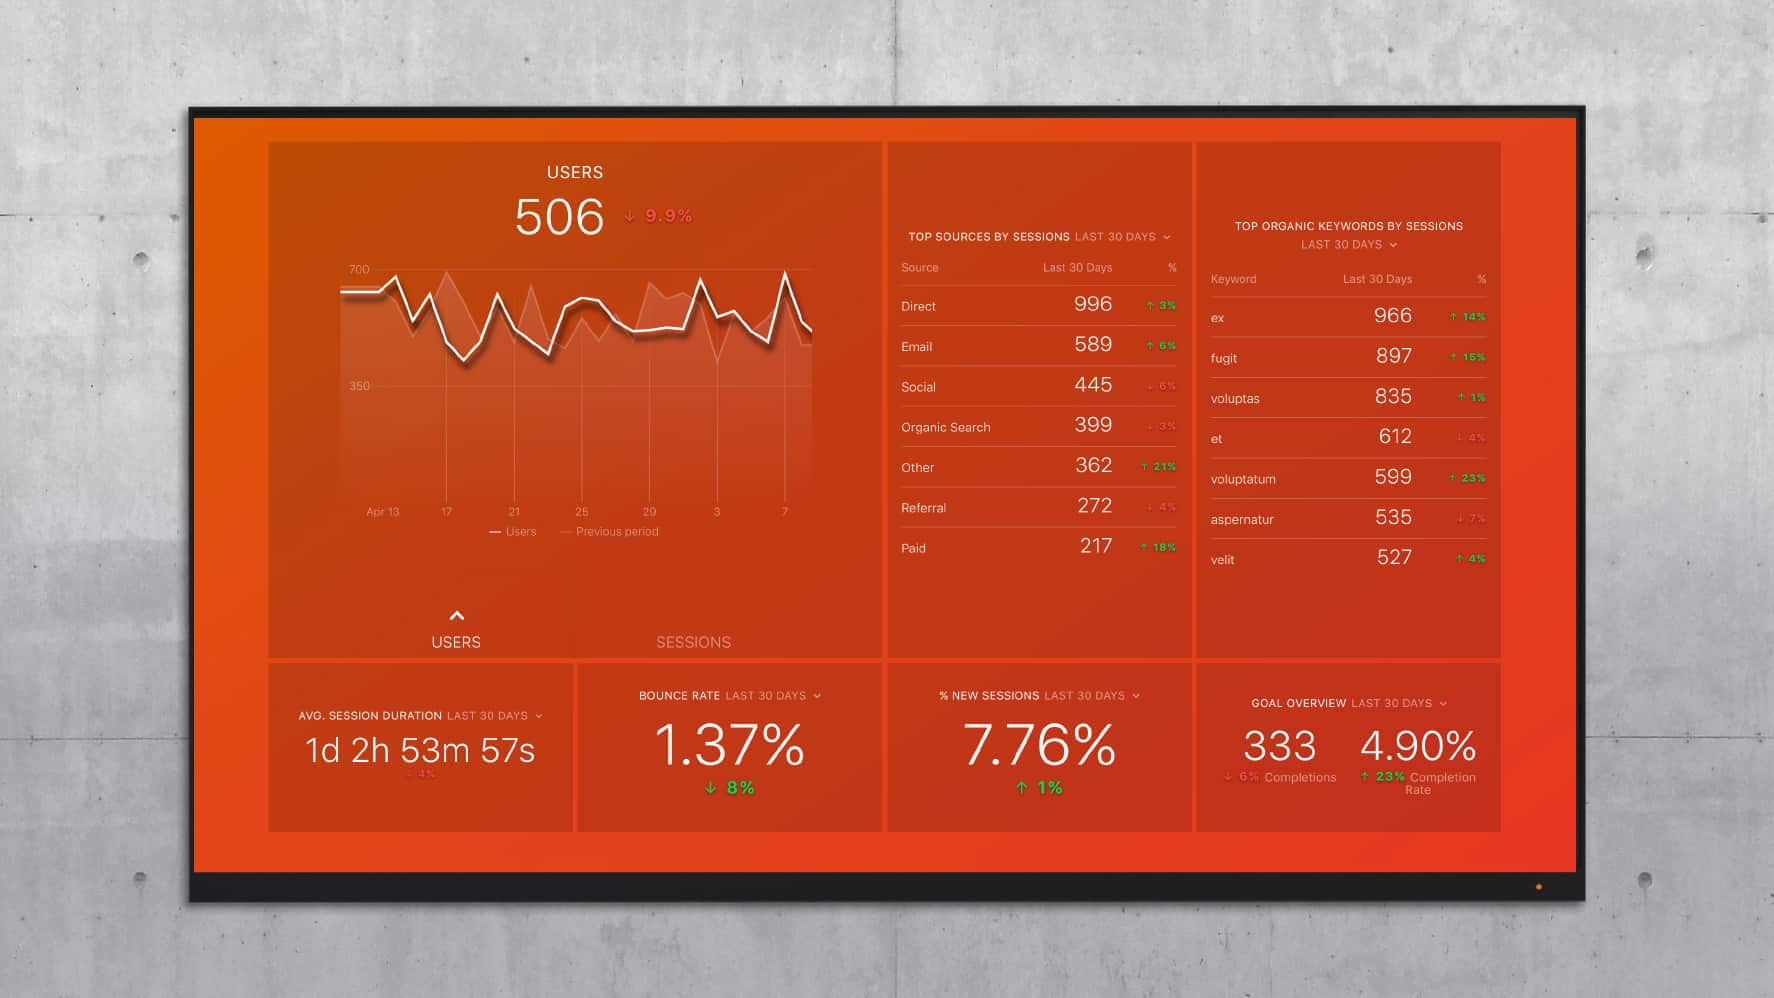
+ Get the Google Analytics Web Traffic dashboard here
For video metrics, he focused on number of impressions, number of plays, and average % of video watched.
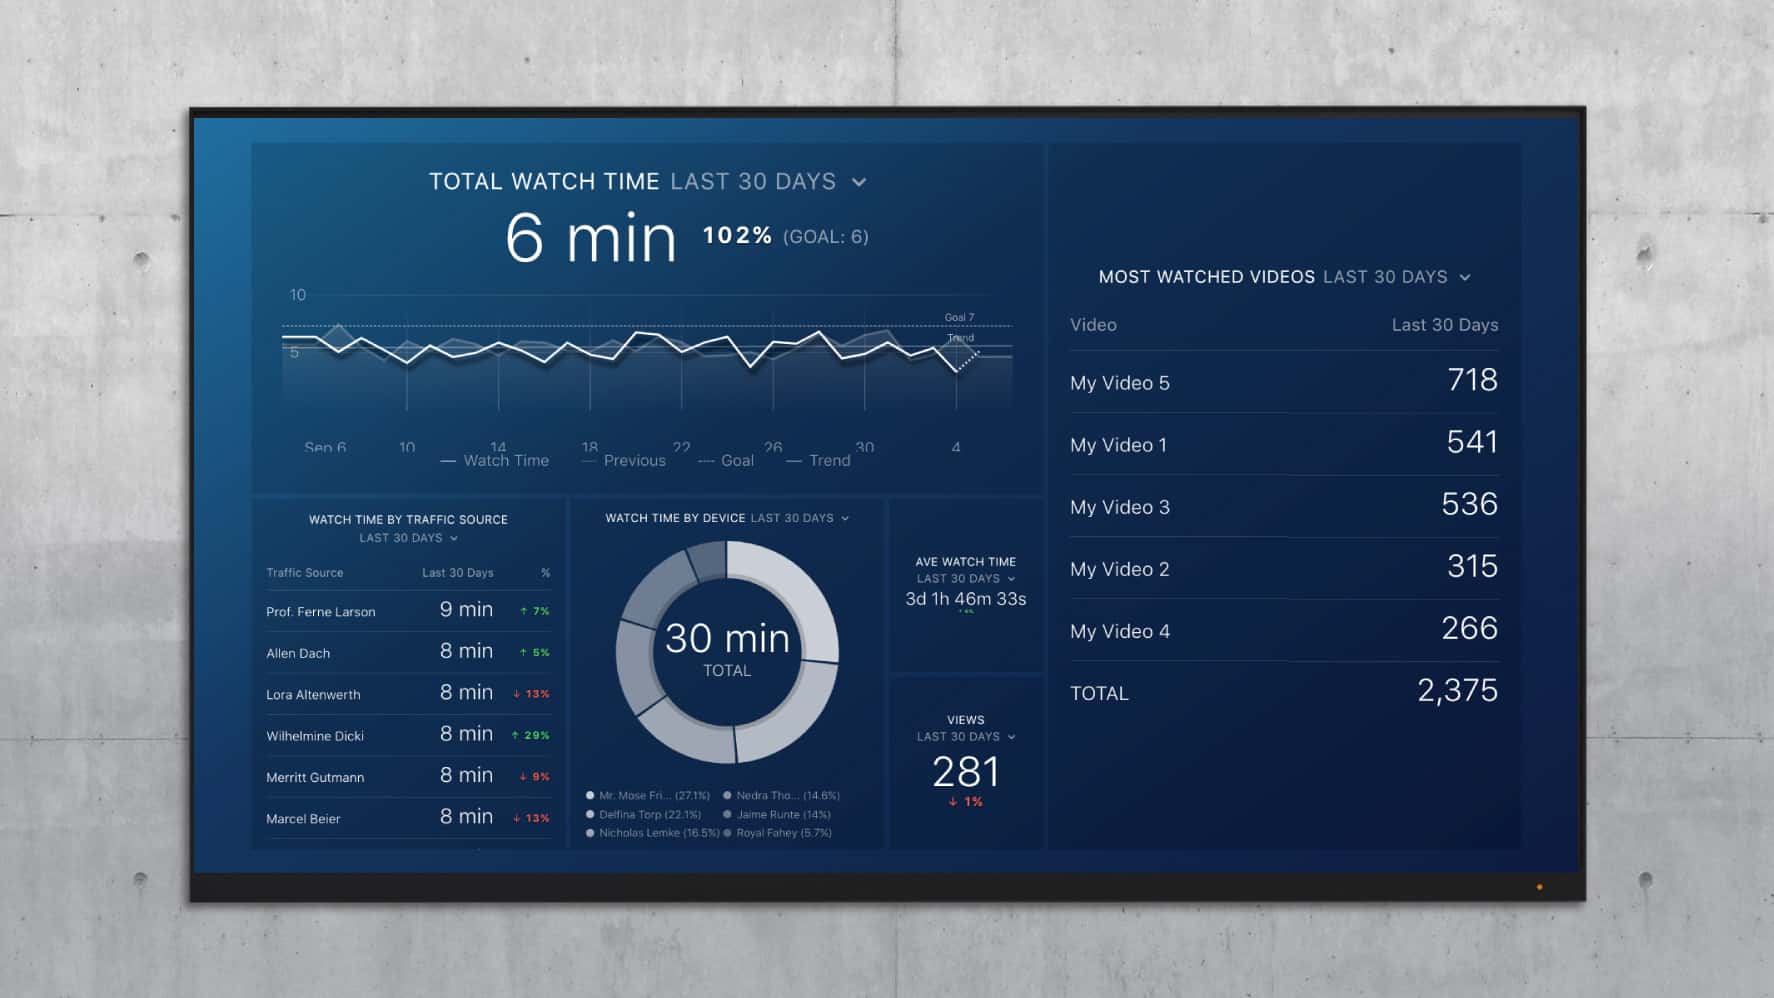
If you use YouTube, you can analyze watch time with this dashboard.
Based on those metrics, very few people were leaving the site with the impression that the product would make them better versions of themselves.
Tom and his team needed to “build a better road for the brand,” a strategy to create engaging content that would lead to brand love instead of disappointment. “If you deliver a fantastic brand experience- engaging, meaningful, emotionally powerful- that will translate to not only sales in the supermarket, but also repeat sales and brand advocates telling others about the brand.”
The Solution: Tom’s team did some market research to find a message that would connect with the customer’s ambitions. They found that the fragmentation of the family was a hot topic at the time. So, they wanted to position the brand as a way to bring the family back to the dinner table together. This would help the consumer instantly understand what they could achieve.
Tom’s team worked with the company’s PR agency to build an entire campaign around this theme, complete with influencers, a microsite, shareable content and new, emotional videos.
The engagement numbers immediately skyrocketed. Site visitors now had an enjoyable experience when they visited.
In this case, clicking multiple pages, spending more time on each page, sharing content, or watching a full video is a much better indicator that the brand is resonating with consumers. Only after improving the customer experience does increasing organic traffic become a more valuable activity, as with each new site visitor you’re now more assured that they will feel a positive, deeper connection with the brand.
Case 2: Joining Your Audience’s Conversation
Tom was approached by a high-end shampoo brand requesting an SEO proposal. Just like the pasta brand, this company felt that more site visitors meant more brand impressions, which would lead to more in-store sales.
The shampoo brand’s site had better engagement metrics than the pasta company. But, since this brand charged around 15-25 dollars per bottle, they had to put in extra effort to set themselves apart from the average shampoo, which mostly cost $5-6 per bottle. The brand, therefore, chose to emphasize their ingredients above all else. They made sure consumers knew that their quality of ingredients was higher than competitors.
The Challenge: Based on market research, Tom and his team believed that the brand was severely limited by their positioning. He stated it succinctly: “From a marketing perspective, you need to ask yourself: does the audience care first and foremost about the ingredients in their shampoo, or about something completely different?”
He felt that the evidence was probably already available. So, his team began scanning through all types of media in the beauty and fashion industries and looked at the topics that were discussed alongside shampoo or hair.
“We looked at beauty and fashion magazines, industry websites, blogs, search volumes, social media activity and even ads. We could not find one piece of content about shampoo ingredients.”
NOBODY was voluntarily talking about the actual ingredients! That revealed a mismatch between the brand’s message and the things that consumers wanted to discuss when it came to shampoo.
The Metrics: He and his colleagues noticed that consumers consistently talked about and consumed information about hairstyles. They found that there were over 20 million annual searches for different hairstyle terms, and over 1 million per year for specific popular hairstyles.
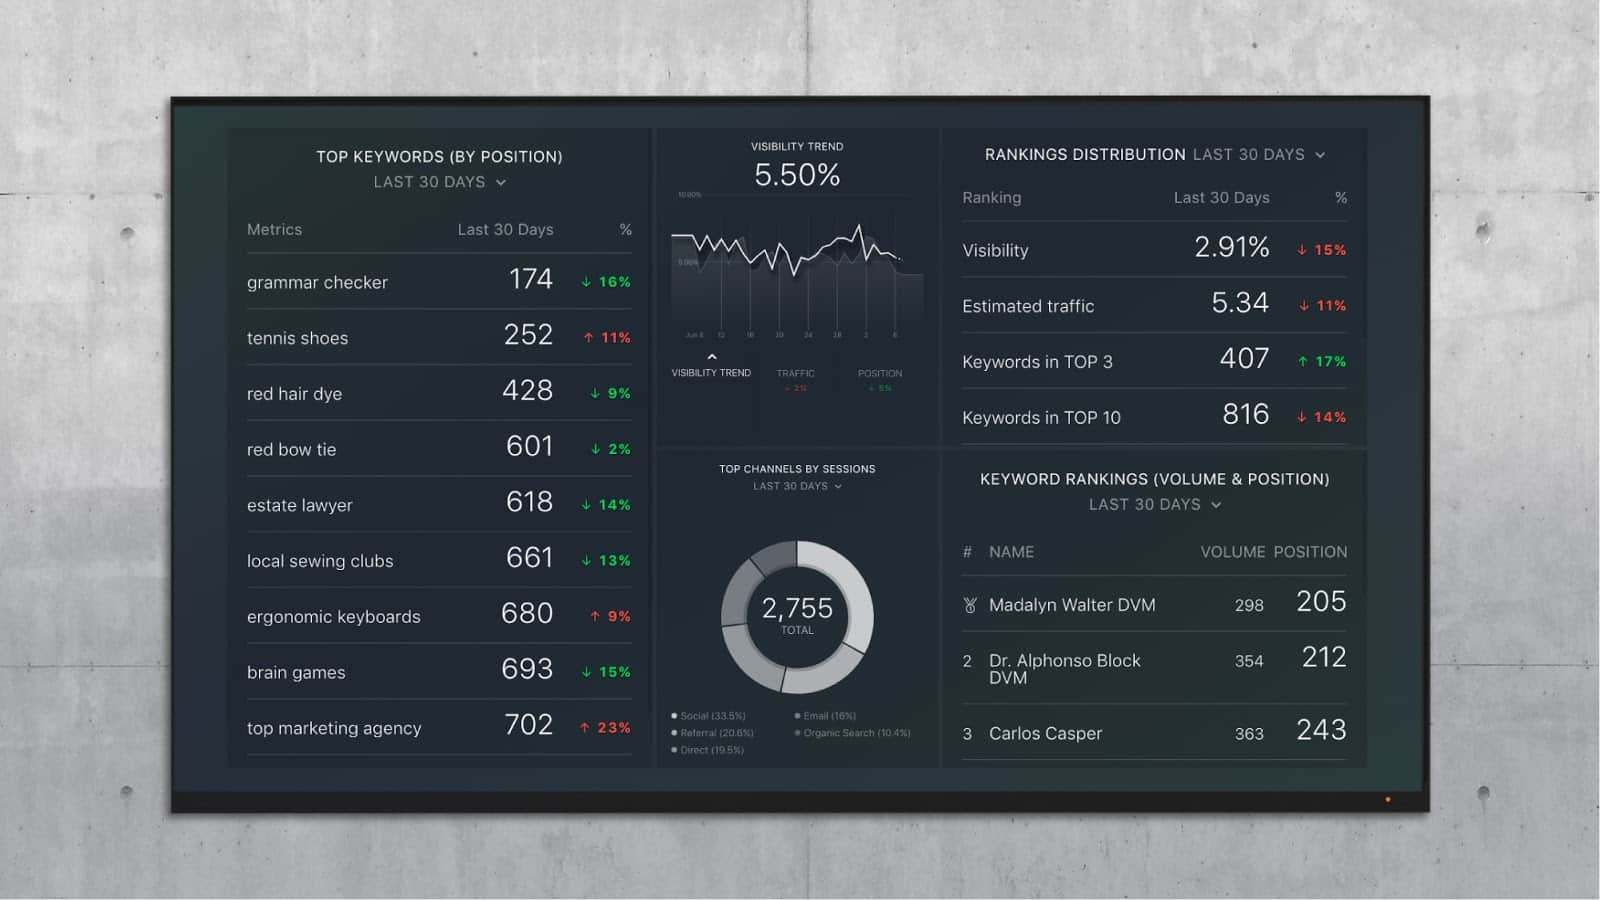
If you use SEMrush, you can track popular search terms with this dashboard.
Content around hairstyles was also shared more frequently. Representative of the delta in consumers’ interest levels, the top piece of content related to hairstyles over the past 12 months was shared over 400,000 times! The top piece of content around the shampoo ingredient methylparaben was shared a grand total of 2 times.
In other words, although Tom’s team was confident that with the company’s existing positioning and website they could offer an incremental bump in organic search metrics, this would be ignoring the greater opportunity for growth. The brand was missing out on the major conversations that customers were already having. And, unsurprisingly, hairstyles connected to a direct improvement that customers could feel in their lives. A better-looking hairstyle can make you look more beautiful or independent, for example. A discussion about ingredients forced the customer to determine the benefit.
The Solution: Tom and his colleagues presented all this data to the client. They recommended that the brand focus entirely on hairstyles.
“We showed them the search numbers and the share numbers. We totaled up the number of bloggers, shares, magazine mentions, ads and search queries that mentioned hairstyles, and directly compared that to the mentions of ingredients. This showed the massive difference.”
This is another example of “building a better road”. There was already evidence that consumers LOVED to spend time on content around hairstyles.
The brand launched a series of sites and video campaigns around hairstyles, and even changed their TV and print advertising to focus on hairstyles. They created videos to teach consumers how to create these hairstyles. They partnered with bloggers and influential hairstylists to spread the message. The result? The company 10x-ed their metrics across the board.
Case 3: Measuring What Truly Drives Conversions
A SaaS company approached Tom with the goal of booking more demos from pay-per-click ads. In order to drive more demos at a lower cost, the company focused on a seemingly endless array of metrics.
Tom immediately saw that they could spend a lot of time and money trying to optimize each individual metric, but that this would be inefficient and insufficient. “You should not look at all metrics as equally weighted and equally deserving of your focus. You need to prioritize the most important metrics that will move the needle in your marketing dashboard.”
The Challenge: Tom saw that their landing pages converted at a relatively low rate. The reason was obvious:
“We talked to them about marketing that drives people to action vs. marketing that is simply explanatory in nature. At the time, their landing pages were explanatory in nature. Here are our features, submit this form, get a demo, etc. This was not compelling visitors to take action.”
If a curious searcher clicks your PPC ad, that shows a small amount of interest. If you write compelling ad copy, you have purchased a few more seconds of their attention as they browse your landing page.
On the other hand, they must be much more interested if they are willing to book a 30-minute meeting from a landing page. The client’s landing pages were underperforming, and there was no getting around this. Tom saw that further optimization of keywords, ads, and bids alone would not fix the main problem of bad landing pages.
The Metrics: The campaign needed to increase the number of site visitors that filled out the form on the landing page. To improve the ads themselves, Tom’s team tested up to 5 variants of each ad at the same time. They focused on click-rate, conversions, and cost-per-conversion. The team did not worry about metrics such as impressions and cost-per-click, as long as the conversion and cost-per-conversion numbers were superior.

+ Analyze your Google Adwords conversions with this dashboard
A/B testing of landing pages was instituted for each ad group to determine the copy, design, layout, on-the-page elements, and product positioning that led to the highest number of form submissions at the target cost-per-conversion.
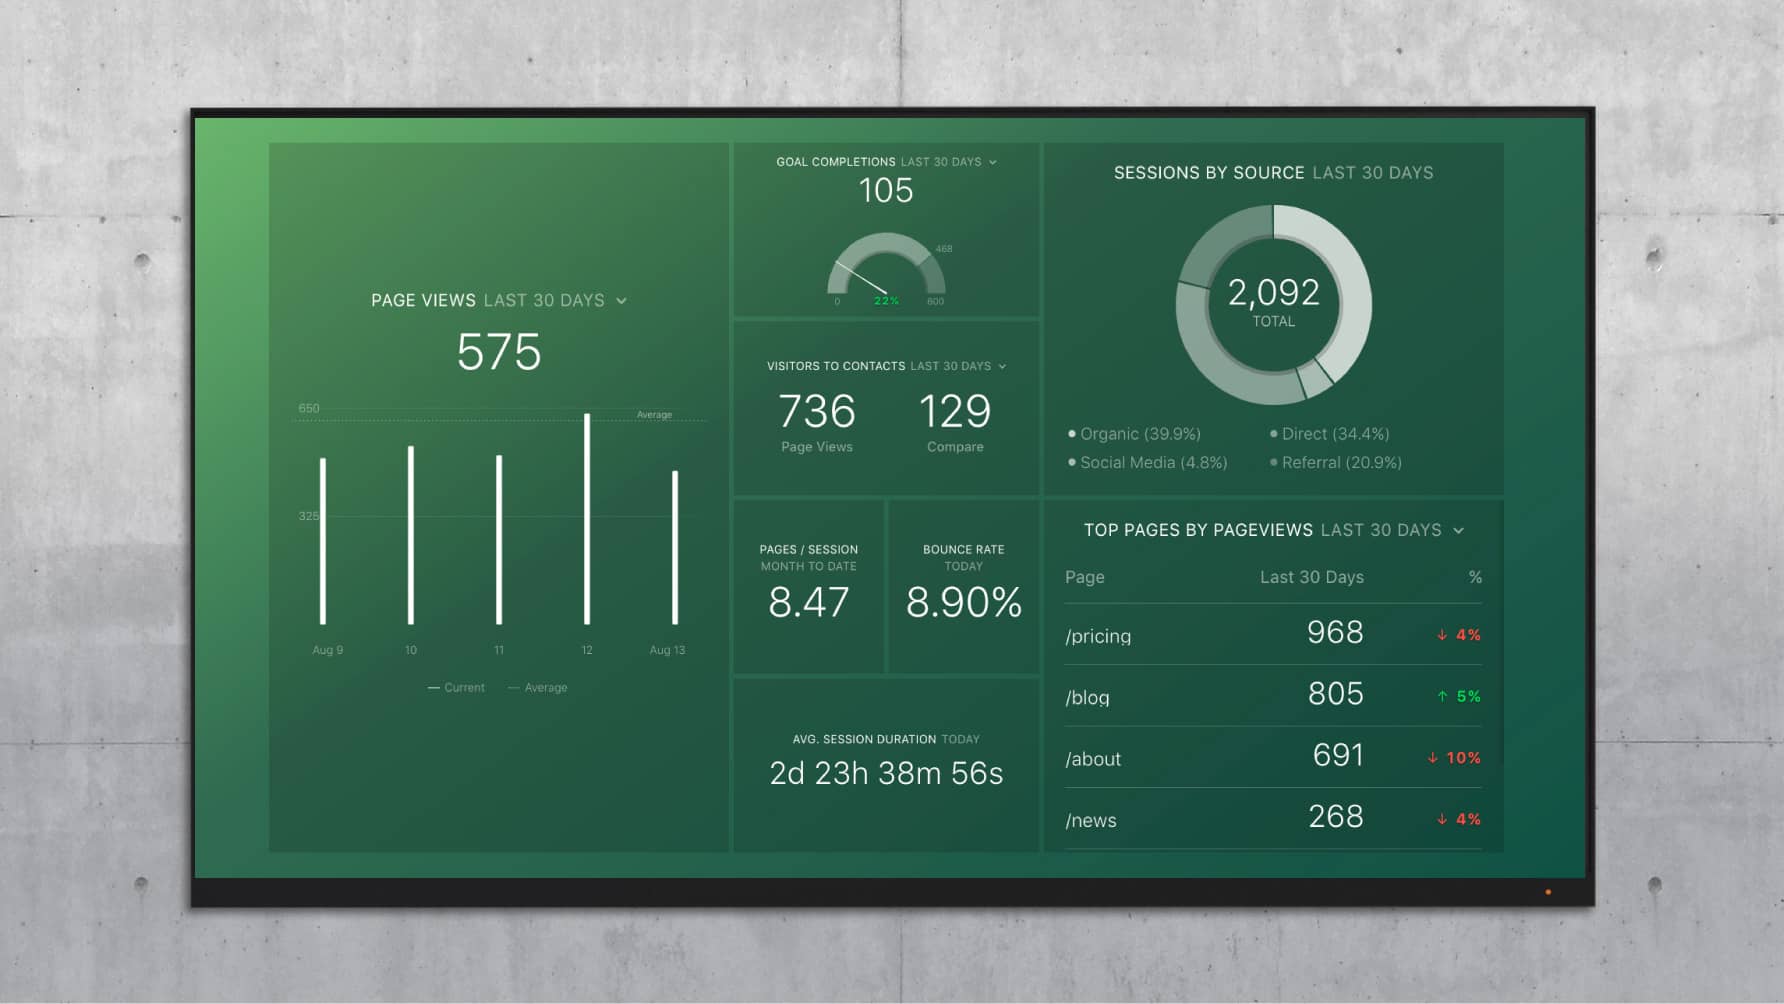
+ Track conversions from landing pages via Google Analytics
The form submission rate and cost-per-conversion were the main KPIs. That is the test of whether visitors are willing to invest their time to learn more about the service’s value after reading the landing page.
The Solution: Tom’s team ran A/B tests continually on the landing pages. The client did not REALLY want better ad metrics- they wanted more demos at a reasonable price! So the team continually tested different landing pages (non-stop, in fact), in order to improve the campaign’s conversion metrics on an ongoing basis.
After the team had determined successful positioning from early split tests, they began to test other items on the page. They tested different designs, as well as featuring an image versus a video, text in paragraphs versus bullet points, and the wording and fields on the form itself. They started a new series of tests every couple weeks or as soon as the sample size was robust enough otherwise for reliable decisions to be made.
In the end, the SaaS company increased their conversion rate by 140%.
Why Are You Measuring in the First Place?
Some marketers like to use the “ABC” framework to evaluate their digital marketing. A stands for Acquisition, B stands for Behavior, and C stands for Conversion. Each category includes different metrics from your site.
Usually, you can reveal your visitor’s belief in your product by reviewing metrics in the ‘B’ and ‘C’ categories. But even this can be misleading. You can still achieve incremental improvements in the B and C categories without connecting to the ambitions of your customers.
So, start searching for evidence that your marketing speaks to the outcome that your customers want to achieve. Because if you ignore this step, you may be creating a false sense of accomplishment that will not translate to revenue. Remember, don’t just fill the potholes in the road. Survey the landscape, and when you see a major opportunity, forget about the potholes and build a better road instead.
And if you need to develop a metric strategy, you have come to right place! Databox helps you track data from over 50+ digital services, including Google Analytics, Google Adwords, SEMrush and HubSpot. You can quickly tell when marketing improvement does not lead to more sales without logging into multiple systems using our marketing dashboard software.
And, if you would like to learn more about these stories, check out Tom’s new book Rethink Your Marketing.


