


![Facebook Ads Benchmarks for Your Industry [Original Data]](https://cdnwebsite.databox.com/wp-content/uploads/2023/04/19101447/facebook-ads-industry-benchmarks-featured.png "Facebook Ads Benchmarks for Your Industry [Original Data]")
Table of contents
In the ever-changing landscape of digital marketing, staying updated on Facebook ads industry benchmarks is crucial for businesses looking to gain a competitive edge. Facebook advertising continues to be a top choice for marketers, but understanding the performance metrics across different industries can help you optimize your ad campaigns and maximize your return on investment.
Databox is introducing a new series of infographics on our blog, aimed at sharing key insights and benchmarks for Facebook Ads performance across 15 selected industries. By providing up-to-date benchmark data, we hope to help companies better understand their own performance and make data-driven decisions.
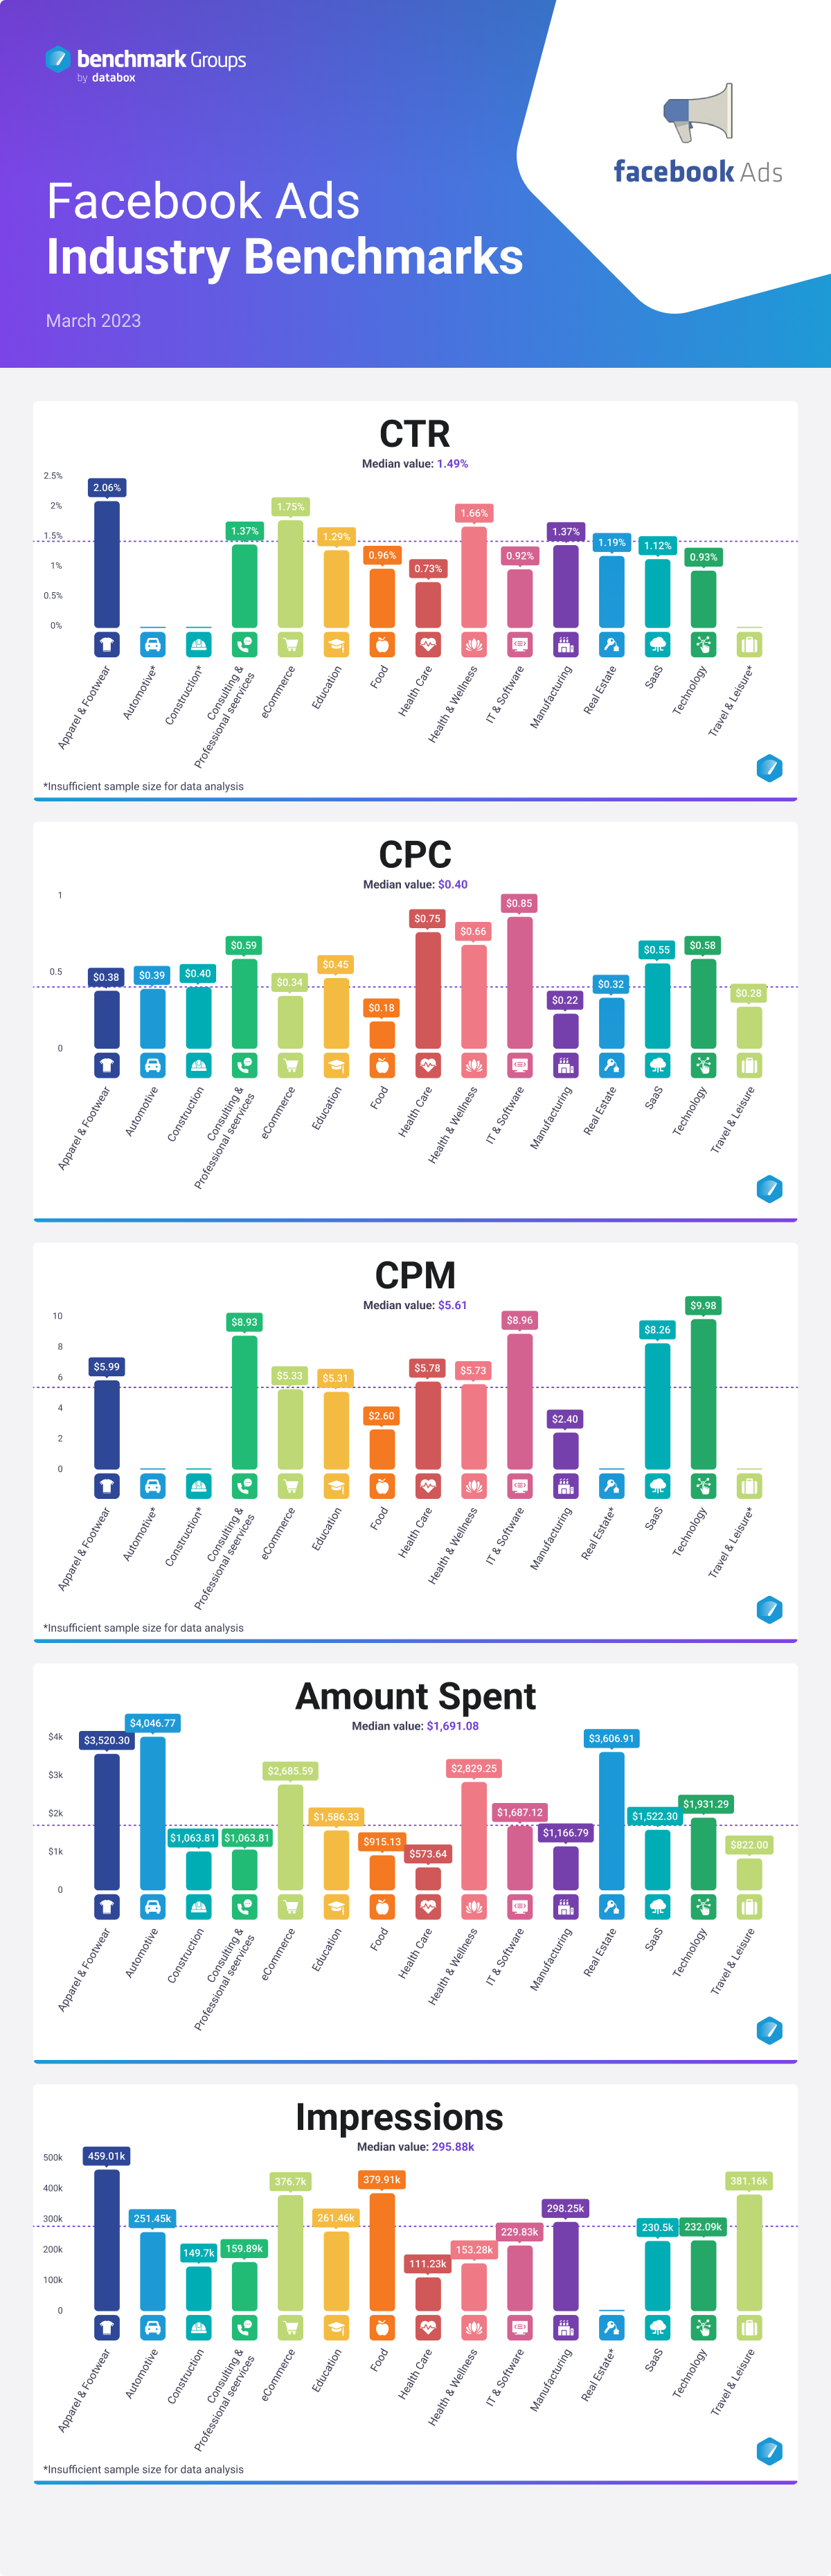
We’ll focus on five crucial Facebook Ads metrics: CTR, CPC, CPM, Amount Spent, and Impressions.
Ready to unlock the secrets of Facebook ads industry benchmarks? Let’s get started!
If you are interested to dig into the data further, read our write-up below.
CTR
Across all industries, the median CTR in March 2023 was 1.49%.

Let’s take a closer look at Facebook ad click-through rate benchmarks across different industries:
| Industry | CTR |
| Apparel & Footwear | 2.06% |
| Automotive | |
| Construction | |
| Consulting & Professional Services | 1.37% |
| eCommerce | 1.75% |
| Education | 1.29% |
| Food | 0.96% |
| Health Care | 0.73% |
| Health & Wellness | 1.66% |
| IT & Software | 0.92% |
| Manufacturing | 1.37% |
| Real Estate | 1.19% |
| SaaS | 1.12% |
| Technology | 0.93% |
| Travel & Leisure |
The Apparel & Footwear industry has the highest CTR at 1.75%, reflecting the industry’s ability to create captivating ads that resonate with users. The Technology and Health Care industries have the lowest at 0.73%, suggesting that advertisers in these sectors may need to rethink their ad strategies to better capture user interest. The similarities between Consulting & Professional Services, Education, and Manufacturing CTRs may imply similar audience behaviors or ad approaches across these industries.
PRO TIP: To improve your CTR, focus on creating highly relevant and engaging ad content. Use attention-grabbing headlines, persuasive ad copy, and eye-catching visuals that resonate with your target audience. Additionally, make sure to test different ad variations and audience segments to identify what works best for your campaign. Learn more about CTR-boosting strategies in our guide on improving Facebook CTR.
CPC
The median CPC across all industries in March 2023 was $0.40.

Let’s take a closer look at the median Facebook Ads CPC across various industries:
| Industry | CPC |
| Apparel & Footwear | $0.38 |
| Automotive | $0.39 |
| Construction | $0.40 |
| Consulting & Professional Services | $0.59 |
| eCommerce | $0.34 |
| Education | $0.45 |
| Food | $0.18 |
| Health Care | $0.75 |
| Health & Wellness | $0.66 |
| IT & Software | $0.85 |
| Manufacturing | $0.22 |
| Real Estate | $0.32 |
| SaaS | $0.55 |
| Technology | $0.58 |
| Travel & Leisure | $0.28 |
With Food having the lowest CPC at $0.14, it may be more cost-effective for businesses in this industry to drive clicks. IT & Software has the highest CPC at $0.85, suggesting that competition could be more intense, or ad targeting might need refinement. Health Care, Health & Wellness, Technology, SaaS and Consulting & Professional Services also have relatively high CPCs.
PRO TIP: To lower your CPC, optimize your ad targeting by narrowing your audience to those who are more likely to be interested in your product or service. Meta Pixel can be incredibly helpful here. Additionally, improve your ad quality and relevance by testing different ad creatives, headlines, and calls to action. Learn how to optimize CPC in our guide on CPC for Facebook Ads.
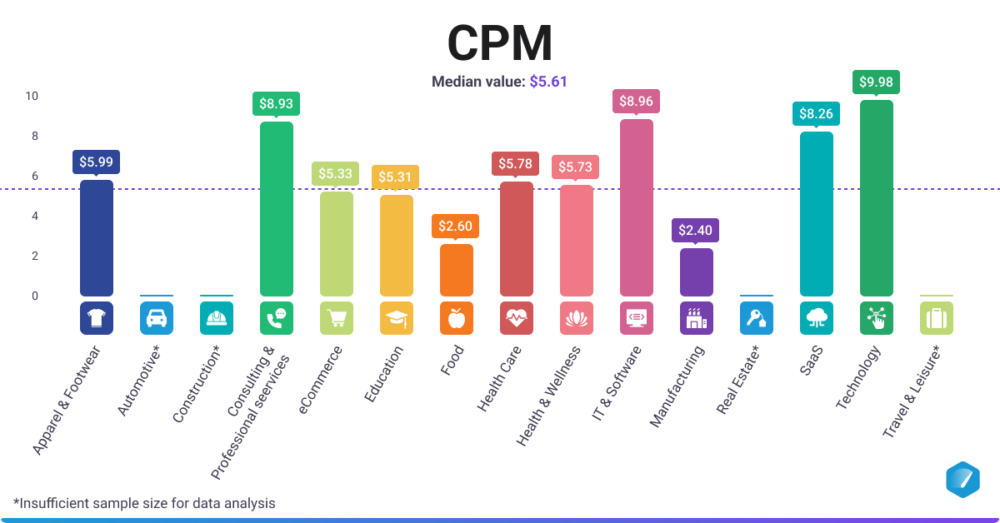
CPM
The median CPM across all industries in March 2023 was $5.61.
Let’s take a closer look:
| Industry | CPM |
| Apparel & Footwear | $5.99 |
| Automotive | |
| Construction | |
| Consulting & Professional Services | $8.93 |
| eCommerce | $5.33 |
| Education | $5.31 |
| Food | $2.60 |
| Health Care | $5.78 |
| Health & Wellness | $5.73 |
| IT& Software | $8.96 |
| Manufacturing | $2.40 |
| Real Estate | |
| SaaS | $8.26 |
| Technology | $9.89 |
| Travel & Leisure |
Manufacturing has the lowest CPM at $2.40. On the other hand, Technology has the highest CPM at $9.89, potentially indicating a more competitive advertising landscape or higher costs for reaching their target audience. The CPMs for IT & Software, Consulting & Professional Services, and SaaS are also significantly higher than the median value.
PRO TIP: To reduce your CPM, monitor your ad spending and optimize your bidding strategy. Keep an eye on ad frequency to prevent ad fatigue and avoid overwhelming your audience. Experiment with targeting different audiences, including core, custom, and lookalike audiences. Enhance your relevance score by focusing on retargeting, utilizing attention-grabbing creatives, and incorporating social proof in your ads. Learn more about lowering CPM in our guide on reducing Facebook Ad CPM.
Amount Spent
The median amount spent across all industries in March 2023 was $1,691.08.

Let’s take a closer look at median Amount Spent on Facebook Ads across different industries:
| Industry | Amount Spent |
| Apparel & Footwear | $3,520.30 |
| Automotive | $4,046.77 |
| Construction | $1,063.81 |
| Consulting & Professional Services | $1,008.66 |
| eCommerce | $2,685.59 |
| Education | $1,587.33 |
| Food | $915.13 |
| Health Care | $573.64 |
| Health & Wellness | $2,829.25 |
| IT & Software | $1,687.12 |
| Manufacturing | $1,166.79 |
| Real Estate | $3,606.91 |
| SaaS | $1,522.30 |
| Technology | $1,931.29 |
| Travel & Leisure | $822.00 |
Automotive has the highest amount spent on Facebook Ads with a median value of $4,046.77, suggesting that companies in this industry may invest more in their ad campaigns for better results. Health Care has the lowest amount spent, possibly due to Meta’s strict advertising policies related to health. Food and Travel & Leisure industries also have relatively lower amounts spent, which could stem from smaller budgets.
PRO TIP: To make the most of your advertising budget, it’s important to optimize your ad campaigns for performance. This includes refining your targeting, testing different ad creatives and formats, and adjusting your bidding strategy based on the performance of your ads. By optimizing your campaigns, you can improve your overall ROI. Delve deeper into managing Facebook ad costs in our guide on the cost of Facebook ads.
Impressions
The median number of impressions across all industries in March 2023 was 295.88K.

Let’s take a closer look at Facebook Ads Impression benchmarks across different industries:
| Industry | Impressions |
| Apparel & Footwear | 459.01K |
| Automotive | 251.45K |
| Construction | 149.7K |
| Consulting & Professional Services | 159.89K |
| eCommerce | 376.7K |
| Education | 261.461K |
| Food | 379.91K |
| Health Care | 111.23K |
| Health & Wellness | 153.28K |
| IT & Software | 229.83K |
| Manufacturing | 298.25K |
| Real Estate | |
| SaaS | 230.5K |
| Technology | 232.09K |
| Travel & Leisure | 381.16K |
Apparel & Footwear leads with the highest median number of impressions at 459.01K, indicating that their ads have a broader reach or higher ad spend. Health Care has the lowest number of impressions, which could be a result of lower ad spend or less effective ad targeting. Industries like eCommerce, Food, and Travel & Leisure have a relatively similar number of impressions, possibly due to similar ad strategies, budgets, or audience reach.
PRO TIP: To increase your ad impressions, focus on improving your ad’s relevance score through persuasive and engaging ad copy. A higher relevance score leads to more impressions at a lower cost. Additionally, utilize lookalike audiences to expand your reach while maintaining relevance Discover more about enhancing impressions and reach our comprehensive guide on Facebook ad impressions.


