


Table of contents
Stop logging into multiple systems and browsing through loads of reports to figure out how your business is doing.
Most applications make it impossible to discover insights. Even business intelligence (BI) solutions overwhelm users with too many graphs and charts, and not enough explanation. At the same time, most organizations are overwhelmed by the volume of data they need to monitor and report. With the average small business using 12+ software programs just for their marketing activities and the average enterprise using 91, it’s almost impossible to pay attention to all of your important data all at once, until now.
Thanks to feedback from our customers and after months of development, we are excited to officially launch Databox Insights.
Among other things, Insights pushes updates to you when:
- you achieve goals you’ve set,
- your performance changes drastically during a time period,
- other team members annotate your data,
- we identify new ways to analyze your data,
- we determine ways to improve in areas where you’re underperforming,
- and when there are new sources of data you can explore.
Helping companies track and improve the “metrics that matter” has always been our mantra. With Insights, we’ve made it even easier to do.
Instead of monitoring dashboards periodically, now you can address issues and capitalize on opportunities in real-time. And since Insights focuses on the most relevant data to you, Databox can deliver the updates to you that will have the most impact.
“Most Business Intelligence tools are dashboard-first, but what businesses are really after are insights first. It’s really backwards if you think about it.”
 Kathleen Booth
VP of Marketing Strategy, IMPACT
Insights Delivered When & Where You Need Them
Databox Insights is a reverse chronological stream — like Facebook’s activity stream — giving you updates about the performance of your business (and your client’s business if you’re using an Agency account) as things happen. And because it’s available on all your devices, you can monitor it anytime, any place.
So, what does it look like?
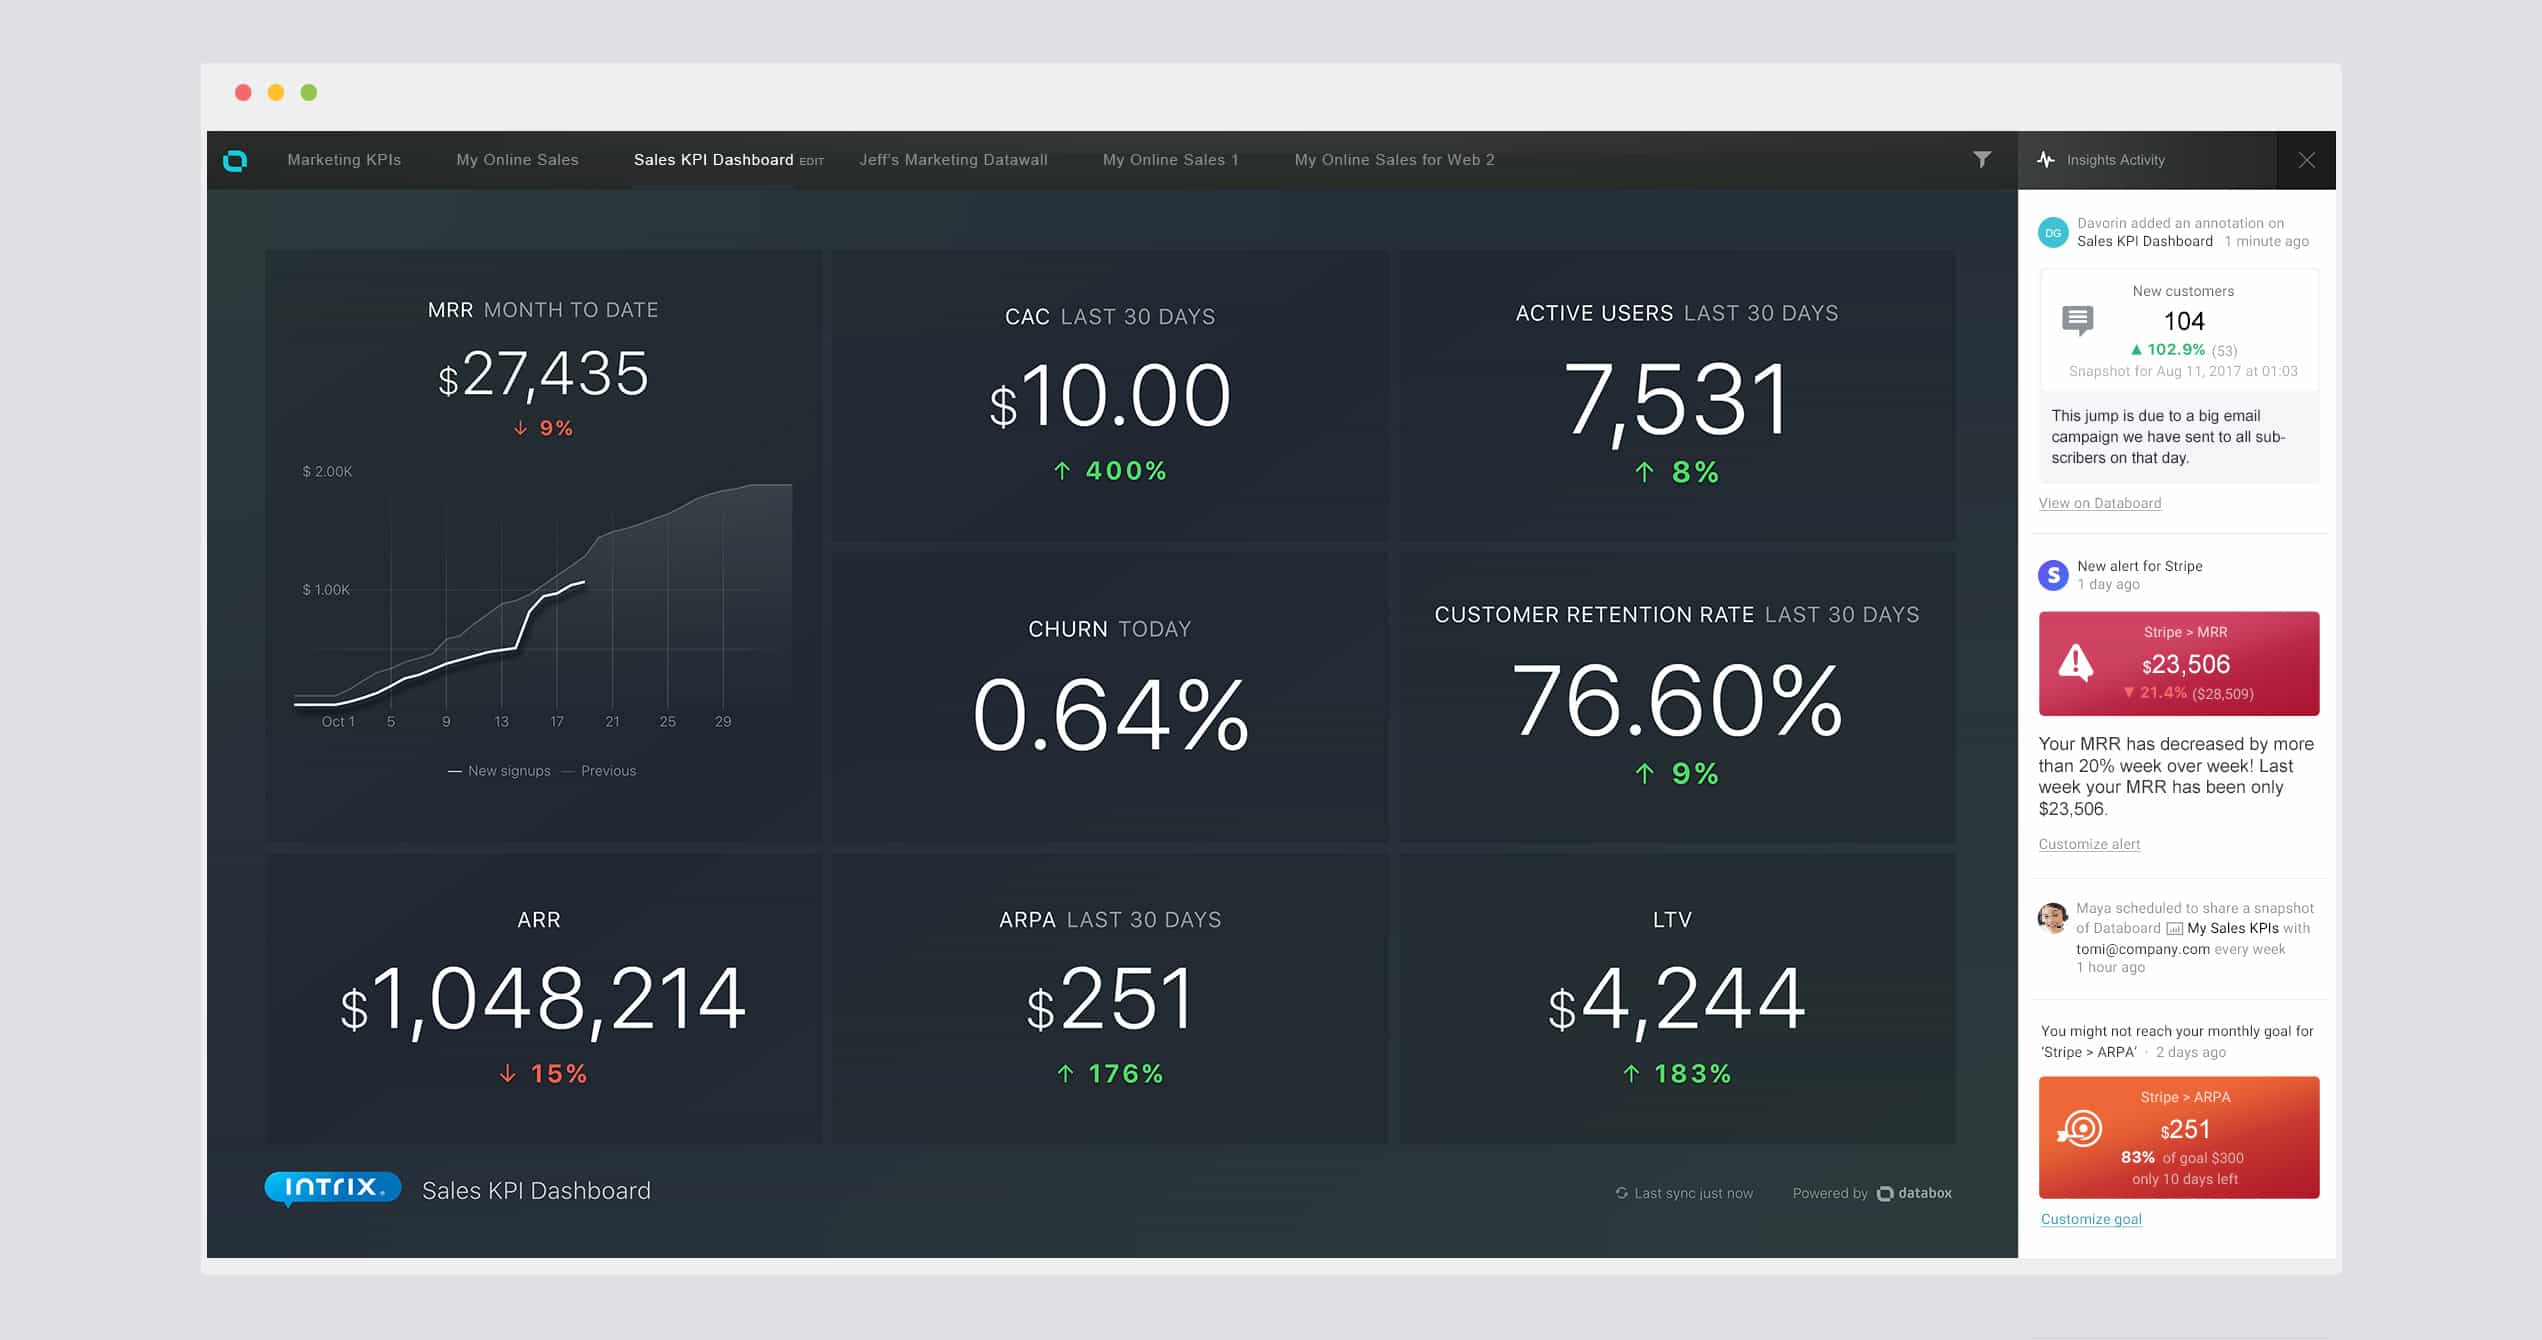
To access your stream on the desktop, login and click the “pulse” icon, in the upper right navigation.
Use this view to browse through all the Insights for your entire business.
When you spot issues or opportunities, drill into the dashboard to verify and explore the Insight further. When you’re looking at one of your Databoards, the feed will show only the Insights from that dashboard. For example, in the image below, you can see annotations, alerts and goal warnings that are related to the metrics shown on that specific Databoard.
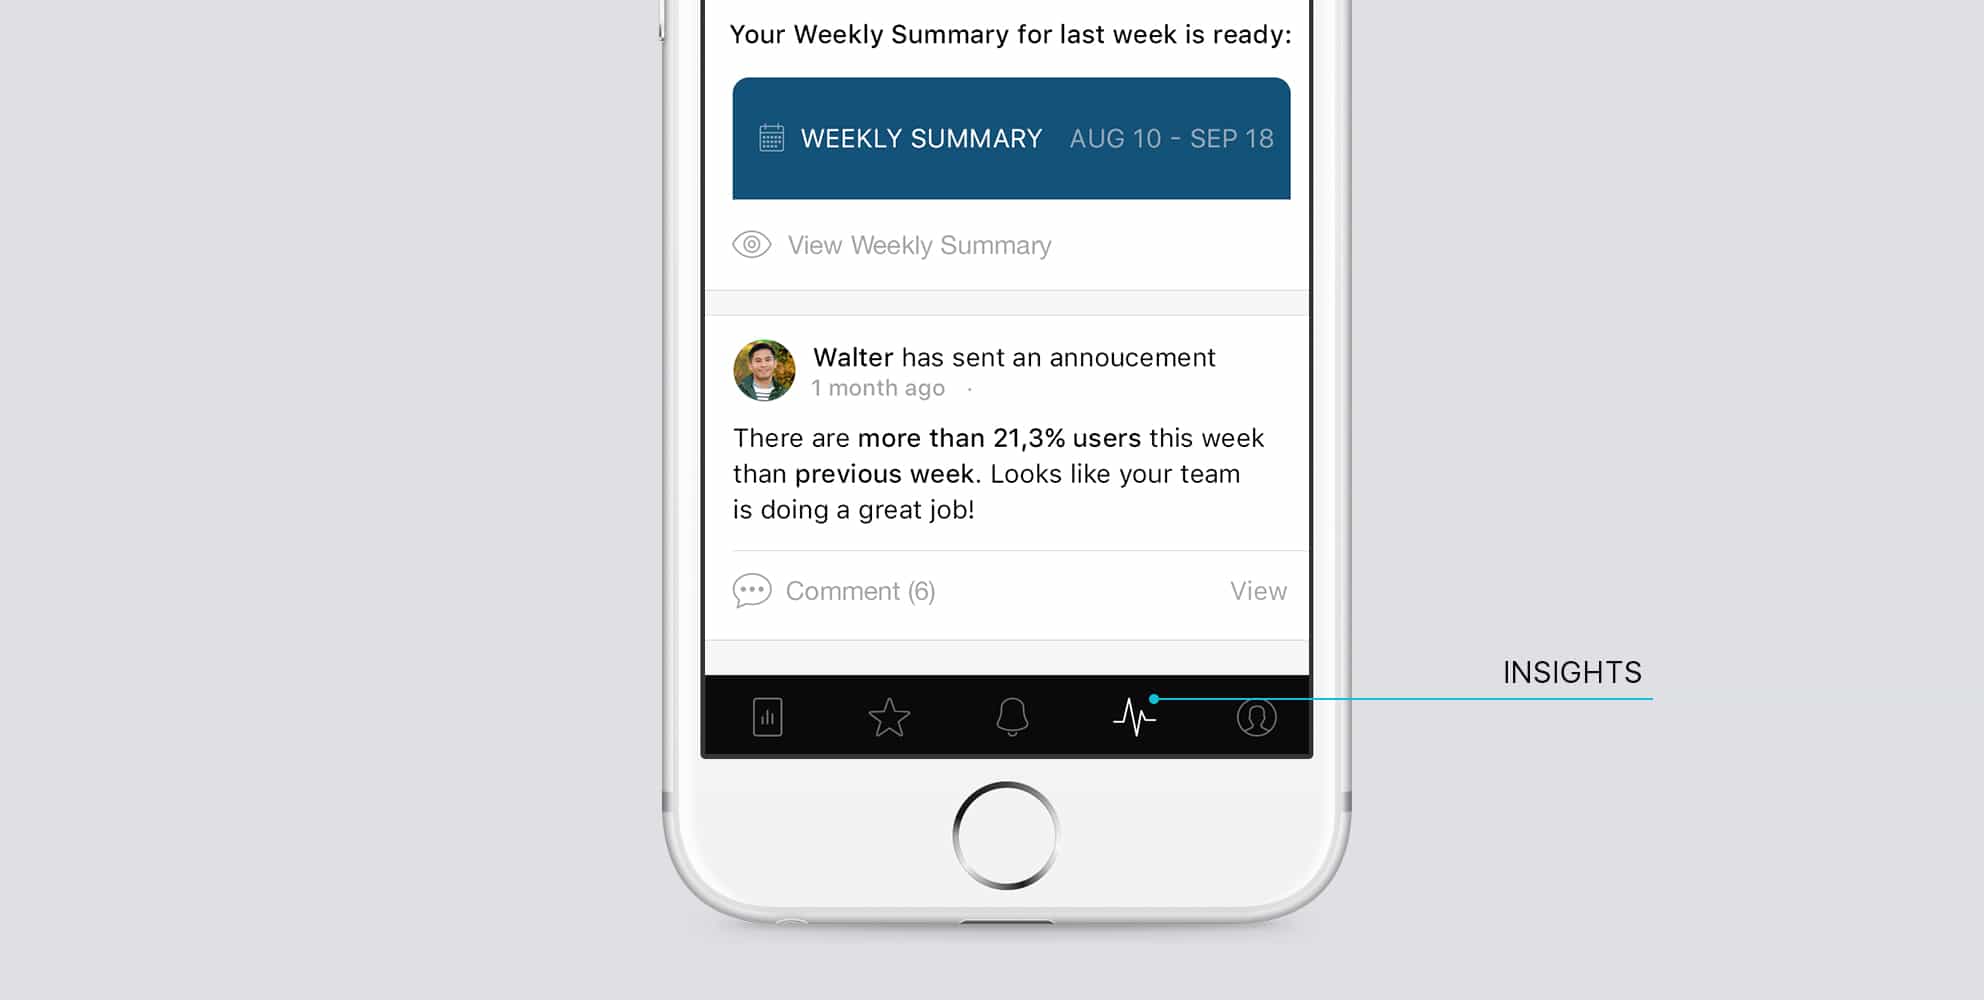
In the Databox mobile app, you can click the Pulse icon to view your Insights Stream too.
If you’re a marketing agency, Databox will show you Insights from all your clients from within the stream inside your agency account, on both mobile (iOS and Android) and desktop.
Choose The Types of Insights You Want to Receive
Currently there are 6 types of messages that will be delivered inside your Insights activity stream: alerts, goals, annotations, scorecards, activities completed by users in your account and recommendations.
1. Alerts
Our Alerts feature allows you to pick any metric you’re tracking and receive a notification when the number goes over or under a certain threshold, or when it changes by a specific percentage over a specific time period. For example, if you want to be notified when weekly organic search traffic goes 10% below the previous week, you can set an alert for that. Or if you want to be notified that your cost per lead for a specific Facebook Ad campaign goes up by a certain amount, you could set one up for that.
Alerts can be sent to you via Slack and email and now in your Insights Stream too.
With Insights overlayed on each of your Databoards, you will see a historical list of triggered alerts related to the metrics on each individual Databoard. This helps dashboard viewers more easily identify issues and recognize achievements by quickly reading text that supports what the numbers mean.

Keep in mind, alerts can be positive and can be delivered to your clients or executive team instantly. You can even choose to only send negative alerts to yourself so you can address them, while positive ones are sent to everyone.
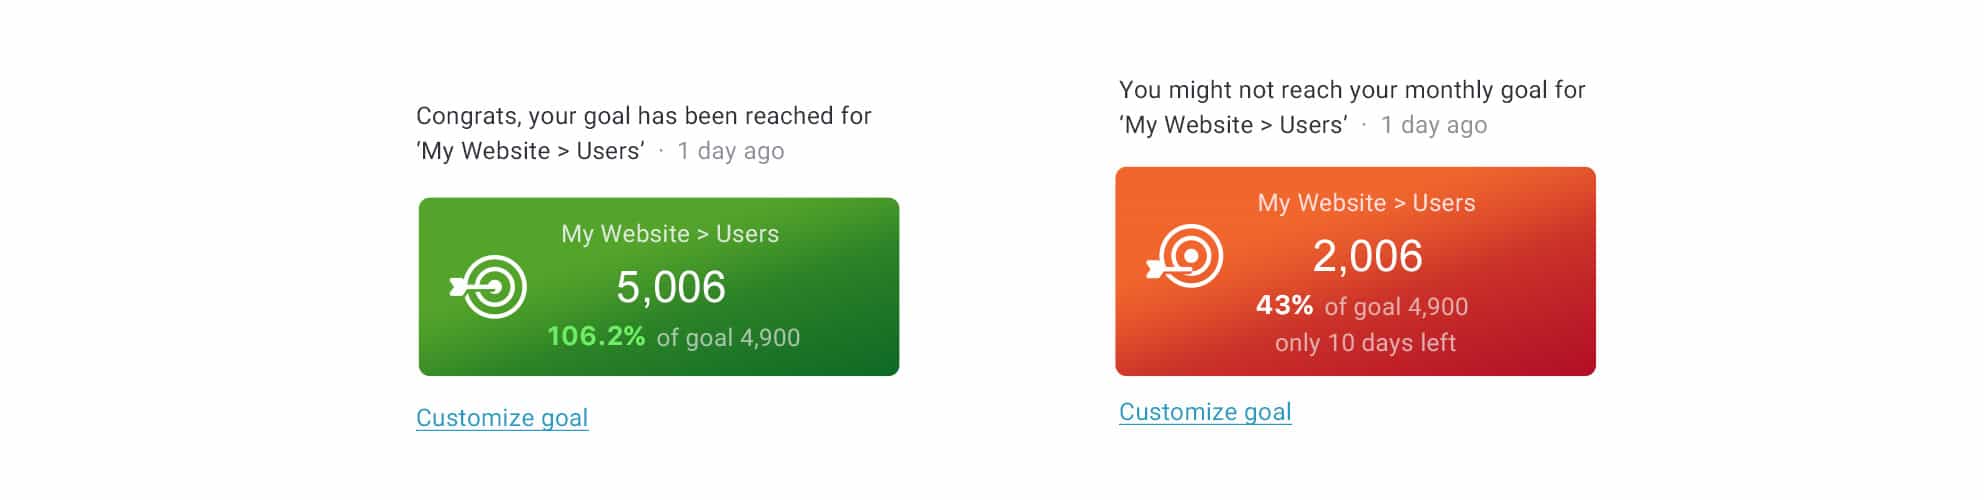
2. Goals
We built the Databox Goals functionality to help our customers define their goals for particular metrics and track progress towards achieving them. Goals are delivered into the Insights activity stream once you hit your target during the time frame you’ve set: daily, weekly, monthly, quarterly.
Coming soon, you will also receive warnings inside your Insights stream when it looks like you are unlikely to achieve a goal, based on the amount of time passed. No need to obsessively check your reports at the end of month or quarter gets closer, as you’ll get notified proactively by Databox Insights.
3. Annotations
Our Annotations feature allows any user of your Databox account to leave a comment about any metric at a specific point in time. For example, if you want to explain why traffic spiked, you can click on the spike on your traffic line graph and type, “Email campaign XYZ performed very well, causing this spike in traffic.”

When somebody annotates a chart, the note and a link to the Databoard will be delivered into the Insights activity stream. By sending this into the activity stream, the rest of your team will be notified, which can spark additional conversation and a pat on the back. The Insight will also show up on the Databoard so clients or bosses can see it when they view it again or during a meeting when reviewing the live Databoard.
4. Scorecards and Weekly Summaries
Because of their conciseness, our daily scorecard and weekly summary updates are very popular ways our users receive updates.
These updates are limited to 5 key metrics, and are delivered as push notification messages to our users. By keeping it to just 5 key metrics, it helps companies focus on what’s most critical.

Now, scorecards are also sent into the Insights activity stream.
5. Activity notifications
You can also choose to receive messages in your Insights activity stream that are related to your team’s usage of the Databox app.
Many of our users love how Databox democratizes data access and monitoring. It makes it possible for teams to know how other teams are performing, to help each other address issues and recognize and reward when others are performing well — all in real time.
But, it also causes some issues. Some of our customers and partners get confused when their peers add a new report template into their account, create a new Databoard, add a new client or connect a new data source.
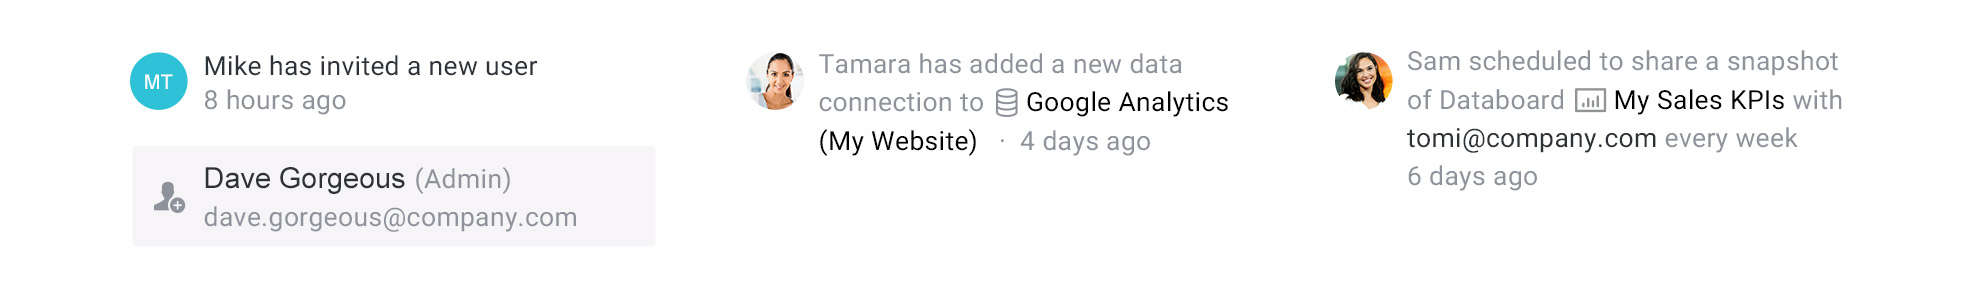
Now, we’ll add a message into the Insights stream whenever anyone does any of these (and a few other) things. For example, there will be a message when somebody shares a new Databoard with you, or when a new report is scheduled to be emailed to your team or clients. If you’re an agency you’ll see updates when somebody on your team adds a new client, new data source and when one of your clients accepts your invitation to join their Databox account.
6. New Templates, Data Sources and Recommendations
Databox now integrates with 130+ data sources out of the box — and we’re adding more every month. You can instantly visualize your data using report templates created by 40+ experts. Together with our partners, we’re constantly publishing educational articles to help our readers (and now, our users) improve their performance.
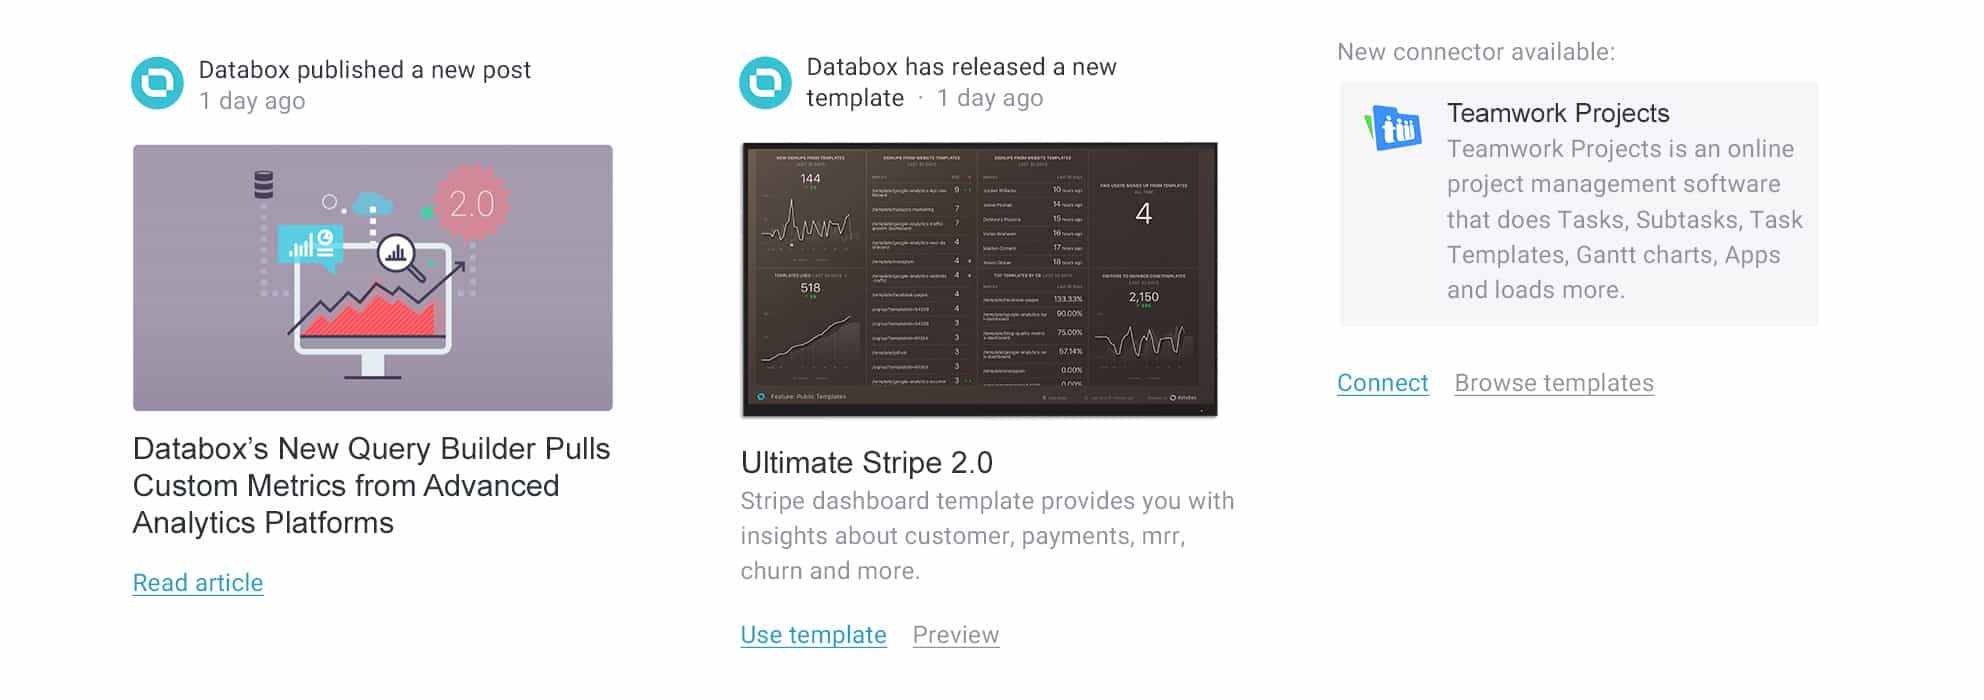
If you choose to receive these updates, we’ll be sending you an update whenever we publish a new report template for a data source you’ve connected, a new connector that might be relevant to your role, or an article that can help you improve your results.
To ensure we deliver messages that are welcome and helpful, we will track which types of updates are valuable to you and vary our frequency based on whether you click these updates or not. Over time, we’ll make these recommendations smarter and smarter. We will not send these updates to an Agency’s client accounts. For our paid customers, you will be able to opt-out of these updates altogether.
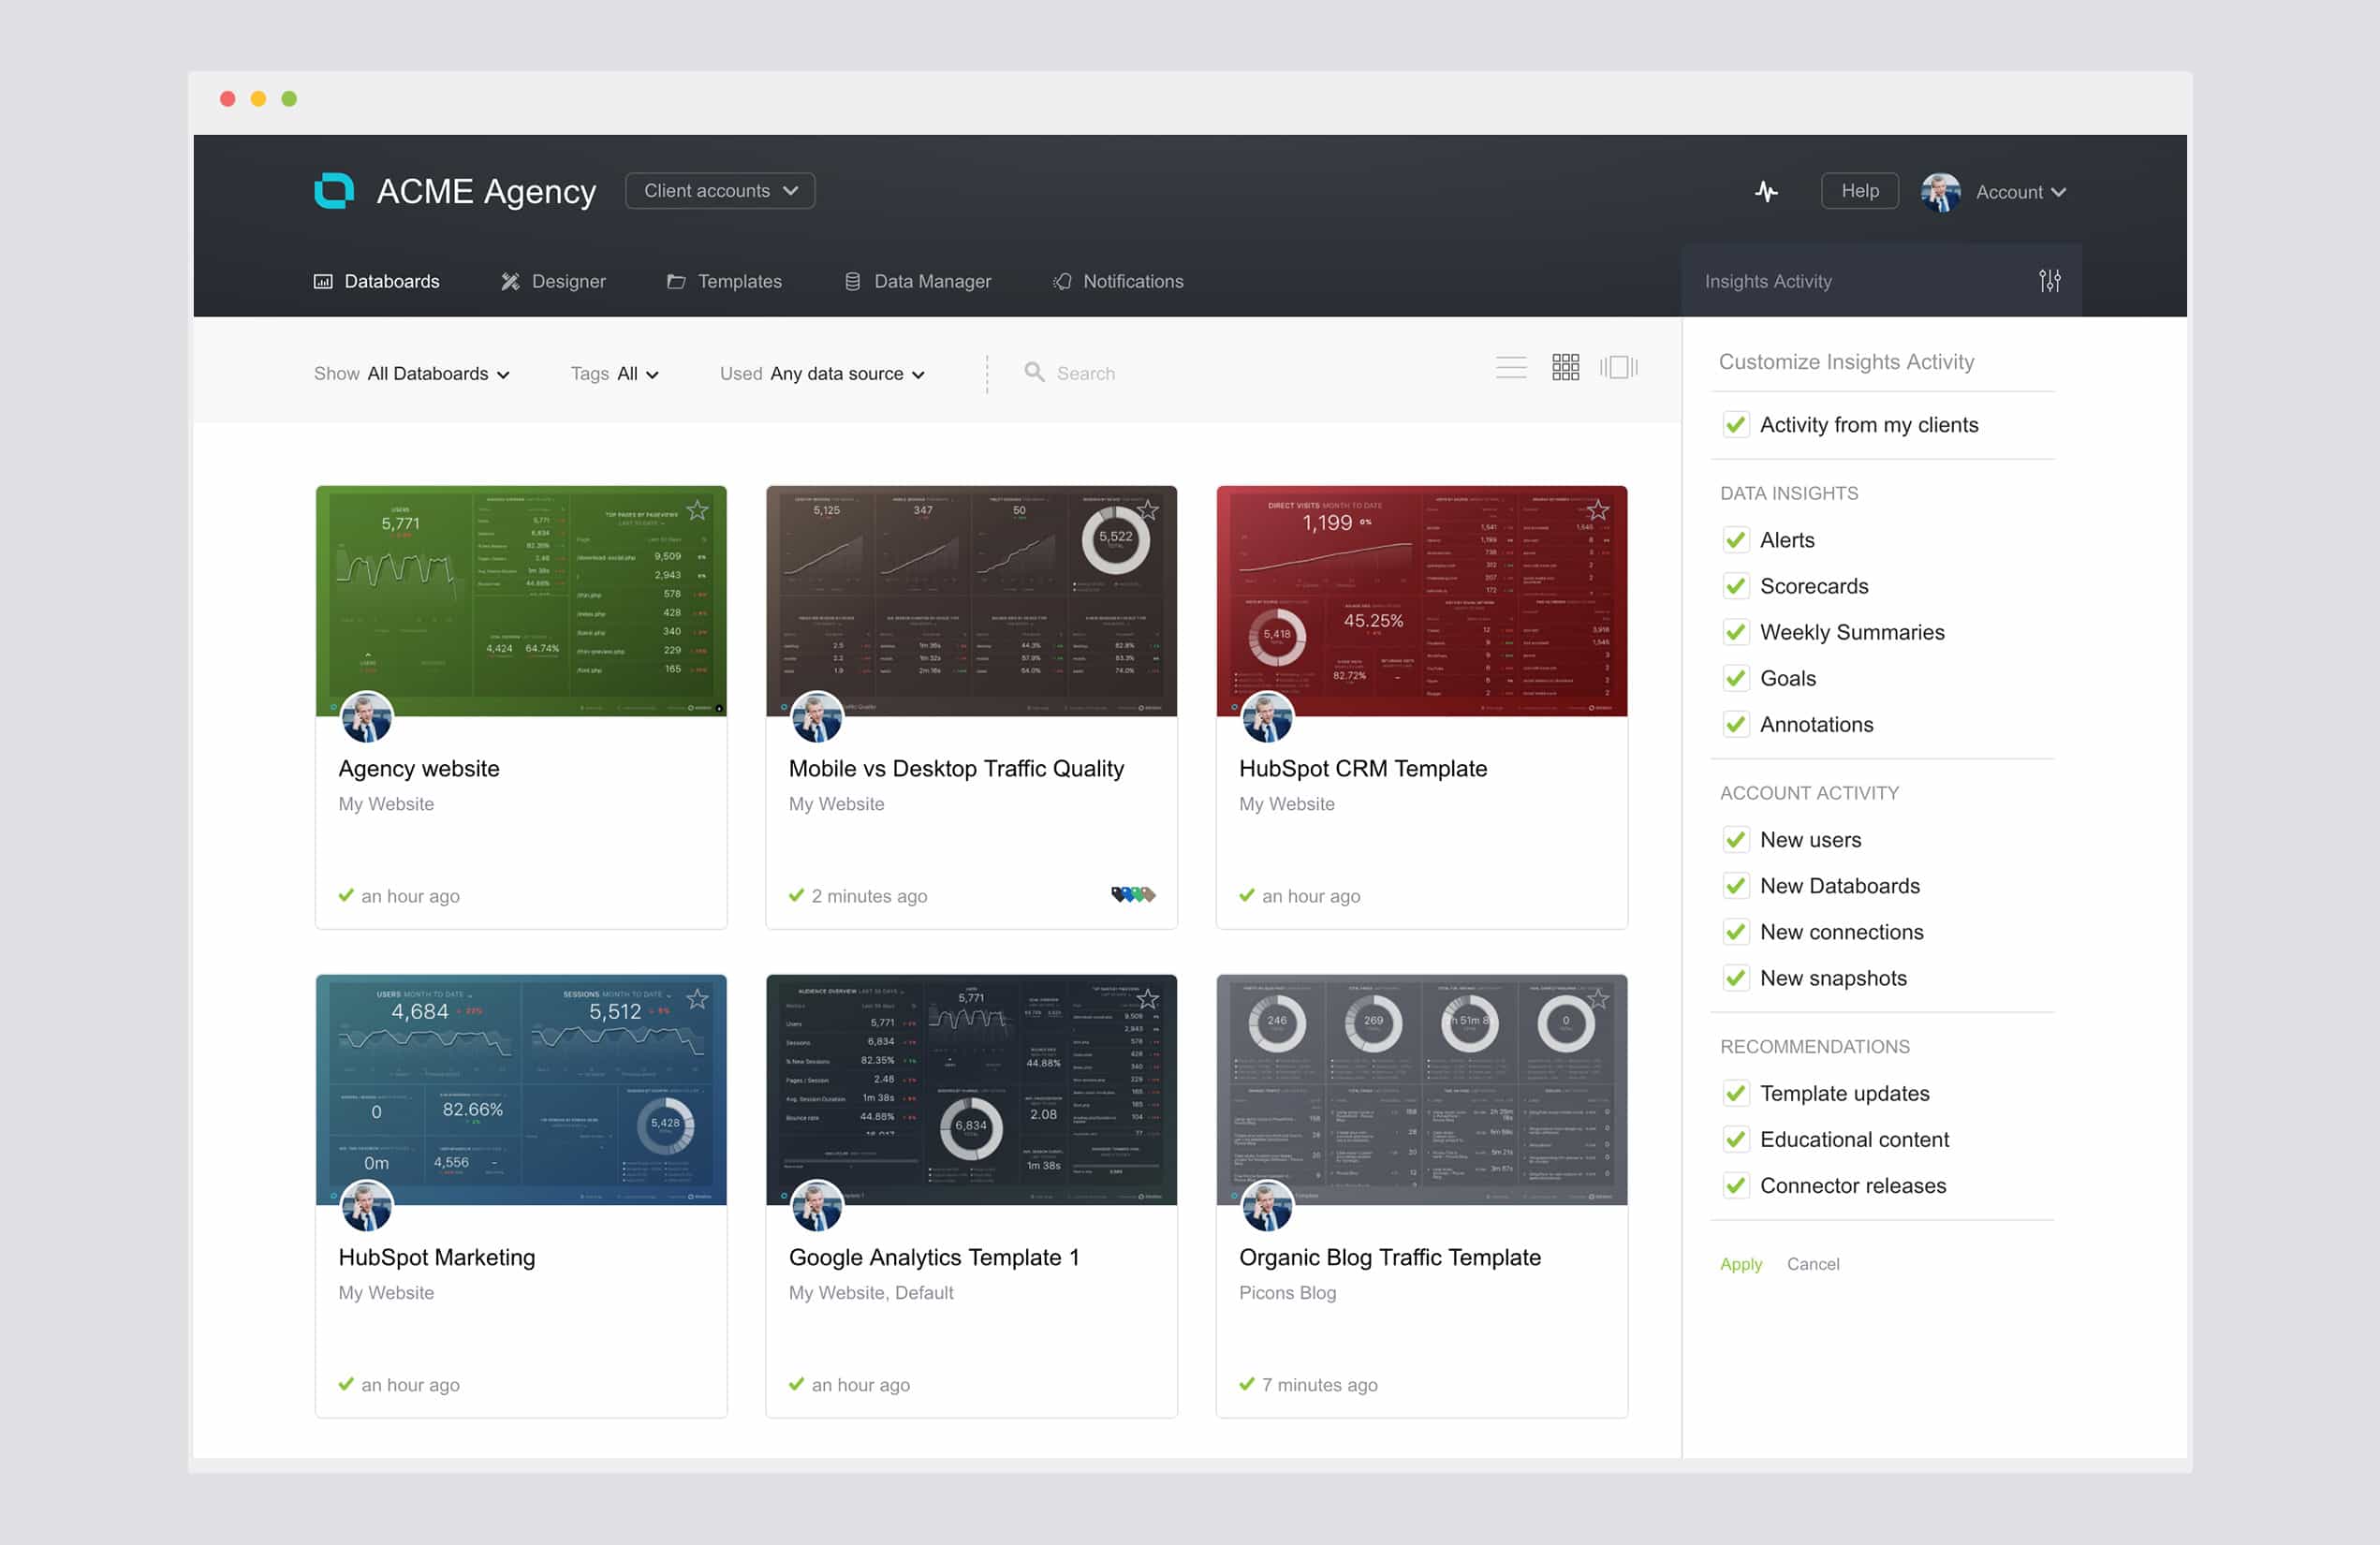
To control which Insights you receive, just check off the ones you want.
Use Databox Insights to Improve Your Company’s Performance
Ready to give Databox Insights a spin?
You should. Data-driven organizations report outperforming their peers by 3 to 1.
However, for most organizations, making informed decisions using data as an input remains elusive. The volume of data makes it difficult for anyone or even a team to pay attention to all that matters.
With Insights, we hope to make it a lot easier for you to improve performance by pushing insights to you. No more need to refresh reports to see what’s going on. And no more need to force your boss or clients to reinterpret the data you’ve already analyzed; just let them read the Insights.
The Insights feature is available in all our product levels, including our free account. Using an Agency Free Account, agencies can monitor up to 3 data sources for up to 10 clients for free too. Just sign up and choose your account type.
If you’re already a user, hopefully, you’ve stopped reading this and are already reading your Insights; setting up more goals and alerts and your scorecard, and leaving annotations so your team (and bosses and clients) can read your analysis and recommendations.
And the next time you think about checking your feed on Twitter or Facebook or browsing Instagram, check this feed instead. How could you not get addicted to paying attention to a stream of things about your company’s performance?
We welcome feedback and suggestions as you begin using Insights. Over time, we will add more intelligence, more timely recommendations, and benchmarks to help you set goals and exceed them.


