Table of contents
Tired of squinting to view pdf reports on your mobile phone? Need to present data live in a meeting or over a conference call without spending hours cutting and pasting into powerpoint? Want to motivate your team to exceed their goals by broadcasting their performance on a TV in the office?
We have you covered, as the video below shows.
And starting now, you can build a report once and have it be perfectly optimized for every one of these devices in just one step.
Unlike most legacy, desktop-first analytics applications like Tableau, Domo and Business Objects, Databox was built to be cross-platform from the ground-up: mobile, TV and desktop. And while mobile apps from dashboarding companies like Klipfolio, Geckoboard and Datahero were an afterthought, require you to build a completely separate report or are still non-existent, ours enables the types of interaction with your data you’ve come to expect from consumer-grade apps like Facebook, Twitter and Gmail.
In addition to making your data viewable on every device, we’ve also been focused on making it simple and quick to pull your data into Databox. While old-school business intelligence apps require expensive and time-consuming setup and implementation projects and an analyst to operate them, our goal is to automate business intelligence, so that you and your team can focus on improving results.
With the launch of Databoards, we’ve gotten one step closer to our vision of a minutes-long setup process:
- Connect your data,
- grab a report template
- and if you choose, customize your reports using our Designer.
Templates will now automatically be optimized for all devices. And when you design a report from scratch or tweak a template, you can optimize it so it’s viewable in our mobile app, on a TV and on your desktop in one step. Then, every time you edit the report by adding or removing a metric, adding a time interval or setting a goal, the change is automatically reflected in all views.
Excited? Read the rest to fully understand how this will save you time and help you more easily exceed your performance targets.
Merging Mobile Datacards and TV/Desktop Datawalls into One Thing: Databoards
Let’s say you want to use Databox to make it easy to track all your business data anytime, anywhere.
Up until today, unfortunately, you were forced to set up two reports:
- Datacards for mobile-specific dashboards. These were meant to give you quick updates on the go from your mobile device.
- Datawalls for desktop and TV dashboards. These were meant to give a full overview of all your KPIs, at your desk, on an office wall or in meetings.
This technically meant that your data was available on any screen, but many users found themselves rebuilding the same reports for each screen or just not viewing data on one of their devices. Worse, if you wanted to edit a report, you had to edit it in two spots.
Ugh!
We’re sorry we made you do this.
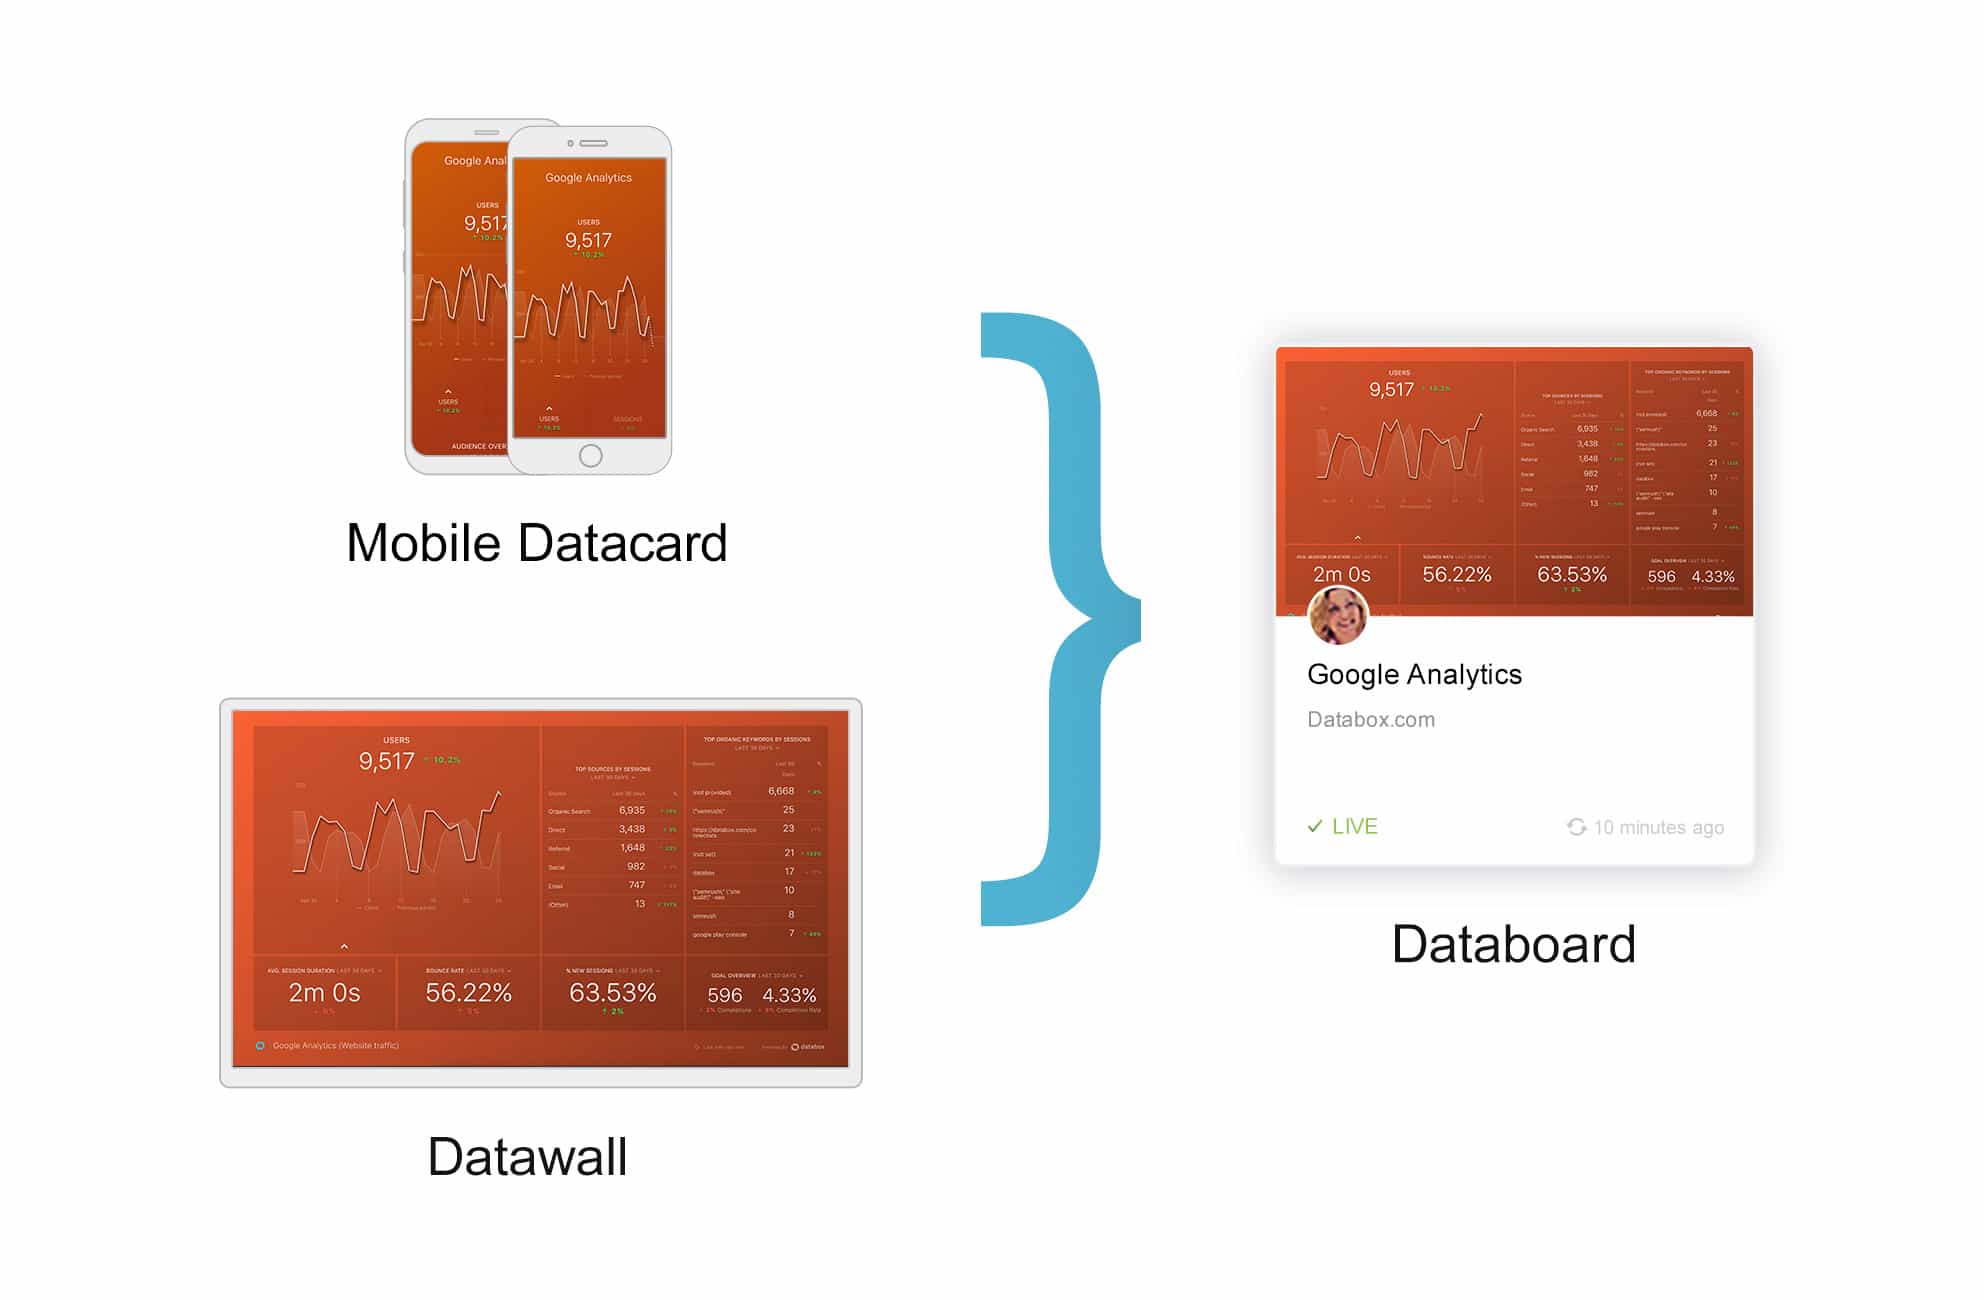
Build A Report Once, View It On Any Device
Last night, we automatically merged your existing Datacards and Datawalls into Databoards. If you’re a new user, you’ll just create new Databoards, of course.
Databoards adjust your report to each device type. We automatically optimize them for mobile, desktop or a TV screen. Rather than flipping back and forth between the two editors, you simply toggle a switch in the Designer if you want to rearrange or reorder your metrics for each screen.
We also created 100+ pre-built templates in our Report Template Library so you can instantly get the reports you need.
If you’ve ever implemented any other business intelligence software, you know from your months-long implementation process, “instant reports” is not something they ever said — or should have ever said. But with Databoard Templates, you spend less time building and more time improving your metrics.
Now, You Can More Easily Take Advantage of the Personalization Our Mobile App Provides
Now that all your desktop and TV reports can instantly be optimized for mobile, there’s no impediment between you and anywhere, anytime access to your data.
Our 100% native iOS and Android apps offers a lightning-fast mobile experience.
Plus, unlike any other dashboarding software, within Databox’s mobile app, you can personalize what metrics you view on your mobile phone versus what others in your organization might view on their mobile.
There is no need to get help from an analyst, IT team or your teenage son. With a few strokes of your finger, you can choose which reports to display on mobile, create a list of favorite metrics you wish to track on mobile and annotate (and snapshot) data to co-workers — all without ever leaving the app.
Taking advantage of iOS and Android’s push notification systems, you can also receive alerts and notifications when important metrics change drastically or when goals are achieved (or not achieved). Lastly, as the video below shows, you can set up a personalized daily scorecard for automated, quick, morning updates of your most important KPIs.
Now that you can create a report once, all of these capabilities are literally at your fingertips:
We’re Migrating All Your Reports into Databoards
For existing users, all your current mobile Datacards and Datawalls have been automagically transformed into Databoards. No action is required. We recommend you review each Databoard to make sure the metrics are in the desired order on mobile. And if you had gone through the trouble of creating Datacards and Datawalls with the same data, you might want to delete duplicate Databoards now.
But, other than that, there’s nothing you need to do start viewing your data everywhere.
And in case you were wondering, we generously upped your Databoard limit if the sum of the your Datacards and Datawalls exceeded your current payment plan.
How Do I Setup Databoards?
The same way you always did.
You still create new Databoards with our setup wizard or via the Databox Designer. When previewing or editing a Databoard, you can now switch between mobile and desktop view. When you add or modify a metric in one view, the other view automatically updates as well.
For example: if you add a metric (or datablock, as we like to call them) to the desktop view, the same datablock will be added to the mobile view. And vice versa.
However, we still give you the flexibility to change the size and order of different datablocks in each view.
How Do I start Enjoying My New Databoards?
We thought you’d never ask.
Good news! We have already created your Databoards, and they are waiting for you in the new “Databoards” tab. Head on over there and let us know what you think!