


Table of contents
Wondering how to leverage Google Analytics 4′ most popular pages?
Admittedly, creating content is only part of the job. Measuring its performance is another essential part of the content marketing puzzle. Thankfully, by studying your most popular pages in Google Analytics 4, you can learn how well your pages are doing.
To add, you can use the insights to optimize content, guide your content strategy, identify topics and content formats your audience prefers to consume, and a lot more.
Ready to learn about the gold you can unearth from your most popular pages in Google Analytics 4?
Buckle up as we dig into:
- How Do I Find Most Popular Pages in Google Analytics 4 ?
- 17 Things You Can Learn From Analyzing Your Most Popular Pages in Google Analytics 4

On we go.
How Do I Find Most Popular Pages in Google Analytics 4?
Finding your most popular pages is pretty simple.
Head over to Google Analytics 4 and tap on Reports on the right side of the dashboard. Now pick Engagement and go to Pages and Screens

This will show you essential metrics such as your:
- Pageviews or the vews a web page gets.
- Users or the total number of active users.
- Conversions or the number of times your users triggered a conversion event.
- Average Engagement Time or The average length of time that the app was in the foreground, or the web site had focus in the browser.
17 Things You Can Learn From Analyzing Your Most Popular Pages in Google Analytics 4
Now that you know how to view your Google Analytics 4′ popular pages, let’s show what you can learn by regularly studying these metrics.
But first, how regularly should you be viewing these metrics? 50% of our contributors analyze their top pages weekly with 33.3% doing so monthly and 16.7% studying them quarterly.

With that, let’s dive into the meat of the matter with a lowdown of 17 things you can learn:
- Determine which content is helpful to your audience
- Identify the popularity of content based on its quality
- Learn the products your target audience is looking for
- Find out how to improve your content’s readability
- Learn where your traffic is coming from
- Compare with past data
- Improve your messaging
- Understand how much of your content is consumed
- Figure out which topics are important to your audience
- Identify popular content formats
- Fine-tune your content strategy
- Create a checklist of what makes good content
- Learn how fast content gains traction
- Figure out how well your content is retaining visitors
- Figure out how well pages are converting
- Determine where to dedicate resources
- Identify your visitor intent
1. Determine which content is helpful to your audience
A winning content strategy is one that focuses on producing content that resonates with your target audience.
But while you can always guess what’s useful content, checking your Google Analytics 4 can help you understand how accurate your guesswork is and help you identify your target audience.
In this, regard, when asked about Google Analytics 4′ most popular pages, CocoSign’s Stephen Curry remarked: “Understanding the functionality of each page and the changes that take place on each page can help provide greater understanding.”
To this end, Curry recommends you “look at the negative styles on each page. If a particular page has seen a noticeable decrease, the problem is probably divided into that one page.”
“I like the pages that are frequently visited on my site – even if I want to know which pages could do best, or which ones did best last month. This data gives me a deeper understanding of what kind of content works best for our audience, and what comes in handy,” explains Curry.
“Sometimes season blog posts draw a lot of traffic, but information pages do not – or vice versa. Numbers actually write us our content strategy and help us transform other pages according to the changes we are already making.”
Related: Content Strategy vs. SEO Strategy: How to Decide Which Comes First
At The Lemon Law Experts, Jessica Anvar shares studying the most popular pages in Google Analytics 4 has helped with the same.
“Using Google Analytics 4 has helped our firm to optimize our website, but even more importantly, it’s helped us to give clients the information that they are searching for,” Anvar writes.
Here’s how they do it: “By analyzing our top-performing pages, we are able to build on and create more content that consumers find useful.
Our business is about guiding our clients through the Lemon Law process as well as informing them about the Lemon Laws and their rights — which is why it is crucial to create the content that they want.”
Thanks to Google Analytics 4, the team has also learned which content format helps their audience the most. “It has shown us that creating more resources and guide pages for consumers, writing articles about vehicle defects, and creating location-specific pages is exactly what we need to be doing to promote our business and provide consumers with access to valuable information.”
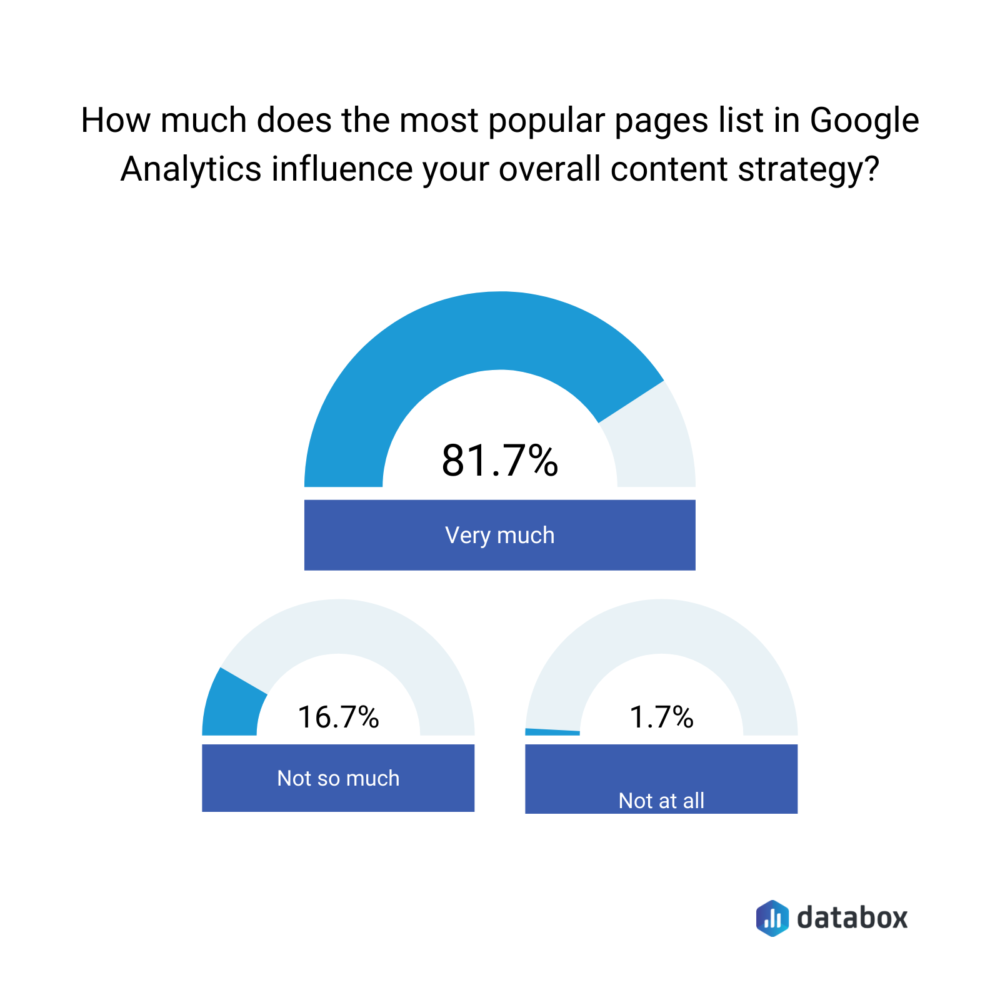
These folks aren’t alone in studying their top page to shape their content strategy. The majority, 81.7% say the most popular pages list in Google Analytics “very much” influences their overall content strategy.
Only 16.7% admit the impact is “not so much” with 1.7% saying there’s no influence at all.
2. Identify the popularity of content based on its quality
In Google Analytics 4, you can always be looking at not just one metric around page popularity but more such as unique pageviews, average time on page, and most viewed.
Isla Sibanda from Privacy Australia recommends never studying a metric in a silo. “An extremely important lesson I learned with my experience in data analytics, is that one value alone is not enough of an indicator to form long-term plans.”
Sibanda, advises “We should look at the pattern in the number of visitors on the website while seeing how many of them leave the front page without browsing through. Also, the amount of time they spend per portion of the content. This will help us specify where exactly to focus our resources and efforts.”
Explaining this, Sibanda comments: “For me, the most marketable page on the internet is not one that has done exceptionally well in search over the last few months or one that has been viewed the most.
Rather for me, the popularity of a page is dependent entirely on the quality of its content and the content that has witnessed the highest numbers in terms of social media traffic. These numbers include measuring the social media metrics in particular,” Sibanda goes on.
“This category of features involves brand awareness, the audience growth rate, and the reach of your posts which shows how many people have viewed it within a certain period.
If we decide to look at website metrics that make a page most well-sought, in my opinion, the numbers to look out for including the number of visitors along with the bounce rate and the value that tells it all the session duration.”
The take-home message? Look at various metrics to determine your content’s quality in terms of the engagement it garners.
Remember: only content that’s written clearly and adequately answers your audience’s questions will attract engagement. This engagement comes in various shapes and sizes. For example, more social shares, more time spent reading it – it even attracts inbound links and comments.
3. Learn the products your target audience is looking for
To Leena.AI’s Chirayu Akotiyathe “most popular pages can tell us what all products users are looking for on our website.”
For B2B folks, this translates to pinpointing “the pain points users resonate with the most (in the case of blogs/guides).”
In simple, “If the average time on the page is more, it simply means that the users find the information useful, and we should adopt the same practice for upcoming pages or improve the existing ones.”
One good practice here is to collate all the pages with a good average time spent. Then, review them for common winning points.
Is the content on these pages more in-depth than other pages that didn’t get as much average visitor time? Is the content organized in a more readable fashion? Or is there something about the page load speed?
Whatever your observations, put them down in a list. Use it as your checklist to refresh and optimize other pages on your site.
4. Find out how to improve your content’s readability
Like the Leena.AI team, the Nolah Mattress looks at the average time on-page for a similar reason.
Says Stephen Light: “For a mattress company like us, we measure most popular pages by average time-on-page because it tells us how much time visitors are investing in learning about our products, which increases the likelihood they’ll convert to buyers.”
By analyzing Google Analytics 4′ most popular pages “the most important thing we’ve learned is how to present content in a way that will ensure visitors read on and absorb our USP (unique selling proposition).”
“It’s taught us a lot about how to use visuals, design, and line breaks to keep people engaged with the meat of our message,” Stephen outlines.
Elice Max of EMUCoupon echoes the same. “Most popular pages to me are those with the highest average time on page. While you can get lucky with the algorithm and have thousands of people clicking on a particular page, it’s of no use if these visitors are not staying around.
Analyzing my popular pages over the years has taught me the importance of whitespace. It just so happens that customers are sticking around on a page when they don’t feel overwhelmed by the content. When the white space is abundant, they find it much easier to process the information.”
Meaning: you can learn not just which topics resonate with your audience and which content formats get the most attention but also how to format your posts.
As a rule of thumb, the easier it is to read your content, the more time people are going to spend time consuming it, provided the content is high-quality itself.
Want quick tips to boost your content readability? Here you go:
- Make sure the font size and type are legible (translation: no cursive, small fonts).
- Write short sentences and paragraphs so you can introduce more whitespace to the content.
- Structure your content using headings, subheadings, and bullet points.
5. Learn where your traffic is coming from
“For us, the most popular pages, and the ones we focus on, are the most viewed,” shares James Parkinson of Personnel Checks.
“Our ‘latest news’ page receives some of our highest traffic, so we have included our newsletter sign up at the top of this section to maximize visitors to sign-ups to our mailing list.”
“We also keep an eye on the worst-performing pages, monitoring whether they are still relevant and how they can be improved to increase traffic,” Parkinson highlights.
“We also frequently use the acquisition channels reports to assess where our traffic is coming from, particularly in relation to our social media, as a way of gauging how well our marketing strategy is performing.”
For Imaginated’s Nate Torres also, learning which channels are driving traffic is crucial. “As a digital publishing platform, I would characterize my most viewed page as my most popular page. I want my content to reach an increasing number of people; hence, I rank popularity by web traffic.”
Torres adds, “Analyzing the source/medium of web traffic, that is, through social media posts, web search, email, etc., allows me to gauge the most effective means of digital marketing. Knowing that people access my articles through social media and organic search has allowed me to focus my resources on SEO and similar digital marketing techniques.”
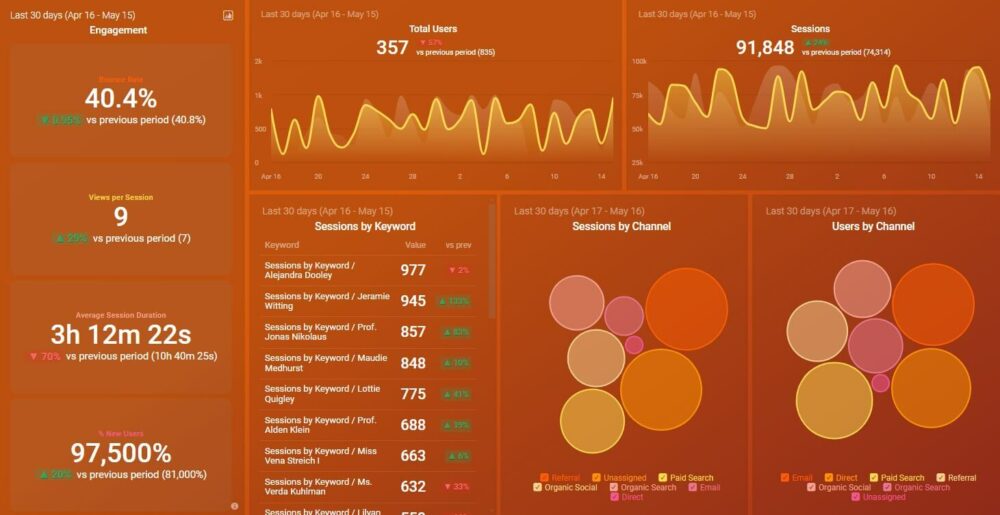
PRO TIP: Save Time Creating Your Google Analytics 4 Traffic Dashboard
Yes, you can DIY in Google Analytics 4, but what if you would prefer a simpler, easier route? After all, once you learn how it’s done, you still have to choose the right metrics and design your custom dashboard to answer the important questions your stakeholders have, for example:
- How many people are visiting my website?
- Which channels bring in the most users?
- How engaged are my users?
- How well is my website keyword optimization performing?
and more…
Now you can benefit from the experience of Google Analytics experts, who have put together a great Databox template showing all the most important website traffic KPIs. This template allows for easy integration with scheduled report delivery. It’s simple to implement and start using as a standalone dashboard or in marketing reports!
You can easily set it up in just a few clicks – no coding required.
To set up the dashboard, follow these 3 simple steps:
Step 1: Get the template
Step 2: Connect your Google Analytics 4 account with Databox.
Step 3: Watch your dashboard populate in seconds.
The takeaways? We have a handful. First, find out your popular pages that get the most traffic. Use them to capture the incoming traffic with a relevant CTA (think: newsletter sign up or offering a relevant content upgrade) and nurture them further.
Two, identify which pages aren’t popular or perform poorly. Use the checklist method shared in the point above to optimize them.
And, three, learn which channels are driving the most traffic to your content. Now, double down on the resources you spend on them to grow the traffic coming from those channels.
6. Compare with past data
EpicWin App’s James Stephenson makes some important points on using GA correctly. “One thing to remember is that GA can only gather data once you have set it up. And to have relevant analysis, you need to have historical data between 3 to 6 months.”
This is essential so you can determine what changes have been helping you improve your traffic and vice versa. For example, if you’ve taken on a content refreshing plan, you’ll want to review how the changes are showing improvement by comparing results with historical data.
Speaking of changes though, Stephenson warns, “Remember to make minor tweaks at a time. Changing too many things all at once will make it hard to keep track of what really moves the needle.”
As for the Google Analytics 4 most popular pages that Stephenson studies, those are “high unique page views, average time on page, and a very low bounce rate.”
Wondering how tracking your bounce rate by blog post could be helpful? Then check out our data snack below to:
- Learn how to track your bounce rate for each blog post in Databox
- Review topics and modify your blog content strategy accordingly
- Apply best practices to reduce bounce rates, again according to data gathered
7. Improve your messaging
“When it comes to ‘most popular pages,’ we view it as a combination between the most views + the most time spent on a page,” points out Jonathan Zacharias of GR0.
“Specifically, a customer/client who lands on a page is intrigued, whereas, one who stays on that page is finding value,” Zacharias continues.
“As such, by analyzing and comparing the two metrics, we strive to:
- Improve the messaging/marketing (i.e. the ‘hook’) of pages with low traffic and a long time spent on-page or
- Improve the content of pages with high views and a low time spent on it.”
“By analyzing these in Google Analytics 4, the biggest thing I have learned is that not all pages can be treated equally,” says Zacharias. “Indeed, have a goal for each page, and strive to reach it over time. Not all pages are created equally, and neither should their results.”
A noteworthy point here: sometimes it can just be the hook or your post’s introduction that’s driving away all the traffic. If you see that the page is optimized in all other ways, for example, it’s structured well, is comprehensive enough, uses keywords naturally, and so on, you can conclude the hook needs reworking.
At FragranceX too, the team is focused on optimizing their messaging so that the pages can generate leads effectively. Lenna Serras writes, “When we analyze popular pages we are looking at the pages with the most views. We pay attention to the time on site and bounce rate because this tells us what type of content performs well and how long visitors like to stay on our site.”
“Our primary focus is in ensuring that the pages driving the most traffic are effective in generating leads,” Serras elaborates. “We consider ways to improve the messaging and optimization on these pages. Ideally, we want the time on page to be increasing and the bounce rates decreasing.”
Related: 7 Efficient Ways to Track Leads in Google Analytics
8. Understand how much of your content is consumed
Knowing exactly how much of your piece is being read helps you determine the average number of words people read at a time. It also indicates which elements make it more readable.
Speaking of this, Dan Ni from Messaged.com writes, “A popular page in our terms is not the only one that has the most pageviews, as your views are one of the most basic metrics to measure the popularity of a page.
For us, a popular webpage has the greatest ranking when searched on a search engine and has the most prominence based on how well it is optimized for users.”
“Hence in more technical terms, a low bounce rate means a popular page,” concludes Ni.
“What did we learn in Google Analytics 4? Analyzing bounce rates is one of the most important tasks to perform for your webpage. And one of the most important things learned from analyzing Bounce rate in Google Analytics 4 is implementing scroll tracking on pages. This helps you focus on the main goal which is how much of your content is being consumed.”
Root and Branch Group’s Zack Duncan also speaks in favor of scroll tracking. “For us, ‘most popular pages’ are the most viewed pages. For many clients, these tend to be long-form blog articles that share expertise, build trust, and help to generate leads. The most important metric we look at is scroll depth, so we can understand how engaged the reader actually is on the page.”
“Many of these sessions will be single page views (meaning they will count as a bounce and their time on page will not be recorded), so without scroll depth, we really have no idea if they are making it 50% of the way down the page, 75%, or leaving before even making it 10% of the way through,” explains Duncan.
“Analyzing our most engaging pages in terms of scroll depth completion helps to uncover patterns about what works best in engaging readers. Scroll depth tracking is a type of event tracking in Google Analytics 4 and does require the help of Google Tag Manager to set up. Here’s a tutorial video we put together detailing how to do it:”
You can also leverage heatmaps to find out how site visitors are consuming your content. Heatmaps give you a visual representation of areas your visitors are viewing the most. Having this information helps you position CTAs strategically to grow your leads.
Related: Google Analytics Reporting: A Complete Guide to Reports, Metrics, Dimensions, and More
9. Figure out which topics are important to your audience
Using Google Analytics 4′ most popular pages, you can also pinpoint the topics that broadly interest your audience. For instance, learn which categories on your blog are the most read.
You can also start connecting dots by seeing patterns in topics that quickly become popular among your readers. This, in turn, helps you decide which pages to refresh and which topics to create more content on.
Case in point: the Ashore team created an ebook on a popular blog topic. Cody Miles talks about it. “By looking at Google Analytics 4, we can see which content performs best, giving us insights into where touchpoints will be most effective.”
“For instance, we’ve discovered that our most popular article, a blog entitled ‘How to Write a Follow-Up Email After No Response From Client’ brings thousands of people to our site every month. That information led us to create an ebook on the same topic for visitors to download in exchange for their email, allowing us to continue communicating with prospective customers and bring them one step closer to buying.”
Want a shortcut to verify a topic idea’s popularity in the same way? Follow these two steps:
- First, post on the topic on social networks where you’ve an established community. Pay attention the traction the post gets.
- Second, if the traction is good, create a blog post on it. From there, use GA to identify the popularity of the post and create more in-depth content on the topic.
Alternatively, do what Meg Casebolt from Love At First Search does. “I use this report to see which topics are resonating with my audience so that I can create complimentary content to extend their stay on the site.”
“I like to add a secondary dimension for Source, to see how different marketing channels are sending users who are interested in distinct content, so I know what to share on which platforms,” observes Casebolt.
“I also like to review which pages people visit *after* their landing page, so I have a better understanding of how people navigate through the site and what they value.”
10. Identify popular content formats
Castos’ Craig Hewitt remarks, “We look for a combination of page views and time on page to determine our most popular pages. By analyzing which pages are receiving the highest number of views we can identify what topics are of most interest to our audience and produce more of them.”
“One important variable for us is the average time spent on each page,” adds Hewitt. “We have found that mixing text with photos, infographics and videos enhances user engagement and increases time on page. We also like to track how many views are from new visitors as this indicates how our site’s SEO is performing.”
Similar is true for GoodHire according to Mike Grossman. “By analyzing the most popular pages on our website with Google Analytics 4, I’ve discovered that users are naturally drawn to pages using multimodal forms of content.”
“For example, pages with a combination of text, images, and video will almost always outperform those using just text. Different forms of content make for a more engaging on-site experience, which makes people less inclined to abandon the site.”
Grossman elaborates, “We employed these insights by using a varied content style across each of the pages on the GoodHire website. In doing so, we created a consistently engaging on-site experience which helped in increasing views and time on page.”
“The key takeaway here is that people have different learning styles. Using a varied content style gives everybody a chance to read and engage in a way that they find most enjoyable,” in Grossman’s words.
11. Fine-tune your content
Emily McCulloch from City Beauty makes this point. “There’s a lot of different things that can be learned from looking at ‘most popular pages’ in Google Analytics 4.
At the end of the day, the most important stats for a business to look at are usually the amount of traffic the page gets and the resulting revenue. Other stats such as bounce rate, conversion rate, and average time on pages are also important to note and can give clues as to how and why certain pages receive higher amounts of traffic and revenue.”
According to McCulloch, here are some things you can learn:
- “If a page’s bounce rate is particularly high, that can be a sign of slow loading times or unoptimized content.
- If people aren’t staying on pages long enough, that means there isn’t enough high quality, detailed content on the site.
- If conversions are high (for example, if a page is getting a lot of email signups) but the revenue is still slow, that can be a sign that your business is doing a good job of capturing leads but needs to rework the selling strategy for closing deals.”
“The most important thing I’ve learned from looking at the ‘most popular pages on Google Analytics 4’ is what kind of content connects best with our demographic and how to best promote it,” McCulloch points out.
Put another way, by studying the channels that are driving the most traffic, you can tell where to distribute your content more effectively.
The OLIPOP team is also focused on fine-tuning their content. Says Melanie Bedwell: “We personally like to analyze which pages our customers are on the longest. By measuring time on page we’re able to figure out which pages are most effective and which are not.”
“Ideally we want our target audience to get to our landing page quickly and spend the most time there, but that’s not always the case,” Bedwell admits. “Google Analytics 4 helps us figure out why, which forces us to tweak things until we achieve our desired result.”
Related: Dwell Time for SEO: What It Means & 25 Ways to Improve It
12. Create a checklist of what makes good content
This is similar to what I suggested above – studying popular pages to outline traits that makes it effective at holding readers’ attention.
Scott Nelson from MoneyNerd Ltd talks about it too. “When it comes to analyzing the value of our ‘most popular’ pages, we compare across three metrics: the number of sessions, the bounce rate, and the average session duration.”
“The principal advantage is being able not only to measure the volume of traffic, but the rate of retention/attention held by the average reader,” Nelson points out. “Through this, not only can we see the most popular pages on paper but the articles that are driving the most engagement. We can then reverse-engineer this to evaluate the effectiveness of successful articles, implementing its successful features in future articles. We can ultimately undergo a process of continual improvement with our content as a result.”
13. Learn how fast content gains traction
Nextiva’s Joe Manna makes an interesting point on Google Analytics 4′ most popular pages. “Don’t fall for the illusion of just tracking pages by page views. Instead, assess your content by days published to see the efficiency and success of recent content.”
“Example: 1,000 page views in three months is much more interesting than 1,000 views in a year.”
“And not every page view is the same,” Manna adds. “For example, some of Nextiva’s most revenue-producing pages aren’t the most popular. For instance, Nextiva’s VoIP educational article gets a ton of traffic, but the small business phone system page drives much more revenue. Why? It’s about intent and helping the audience accomplish their desired goals.”
“So if traffic drives your success, focus on that. Otherwise, test and tune your content to drive more conversions and scale the business,” concludes Manna.
14. Figure out how well your content is retaining visitors
This is a key aspect of publishing engaging content. It should leave enough of an impression on your target audience that they return to it for reference or reading more content on the same site.
That’s how you build authority on the subject and that’s also how you turn curious visitors into interested leads.
Energy Sanity’s Mushfiq Sarker is on the same page. “I use most viewed and unique pageviews to assess my most popular pages. Most viewed is a good metric, even if it has a lower amount of unique pageviews because it means the content is compelling enough for the same people to return to it.”
“And unique pageviews is a good metric because it means the content appeals to a vast amount of people,” Sarker says. “Together, these two metrics give you great insight into your audience and how your content marketing plan is performing.”
15. Figure out how well pages are converting
All content you create has to have a goal. This could be anything from educating your readers to getting them to subscribe to your newsletter, follow you on social, or download your latest resource.
When you see it this way, you’ll know that most content should be planned with micro conversions in mind.
Justin Smith of OuterBox emphasizes this too. “To us, our most popular pages refer to the ones that drive the most conversions. At the end of the day, our website needs to drive leads and if it’s not doing that, something is wrong.”
“Within Google Analytics 4, we’ll not only track the pages that are driving the most conversions, but we’ll also track their conversion rates,” Smith highlights.
“If we see that one page has an especially high conversion rate, we’ll examine it to understand what is different about it versus our other landing pages. Perhaps it’s a certain video, or even the color of a CTA button.”
“By regularly reviewing our top-converting landing pages and their conversion rates, we can A/B test what elements we believe are having a positive impact.”
PRO TIP: Watch this video to learn how to identify which pages drive the most conversions, set conversion goals, and track their completion rate.
16. Determine where to dedicate resources
We’ve already talked about committing more resources to channels that drive the most traffic your way.
On the same note, Sasha Matviienko of Citadel shares. “Because every page of our website is optimized from the SEO standpoint, we always review Entry Page stats. This way we know how to allocate resources for our SEO and advertising efforts.”
“Some extra advertising dollars may potentially be allocated to the pages that get less SEO exposure. As for the pages that get the most Organic Search Visits, we ensure that we have enough employees located in those areas in both Sales and Execution departments.”
Related: SEO vs. PPC – Which Strategy is Right for Your Business
17. Identify your visitor intent
Speaking about Google Analytics 4′ most popular pages, Colton De Vos from Resolute Technology Solutions notes, “Most popular pages typically refer to the most visited content on a website – be that a web page, blog, article, or interactive content.”
“Oftentimes, this can be the page that visitors find your site by because it ranks well on search, gets shared frequently on social media, or has a lot of referring links to it. It can also be the content that is most visited once people get to your site as they navigate around.”
Using this information, the Resolute has gained some valuable insights from Google Analytics 4 on their most popular page ‘An Example of an IT Strategic Plan’ shares De Vos.
They learned the “visitor intent based on specific search terms that brought them to the page, optimal offer placement for our downloadable PDF content, and engagement by subject matter and related topics.”
“By using Google Analytics 4 paired with Google Search Console, we can see that many visitors are looking for templates, case studies, and other takeaway tools when they are searching IT Strategy-related terms to get to our page,” De Vos adds.
Related: 100+ Experts On How to Use Google Search Console for SEO in 2020
“We also saw that mid-page, in-content forms were performing much better than top bar and corner pop-up offers. By analyzing time on page and the number of related pages our visitors navigated to, we get a sense of what tangential topics visitors who are interested in IT strategies are also interested in.”
Track Your Top Landing Pages in Google Analytics 4 with Databox
Now that you know how Google Analytics 4′ most popular pages can help you refine your content production, strategy, and distribution, make sure you track this data regularly.
But if you find it hard to dive into a spreadsheet-like Google Analytics 4 format to analyze your data, create a Databox dashboard.
The dashboard auto-updates the numbers in real-time so you don’t need to manually go into tracking your key metrics. Plus, it showcases data into a visually appealing format that’s very simple to understand at one glance. You can also easily identify patterns in the data as well as share them with your team.
So what are you waiting for? Sign up for Databox for free and track your top pages today.


![How to Leverage Your Website Analytics to Acquire New Customers? [Research Findings Based on 100+ Companies]](https://cdnwebsite.databox.com/wp-content/uploads/2022/10/10044001/google-analytics-4-metrics-and-dimensions-guide-1000x563.png)


