


Table of contents
If you look back at the previous month in your company, what questions come to your mind?
Something like: did we reach our goals? How much progress did we make? Why weren’t the outcomes as good as we expected? Or what did we do well so our results exceeded our expectations?
When you gather the answers to all these questions in one place, a whole picture of your business starts to emerge and it gets easier to create an action plan for the future.
This whole picture can be obtained via strategic reports. The task of writing such reports can sometimes be tedious and it seems like a never-ending process, but it provides you with valuable insight into your performance – without it, you can’t identify pitfalls and strong points of your strategy.
As reporting becomes more frequent and data volumes grow, many teams are starting to rely on AI data analysts, like Databox MCP, to make sense of performance faster. Instead of manually pulling numbers and interpreting trends, you can ask a simple question, such as why revenue dipped last month or which channel drove the highest conversion rate, and get answers based on your real metrics, definitions, and historical data. Because it uses your actual business context, the explanations are clear enough to support everyday strategic decisions while keeping reporting grounded in facts.
In this article, we’ll tap into the importance of strategic reports, share the best practices and tips for writing them, and introduce some great examples of strategic reports that will inspire you.
- What Is Strategic Reporting?
- What Companies Need a Strategic Report?
- When to Use Strategy Reports?
- What Should a Strategic Report Include?
- How Do You Write a Strategy Report?
- Strategic Reporting Best Practices
- Strategic Report Examples and Templates

What Is Strategic Reporting?
Strategic reporting is a complex process of collecting the data about an organization’s performance and the analysis of this data, typically done by senior management. The purpose of this data analysis is to answer the questions about the company’s performance and progress measured against its goals.
Strategic reports are usually comprehensive and encompass high-level goals and metrics while analyzing the company’s long-term success rather than individual projects. They’re sometimes even shared with the general public (for example, in government agencies).
Many companies use a wide variety of tools and marketing reporting software to create strategic reports, or they consult agencies and individuals who specialize in this area of business.
A typical strategic report includes different types of data, like charts and tables, surveys, reviews, historical data, future projections, etc. All this data contained in a report helps you map out a clear, achievable plan for the future, improve internal communication within your team, optimize processes within your business, and finally, boost your employees’ motivation and productivity so they can reach their full potential at work.
What Companies Need a Strategic Report?
A significant benefit of strategic reporting is that companies can use these reports both for internal and external purposes. We already mentioned government agencies – in their case, strategic reports can be used for public accountability. The same goes for publicly traded companies.
However, internal strategic reports can be even more important for businesses that are looking to become data-driven. They rely heavily on strategic reporting when it comes to business planning because they base all their decisions on the data they collect over time. This can be critical if a company is scaling – without looking back on your strategy and identifying what went well and what didn’t work, you can make further improvements and expect more progress.
A recent Databox’s study about business reporting showed that the majority of companies that reported hitting more than 75% of their goals frequently create comprehensive reports that include various metrics, analyses, results explanations, and next steps and recommendations.
Although some companies use strategic reporting more often than others, it’s still critical for any growing business. Thanks to strategic reports, an organization is able to stay focused on the key drivers of business value and prove its success to upper management or stakeholders when necessary.
When to Use Strategy Reports?
Most businesses choose to create strategic reports monthly, quarterly, or annually. It’s usually unnecessary to create these reports daily or weekly, but you can collect enough data to work with in a month.
Why? Because, when setting your organizational goals, both high-level and low-level, they’re usually long term. Although it’s true that you need to review and update your goals and KPIs from time to time, there needs to be a time period long enough for you to be able to gather and analyze relevant data. When you create a monthly strategic report, you get to see a broader picture of your performance, but you can still dig out the data for a specific day if it’s necessary.
What’s even more important than frequency in strategic reporting is consistency: they’re a valuable source of insight, especially if you’re implementing a new campaign or tactics, and reporting consistently on your results will provide you with the most accurate data.
What Should a Strategic Report Include?
Strategic reports should encompass these key areas: goals, performance, issues, and solutions.
As in any other report, you should define your goals first. Everything else – your strategy, most important metrics, how you define success – depends on what you’re looking to achieve.
After you’ve covered the goals, make sure you analyze your performance based on the data you’ve collected using different marketing reporting software. Depending on who you’re reporting to, you may want to explain your methodology as well – if your report is meant for the general public, remember that they may not be familiar with the terminology you’d typically use.
The key sections of your strategy report are the ones focused on issues and possible solutions. In these sections, you’ll present the issues you may have identified in your strategy implementation process, and suggest potential solutions to these issues.
Like with any report, ensure you include text, data visualization for better readability, and any additional documents like surveys or reviews that can illustrate different sections in your report. A well-structured report will be easier to read and follow, so it’s critical to divide your data into logical sections. Although strategic reports are quite extensive, make sure you keep your focus on the most important KPIs to avoid confusion and getting into too many unnecessary details.
So, with all this in mind, your strategy report should overall include the following:
- Your mission statement
- Your vision statement
- Methodology/tools explained
- Overall company goals
- Your KPIs and most important metrics
- Data visualizations
- Data explanations
- List of issues that need fixing
- Recommendations and possible fixes
- Conclusion/summary
- Additional documents
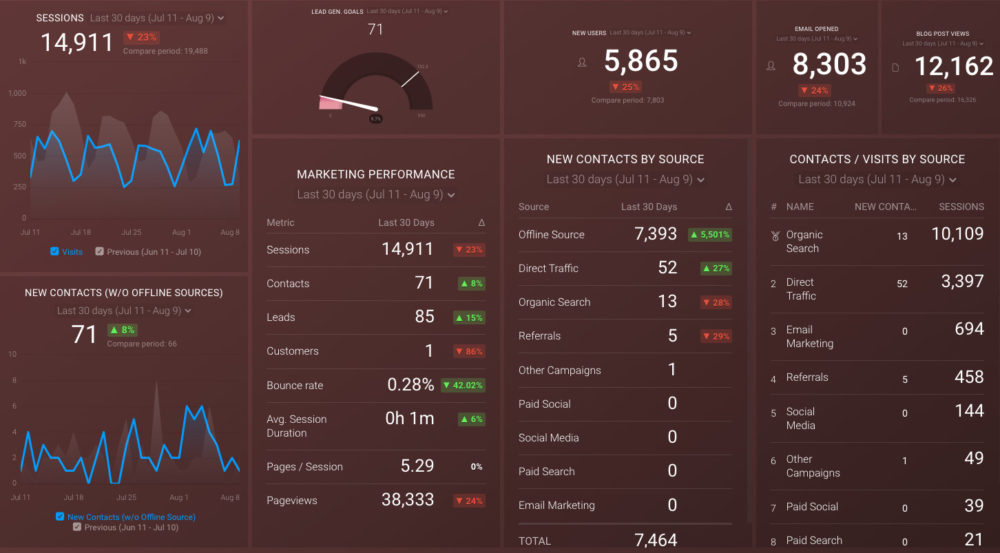
PRO TIP: How Well Are Your Marketing KPIs Performing?
Like most marketers and marketing managers, you want to know how your efforts are translating into results each month. How is your website performing? How well are you converting traffic into leads and customers? Which marketing channels are performing best? How does organic search compare to paid campaigns and to previous months? You might have to scramble to put all of this together in a single report, but now you can have it all at your fingertips in a single Databox dashboard.
Our Monthly Marketing Performance Dashboard includes data from Google Analytics 4 and HubSpot Marketing with key performance metrics like:
- Website sessions, new users, and new leads. Basic engagement data from your website. How much traffic? How many new visitors? How many lead conversions?
- Lead generation vs goal. Did you reach your goal for lead conversion for the month, quarter, or year? If not, by how much did you miss?
- Overall marketing performance. A summary list of the main KPIs for your website: sessions, contacts, leads, customers, bounce rate, avg. session duration, pages/session, and pageviews.
- Email response. Overall, how effective were your email campaigns, measured by email opens?
- Blog post traffic. How much traffic did your blog attract during a certain period?
- New contacts by source. Which sources drove the highest number of new contacts
- Visits and contacts by source. How did your sources compare by both sessions and new contacts in a certain period of time?
Now you can benefit from the experience of our Google Analytics and HubSpot Marketing experts, who have put together a plug-and-play Databox template that contains all the essential metrics for monitoring and analyzing your website traffic and its sources, lead generation, and more. It’s simple to implement and start using as a standalone dashboard or in marketing reports!
You can easily set it up in just a few clicks – no coding required.
To set up the dashboard, follow these 3 simple steps:
Step 1: Get the template
Step 2: Connect your HubSpot and Google Analytics 4 accounts with Databox.
Step 3: Watch your dashboard populate in seconds.
How Do You Write a Strategy Report?
Strategy reports are comprehensive documents, so it’s important to set aside enough time to write them properly. Follow these five steps to ensure you’ve encompassed all the relevant elements of a good strategic report.
- Step 1: Write a Strong Intro
- Step 2: Define Your Goals
- Step 3: Define Your KPIs
- Step 4: Describe Obstacles
- Step 5: Suggest Solutions
Step 1: Write a Strong Intro
In the introductory part of your strategic report, you can state your company’s mission and vision. That will help you keep the idea in mind while analyzing the data and establishing whether you’ve reached your goals and made the progress you’ve anticipated.
Also, you should use this section to explain the purpose of the report, introduce your methodology and tools you used to collect the data and analyze it, as well as any hypothesis you may have had before writing the report.
Step 2: Define Your Goals
As mentioned, defining your goals comes first. You can include both primary and secondary goals, although strategic reporting on a company level usually focuses on high-level and long-term goals before anything else.
Using the SMART technique will help you define your goals with precision and make them specific, time-bound, measurable, etc. Also, you’ll be able to determine your most relevant KPIs more easily later on.
Step 3: Define Your KPIs
Presenting and explaining the data you collected about your KPIs comes after you’ve defined your goals. Divide the data into logical sections and represent it in tables, pie charts, and graphs to make it digestible.
For better insight, compare your current performance to last month’s or last year’s. You can also include a brief analysis of the market and, if applicable, a short comparison to your primary competitors’ performance.
Step 4: Describe Obstacles
Your strategy will probably excel in some areas, while some won’t generate the results you desired. A good strategic report will point out these issues and offer solutions.
This section of the report should highlight the obstacles you encountered while implementing the strategy. For example, you need to find out at what point your sales dropped and why, when your bounce rate increased, or what landing page didn’t manage to convert as much as you expected. This can also have a significant impact on your sales manager goals, and they might require adjusting when there are large drops in certain metrics.
Why did these things occur? Maybe you have a target group that’s too broad or used the wrong marketing channels to promote your content, didn’t assign your secondary KPIs to specific individuals within teams or tracked too many irrelevant metrics, etc. Anything you identify as an issue will help you make improvements in the future and drive better results.
Step 5: Suggest Solutions
When you’ve listed the issues that need fixing, it’s time to move on to solutions.
The final section of your strategic report should include recommendations and suggestions on how your strategy can be improved so the organization can reach more goals faster.
While creating an action plan to solve the problems you identified, make sure this plan is clearly defined and everyone involved is familiar with all the steps and elements: deadlines, project goals, tools, methods, who’s responsible for what, etc.
Strategic Reporting Best Practices
Your business will discover the most efficient way to do strategic reporting and get helpful and valuable data from it. However, there are some universal tips anyone can follow to make their strategic reports even more effective.
Here’s what experts recommend as best practices when it comes to strategic reporting.
- Brainstorm with Your Team to Identify Priorities
- Make a Selection of Your Goals to Define Success Criteria
- Have a Clear Process in Place
- Let Your Report Tell a Story
- Stay Balanced
- Use Templates to Save Time
Brainstorm with Your Team to Identify Priorities
Before writing the report, meet with your team to assess your current high-value goals. In this meeting, you can list all the company’s existing goals and determine whether something has changed since the last time you talked about your objectives. If not, try to rank your goals according to their value for your business.
For example, creating an outstanding customer experience for your audience may have more value to you than raising brand awareness at the moment.
Make a Selection of Your Goals to Define Success Criteria
After you’ve ranked your goals based on their value for the company, you can now pick the top five goals and define how you will know if you’ve been successful at reaching them.
Make sure you’ve chosen goals from all your departments to create a better overall picture of your business.
Have your management and data experts work together for the best possible visualization of your strategy.
Have a Clear Process in Place
To make the most out of strategic reporting, you should have a clear process in place.
Every team member should know what their responsibilities are and what deadlines they need to follow. Assign a goal (or multiple ones) to each individual and inform them of who they need to report to. Explain how often everyone will create reports, structure their dashboards, and track their progress.
Our recommendation is to use a project management tool to keep track of everyone’s tasks in one place.
Let Your Report Tell a Story
A report doesn’t need to be a bunch of numbers and pure facts. Actually, strategic reports are usually more readable and understandable when you use them to tell a story about your business.
There’s something called narrative reporting, and it’s used to do just this: create a meaningful picture around your data and tell a story about how your business is functioning and progressing towards its goals, how it’s positioned in the market, and what its future prospects are.
Regardless of the reader’s background, narrative reports enhanced with data visualization are more convincing and effective than presenting your findings in a disconnected manner.
Stay Balanced
Balance is the answer to many questions regarding strategic reports.
First of all, there isn’t a universal ideal length of a strategic report, especially given that they can be created monthly, quarterly, or annually. The best practice is to only include what matters: define the most important goals and KPIs, identify the key problems in the strategy, and offer a few strong solutions. A straight-to-the-point report is more effective than a 50-page-long report where you easily get lost in too many details.
Balance is also important in your presentations of issues and opportunities. Never hide unsatisfactory results, but don’t forget to highlight the opportunities, campaigns that performed better than expected, etc.
Finally, make sure you balance between presenting the last month’s or quarter’s results and planning for the future. Looking back will help you identify errors and tactics that worked well, but the future is where you’re going to live and run your business or department. Therefore, focus on identifying upcoming trends that you can take advantage of and risks that you can prepare to mitigate.
Use Templates to Save Time
Whether you’re creating strategic reports monthly or quarterly, it can be a daunting process that will certainly take up hours, if not days. But there are ways to automate some parts of this process and save your time and energy every time you need to write a report.
Enter report templates.
Choosing the right reporting tools and using dashboard templates will allow you to devote more time to the actual data analysis and creating strategies on how to improve your results. You will also spend less time completing repetitive tasks and importing data manually into your report.
Strategic Report Examples & Templates
An example illustrates a point better than any explanation. That’s why we prepared this list of strategic report examples and templates to help spark inspiration. Feel free to use them in your strategic reporting.
- Sales Manager KPIs Dashboard
- Marketing KPI Dashboard
- Project Management KPI Dashboard
- Financial Reporting Dashboard
Sales Manager KPIs Dashboard
A sales manager has many sales reports on their plate, but they can easily monitor their team’s activity using this HubSpot KPI Dashboard Template. It includes all the relevant metrics, such as:
- Average deal size
- New deals created amount
- Open (unclosed) deals
- Deals closed won
- Deals closed lost
- Deals closed won amount
This integration helps you answer some important questions about sales processes and determine whether you’re on the right track when it comes to hitting your monthly or quarterly goals. You can see other sales dashboards Databox offers here.

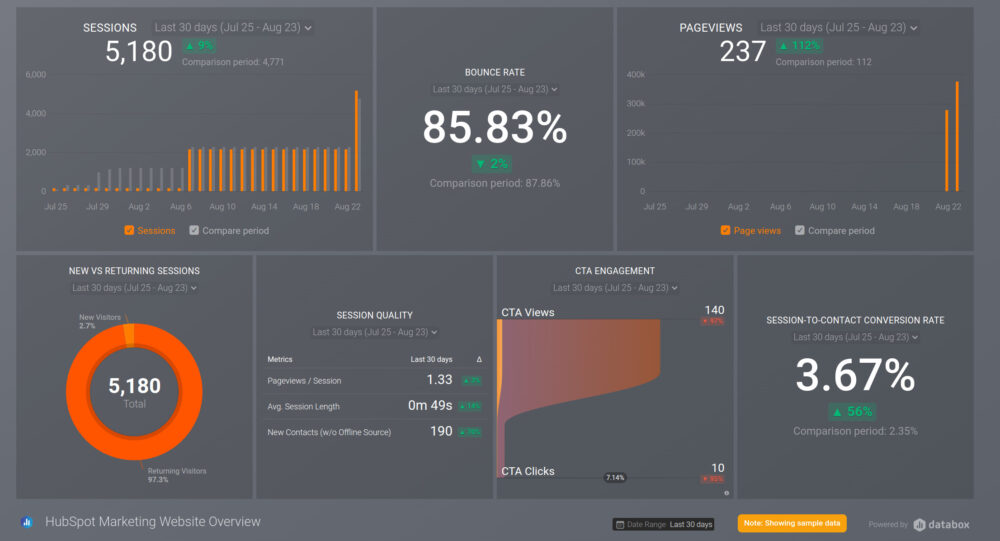
Marketing KPI Dashboard
Monitoring your marketing activities is essential for your business. This HubSpot Marketing Website Overview Dashboard allows you to easily track the following metrics:
- Sessions
- Pageviews
- CTA engagement
- New vs returning sessions
- Session quality
- Bounce rate
- Session-to-contact conversion rate
By using this dashboard, you can find out what sources are the most successful ones when it comes to generating new conversions and if it’s helping you hit your sales goals. Check out all of our marketing dashboard templates here.
Project Management KPI Dashboard
To make sure your projects are on track and reaching their goals, it comes in handy to have a reporting dashboard where you can track completed work, number of issues, resolved issues, etc. That’s exactly what you get with this free Jira Dashboard Template.
The key metrics include:
- Number of issues by status
- Completed work by projects
- Completed work by implementer
- Issues created
- Issues resolved
The different views allow you to track a specific project or people on your team, monitor their performance, and always know who you can assign new tasks or projects. Find more project management dashboards here.

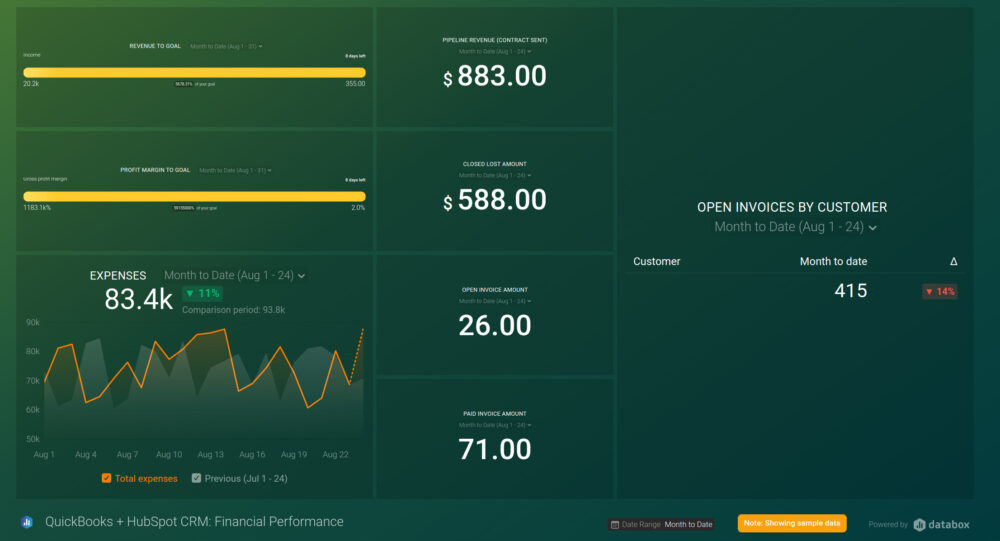
Financial Reporting Dashboard
If you want to monitor your organization’s financial health and stay on top of any issues that may emerge, you will benefit from using this Quickbooks + HubSpot CRM integration. This free QuickBooks + HubSpot CRM: (Financial Performance) Dashboard Template comes with the metrics listed below:
- Open deals amount by stage by pipeline
- Deal amount by stage by create date
- Gross profit margin
- Open invoices amount
- Paid invoices amount
- Open invoices by customer
- And more
With this dashboard, you can effortlessly track how much you’ve got from your paid invoices, keep tabs on your revenue goals for the quarter, monitor your expenses, etc. See more financial dashboard examples here.
Strategize Better with Databox
Your reality at the moment is this: strategic reporting is tedious, it takes too long, and you don’t see how it really helps your team do better.
How it can be: strategic report is an enjoyable process of looking back at what you have achieved, celebrating your wins, and learning from your mistakes. It doesn’t take too long since there are parts of the process you can automate. You can clearly see its purpose and it really helps your team generate better results and become even more motivated to reach your overall organizational goals.
The second scenario sounds dreamlike, right? With a marketing dashboard software like Databox, it can become your reality faster than you think.
We can help you make the most out of strategic reporting by building you a customized dashboard that will include all the relevant metrics you need to create a beautiful, streamlined report.
We know that you’re busy and want to spend your time doing the actual work.
We get that. That’s why we want you to leave the daunting tasks to us. In only 24 hours, we’ll set up an ideal dashboard for you and provide guidance on how to track the right metrics and structure your reporting process.
We guarantee you could never ask for more.
Well, actually, maybe more details about this offer. If that’s your case, reach out today and schedule a call to learn how you can get started.


