


Table of contents
Hello everyone. Welcome to another episode of Data Snacks. My name is Monja, and I’m the product marketer at Databox.
How do you judge the success of your blog posts? Traffic? Sure that’s important, but traffic alone does not mean anything if it is followed by a high Bounce Rate or little to no conversions. After all, we want our blog visitors to convert and/or become paying customers.
So, in this Data Snack, we are going to show you how to:
- Determine which blog posts help drive conversions
- Track the performance of your CTAs
- Get insights into the overall success of your blog
Below, you can view the full episode, or, keep reading for a fully transcribed version of the episode complete with relevant screenshots.
Let’s start!
Let’s Start by Tracking the Right Metrics
We are starting in Databox, and using both Google Analytics and HubSpot Marketing as our data sources.
First, we will navigate to the Databox Designer. Adding metrics is easy. Simply choose the data source from the Metrics Library here on the left and drag-and-drop some of the available pre-built metrics.
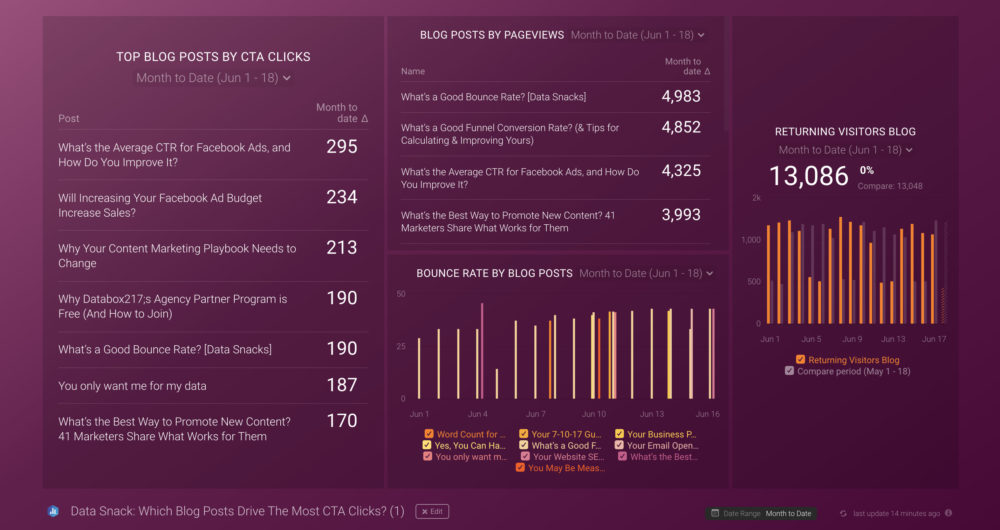
In this case, we will visualize – Top Blog Posts by CTA Clicks, Blog Posts by Pageviews, Returning Visitors by Blog. We will also add a custom metric that you can get with a paid plan, and that is Bounce Rate by Blog Post. By tracking these four metrics, we are able to see how well our blog is performing. CTA clicks bring us closer to conversions and seeing which posts are driving this as well as which CTAs are included in those posts, so we can better understand our visitors’ behavior. Now, when it comes to the combination of page views and bounce rate, the idea is simple. We want to know to which blog posts our visitors come to and stay long enough to perform some action. Finally, by tracking returning visitors, we can see how engaging our content really is and if we are offering content worth a second look.
With Databox, you can choose how you want to visualize your metrics, and I have selected some options here that best illustrate the meaning behind the data we have selected.
Discovering the Meaning Behind The Data
Start with Top Blog Posts by CTA Clicks. We can learn two things here. First, which blog posts are performing best when it comes to call-to-action clicks, and second, which CTAs are the most effective. This can help us shape our content strategy and blog post optimization.
Next, let’s look at Blog Posts by Pageviews and Bounce Rate by Blog Post, both of which play an important role in determining how effective your blog content strategy is. A high Page Views result is definitely a good thing, but not if it comes hand in hand with a high Bounce Rate. With these metrics, we can see if people visiting any blog post are staying long enough to give it a read. Blog posts with high page views and low bounce rates are what we’re looking for.
Finally, let’s address Returning Visitors by Blog. Increasing traffic from returning visitors is essential to building a loyal and engaged audience. Simply put, returning visitors are more likely to generate the conversions you seek.
By tracking just these four metrics, you can easily gain valuable insights into the effectiveness of your blog. You can use this knowledge to ensure that your Page Views stay high, your Bounce Rate low, and that the number of returning visits increases over time. In the end, you can increase the number and quality of conversions from your blog.
So What Have We Learned
Achieving conversions from your blog is often a matter of testing and analysis. But by having the right data available for visualization and using data insights to frame strategy, you can formulate a more reliable, repeatable approach to content marketing.
If you need help tracking and visualizing your Top Blog Posts by CTA Clicks, our Support team can actually help build your first dashboard for free.
Just create your free Databox account and reach out to our team either via chat or email.
See you next time.


