Table of contents
Running a successful YouTube channel takes more than just uploading great videos.
It’s about understanding why some videos resonate and others fall flat—and that’s where YouTube Analytics comes in.
But with so many metrics at your fingertips, the dashboard can feel like a maze.
Trying to decipher which data actually matters and how to use it can easily feel overwhelming, especially if your goal is to make better data-driven decisions that genuinely boost your channel’s success.
This guide cuts through the clutter and shows you exactly how to leverage YouTube Analytics to gain the insights you need.
From key metrics you need to monitor to actionable strategies you can use to refine your content strategy, we’ll walk you through step-by-step so that every video you post performs better than the last.
How to Access YouTube Analytics
Before we get into the specific metrics, let’s first check out the exact process of how you can access your YouTube analytics and review what’s happening.
The best way (and fastest) is to use the YouTube Studio page on either your desktop or mobile app.
How to Access YouTube Analytics via Desktop
To access YouTube’s analytics tool, start by logging into studio.youtube.com. You can also go to YouTube, click your profile icon, and select “YouTube Studio.”
Once you’re in the YouTube Studio dashboard, look for “Analytics” in the left menu and click it. This will bring up your channel’s performance overview.
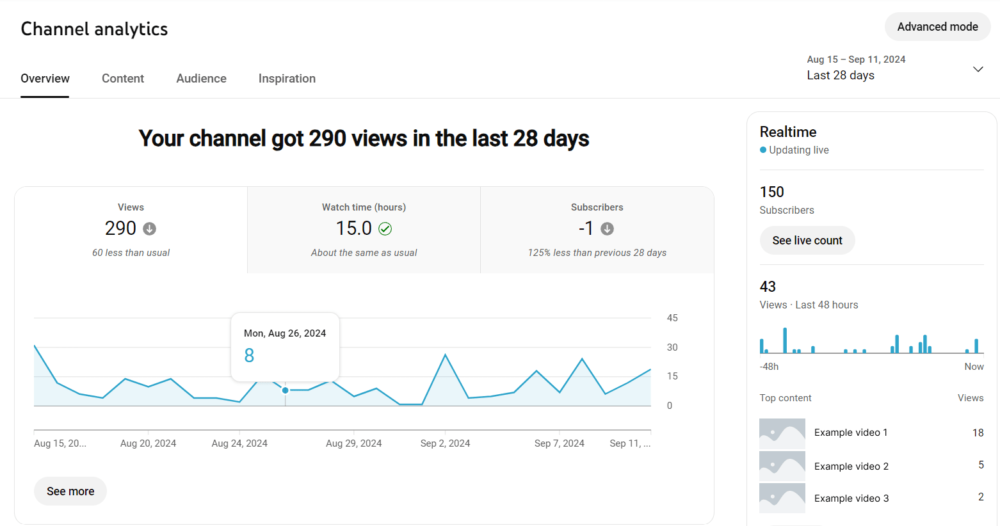
For more specific insights, explore the Content, Audience, and Research tabs. To dive deeper into your analytics, select “See More” for detailed metrics on each area.
How to Access YouTube Analytics via Mobile App
In the YouTube mobile app, tap your profile picture and choose “Your Channel.” Next, pick the graph icon beside “Manage videos.”
For a more complete analytics experience, you can also download the YouTube Studio app, which provides similar metrics as the desktop version.
A prompt to download the app is available at the bottom of the mobile YouTube analytics page.
Key YouTube Metrics to Monitor
To better understand your channel’s performance, you need to know which metrics matter most—and why. Each YouTube metric provides specific insight into how your content is performing.
But how do you know which ones to focus on?
Below, we’ll break down the key metrics every successful channel should pay attention to that drive real results for your content.
1. Watch Time
Watch time is the total amount of time viewers spend watching your videos. It’s a crucial metric in YouTube’s algorithm, as the platform uses watch time to analyze your content quality.
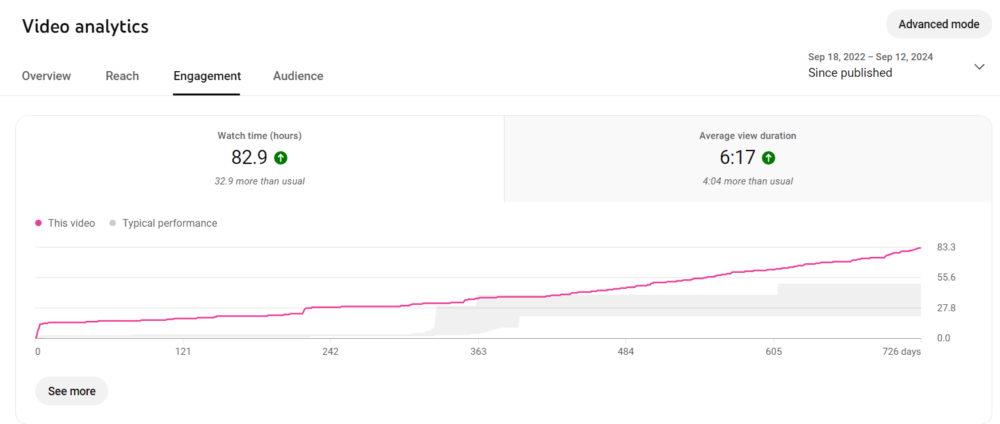
Videos with higher watch time tend to perform better in search results and recommendations because they signal strong engagement, which YouTube rewards by promoting your content to a broader audience.
Here’s what you can do to improve your watch time:
- Hook viewers immediately: Start with something compelling. For example, intros like “what if you could double your savings with one simple change?” grabs attention right away. If you don’t capture attention in the first 5-10 seconds, your watch time will suffer.
- Analyze drop-off points: Use YouTube Analytics to spot where viewers exit, then adjust future videos to address these patterns.
- Deliver consistent value: Keep your content relevant and don’t go off-topic. Avoid long tangents or fillers that might cause viewers to click away.
- Use pattern interrupts: Incorporate visual changes every few seconds—like switching camera angles or adding graphics—to re-engage viewers.
- Tease future content: Mention exciting information coming up later. Say something like, “In just a moment, I’ll reveal the trick that saved me $1,000 last year.” This creates an open loop in their mind and it makes it harder for them to leave without getting the information.
2. Audience Retention
Audience retention measures the percentage of viewers who watch your video from beginning to end. It reflects the percentage of the video that viewers watch and highlights where viewers may drop off.
This metric is displayed in the form of a graph in the YouTube Analytics dashboard, so creators can easily pinpoint sections where viewers remain attentive or lose interest.
Here’s what you can do to improve audience retention:
- Analyze drop-off points: Check your Audience Retention graph in YouTube Analytics to see where viewers drop off. If you notice that many leave at a specific point, revisit that part in future videos.
- Segment content into digestible sections: Break down your video into clearly defined parts that naturally flow from one to the next. Use visual cues, transitions, or brief summaries to guide viewers and prevent them from losing interest mid-way.
- Optimize your video’s structure: Organize your content with a clear beginning, middle, and end. Use chapters or timestamps so your audience knows what to expect next.
- Deliver on promises: Make sure that your video content matches the expectations set by your title and thumbnail. If viewers feel misled, they’re more likely to click away early.
- Work on your pacing and editing: Keep the momentum by cutting out unnecessary fluff. Use engaging visuals, dynamic camera angles, or on-screen text to maintain interest.
3. Engagement Metrics: Likes, Comments, Shares
Engagement metrics—likes, comments, and shares—are direct indicators of how your audience interacts with your content.
These actions show that viewers are not just passively watching but are actively involved, which is a strong signal to YouTube’s algorithm to promote your videos.
Here are some steps that you can take to increase your engagement:
- Encourage viewer interaction: Prompt your audience to take action. For example, ask open-ended questions related to your video’s topic: “What’s your favorite technique for staying productive? Share your tips in the comments!”
- Respond to comments: Take the time to reply to comments on your videos. When viewers see that you value their input, they’re more likely to continue engaging.
- Use a call-to-action for likes and shares: Rather than a generic “like and share” request, explain why sharing or liking supports your channel, or how it helps other viewers find useful content.
- Incorporate end screens and subscribe prompts: Use end screens to guide viewers to related videos and include a gentle reminder to subscribe if they enjoy your content.
4. Subscriber Growth
Subscriber growth represents the increase in the number of people who follow your channel over a specific time period.
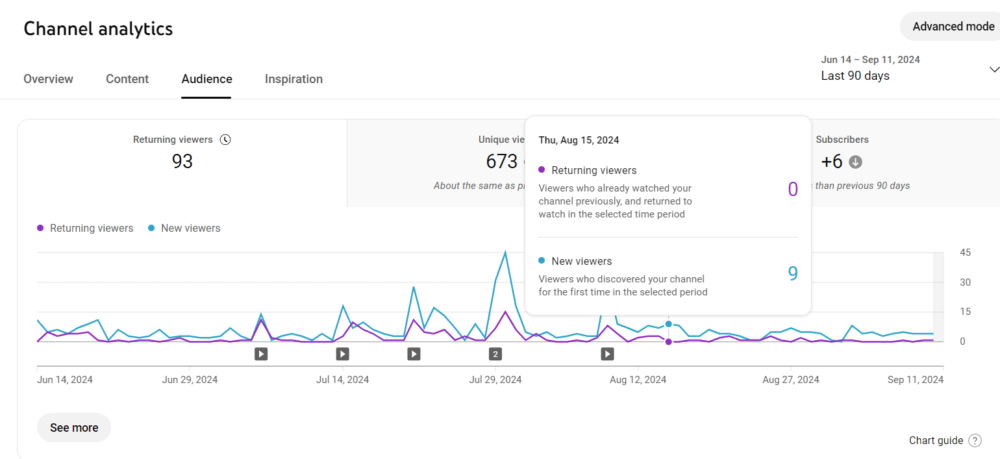
A rising subscriber count means that your content is consistently delivering value and successfully prompting viewers to ‘opt in’ for more.
Here’s how you can accelerate your subscriber growth:
- Create consistent, high-quality content: This one may seem obvious, but make sure you regularly upload videos that meet or exceed your audience’s expectations.
- Use personalized calls-to-action: Instead of a generic “please subscribe,” craft a more personalized CTA that’s in line with the video’s topic. For instance, “Subscribe for more marketing tips every week” gives viewers a clear reason to subscribe and sets expectations for future content.
- Analyze subscription sources in YouTube Analytics: Review where new subscribers are coming from—whether through specific videos, playlists, or external sources. Then, double down on what’s working.
- Offer exclusive content: Provide subscribers with perks like behind-the-scenes footage, early access to videos, or special giveaways.
- Collaborate with other creators: Partner with channels that have a similar audience. Collaborative videos can introduce your content to new viewers who are likely to subscribe if they enjoy what they see.
5. Click-Through Rate (CTR)
Click-through rate (CTR) measures the percentage of viewers who click on your video after seeing its impression—essentially, how often your video draws someone to watch it.
It’s one of the earliest indicators of a video’s success because it shows how well your video captures attention before it even begins.
Here are some ways you can boost your YouTube CTR:
- Craft compelling thumbnails: Your thumbnail is the first visual cue that can attract a viewer’s attention. Use high-quality images, bold text, and vivid colors that stand out.
- Write intriguing titles: Your title should be clear, concise, and engaging. Use relevant keywords to improve searchability. Instead of a generic title like “Cooking Pasta,” try something more intriguing like “5 Pasta Hacks Italians Don’t Want You to Know.”
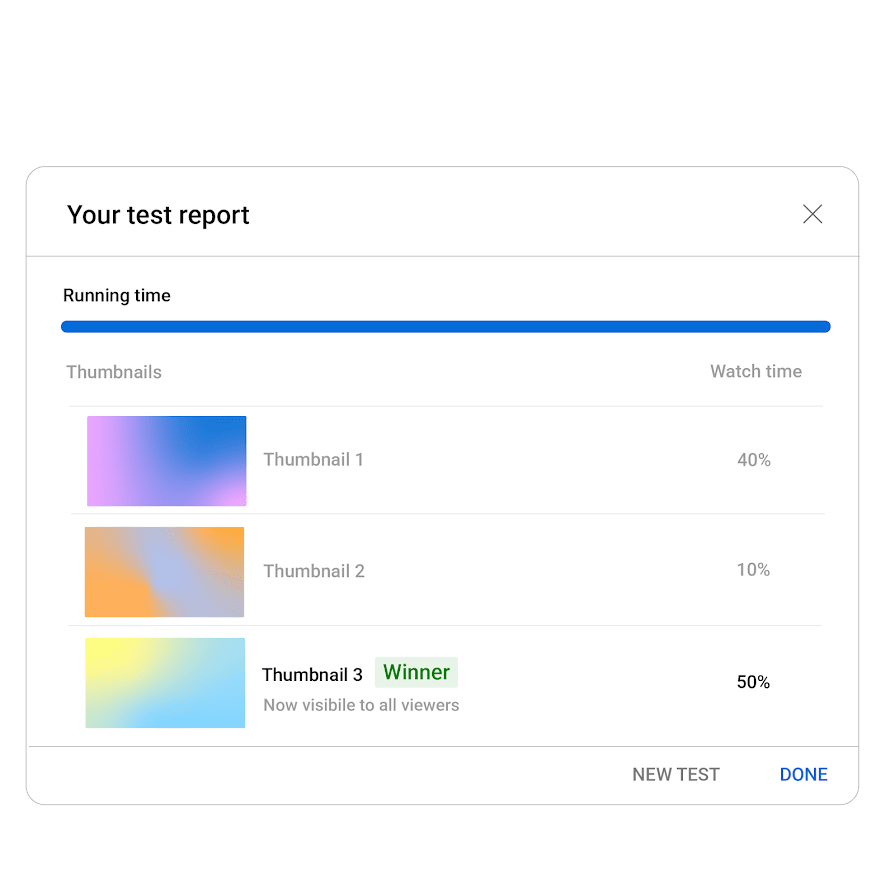
- Test different variations: Use A/B testing to experiment with different thumbnails and titles. YouTube’s Creator Studio offers features to help with this. Monitor which versions get higher CTRs and apply those patterns to future videos.
- Avoid clickbait titles: Make sure that your thumbnail and title accurately represent your video’s content. Misleading viewers may increase initial clicks, but it can harm audience retention in the long run.
- Check traffic sources for CTR insights: Look at CTR by traffic source (search, suggested, browse features) in YouTube Analytics. This data helps you understand how your thumbnails and titles perform across different viewer contexts,
6. Traffic Sources
Traffic sources reveal how viewers discover your videos—whether it’s through YouTube search, suggested videos, external websites, social media platforms, or direct links.
Understanding these sources helps you identify which channels are best at driving the audience to your content.
Here’s how you can use traffic source data:
- Optimize for YouTube search: If a significant portion of your traffic comes from YouTube search, focus on SEO within YouTube. Use relevant keywords in your titles, descriptions, and tags.
- Maximize suggested video reach: Another way to get viewers is through YouTube’s “Suggested Video” algorithm. Use similar keywords and topics to increase the chances of your videos appearing in the “Up Next” section.
- Promote on external platforms: Share your videos on platforms like Facebook, Twitter, Instagram, or relevant forums. Customize your messaging for each platform—for example, use eye-catching images on Instagram or engaging snippets on Twitter.
- Collaborate with other creators: You can partner with influencers, bloggers, or websites that can feature your content. Guest appearances, interviews, or collaborative projects can also introduce your channel to new audiences.
- Track trends over time: Use the ‘Traffic Sources’ report in YouTube Analytics to observe changes. A spike in traffic from a particular source might indicate a successful campaign or viral content.
7. Playback Locations and Device Usage
Playback locations and device usage metrics show where your videos are being watched—whether on YouTube’s website, embedded in external sites, or through mobile apps—and on which devices, such as desktops, smartphones, tablets, or smart TVs.
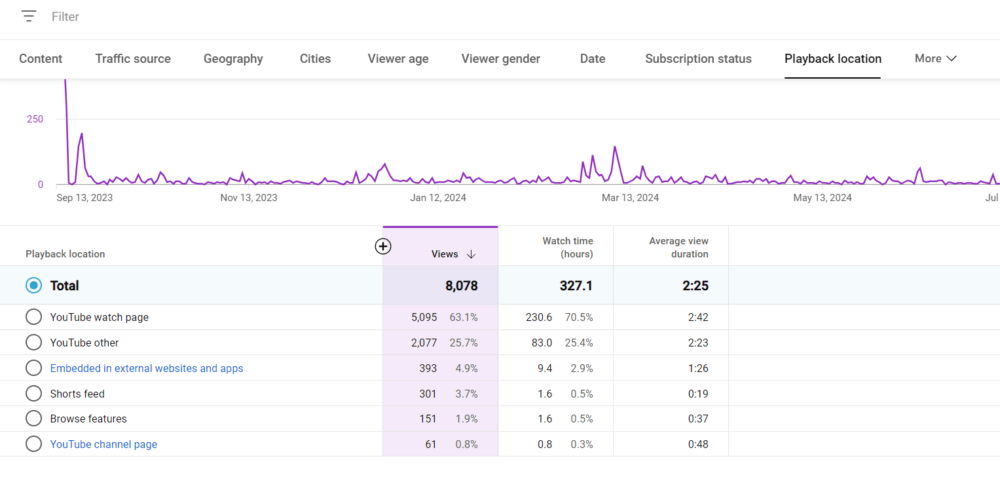
Here’s how you can optimize your content based on playback locations and device usage:
- Design for mobile app: If a large portion of your audience watches on smartphones, make sure your videos are mobile-friendly. Use clear visuals and larger text that’s easy to read on smaller screens.
- Adjust video length: Mobile viewers often prefer shorter, concise videos due to time constraints or data limitations. If your device usage data shows high mobile traffic, create more bite-sized content.
- Adjust for TV and desktop viewing: If your audience primarily watches on larger screens, you can include more detailed visuals and on-screen text. High-resolution graphics and intricate animations usually perform better on these devices.
- Optimize for external embedding: Introduce your topic clearly without relying on video descriptions or external links that might not be visible outside YouTube.
- Add subtitles and closed captions: Subtitles are a must-have in 2024. Large number of viewers on YT watch without sound, especially if you’re primarily creating short-form content.
- Optimize thumbnails and titles for all devices: Make sure that your thumbnails are clear and attractive even when scaled down on smaller screens. Keep titles short and sweet so they don’t get cut off on mobile displays.
Analyzing playback and device usage data might seem like an overkill at first, but you’ll be surprised at how much it can improve your retention and engagement rates.
8. Demographics
Demographics give you a window into who your viewers really are—their age, gender, location, and even the languages they speak.
When you have this information, you can customize your content to match their specific interests and create videos that could go viral.
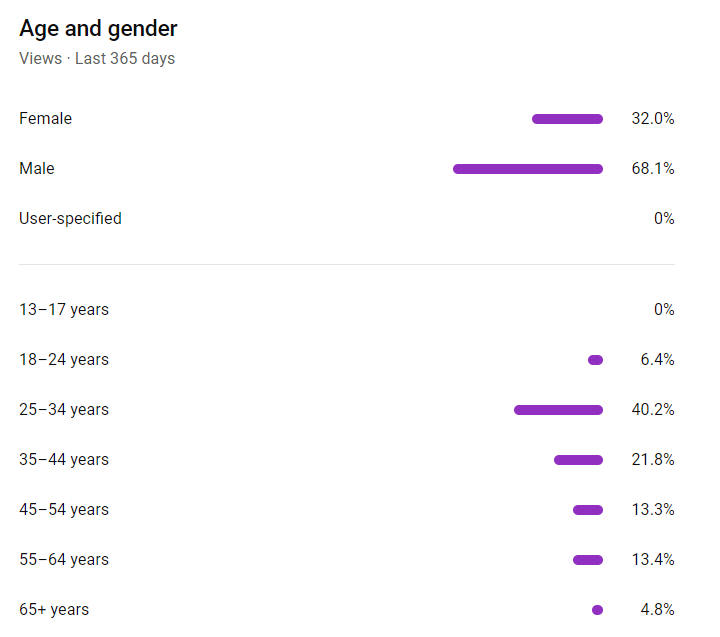
Here’s how you can use demographic data to your advantage:
- Get to know your audience’s age group: Are most of your viewers teenagers, young adults, or maybe middle-aged? If you find that your audience is mostly between 18-24 years old, you might build videos around trending topics, memes, or slang that resonate with younger viewers.
- Consider cultural references and language: Tailor your language, references, and humor to suit the cultural background of your main viewer locations. Avoid region-specific slang unless it’s relevant to your target demographic
- Create multilingual content if applicable: If a significant portion of your audience speaks a different language, consider adding subtitles or even producing videos in multiple languages to broaden accessibility
- Adjust your posting schedule: Align your video releases with your audience’s time zones. If most of your viewers are in the UK, posting during their peak hours increases the chances they’ll watch your video soon after it’s published.
9. Analyzing Video Performance
Ever wonder why some of your videos take off while others seem to fall flat? Analyzing the performance of each video can give you those answers.
Once you dig into the specifics, you’ll see what’s clicking with your audience and what might need some adjusting.
Here are the most important video performance metrics that you should keep track of:
- Identify your top performers: Look at which videos have the highest views, watch time, and engagement. Ask yourself what is different with these videos. Is it the topic, format, length, or presentation style?
- Review engagement metrics: Pay attention to likes, comments, and shares on individual videos. High engagement means the content resonates with your audience. If a particular topic sparks a lot of discussion, consider creating follow-up videos on that subject.
- Analyze click-through rates (CTR): A low CTR might suggest your thumbnail or title isn’t compelling enough. Experiment with different thumbnail designs or more intriguing titles to see if your CTR improves. For instance, adding bold text or brighter colors to your thumbnail might attract more clicks.
- Listen to viewer feedback: Comments contain valuable insights. Viewers might suggest topics they’d like to see or offer constructive criticism. For example, if multiple comments mention that your audio was hard to hear, you’ll know to address this in your next video.
Utilizing Third-Party Tools for Enhanced Insights
While YouTube Analytics offers a ton of insight, many creators turn to third-party tools to make more sense out of their raw data.
For example, apps like Hootsuite, VidIQ, and SocialBlade all have advanced features that provide more than just basic analytics—think SEO optimization, competitor tracking, and multi-platform management.
However, if you want to make the most out of your data and properly keep track of what’s happening in an easy-to-use interface, then Databox might be the perfect fit.
With Databox, you can:
- Customizable YouTube Analytics Dashboards: With Databox’s YouTube Dashboard Gallery, you can build personalized dashboards that consolidate your key YouTube metrics—such as average view duration, engagement rate, subscriber growth, and top-performing videos—into one visual display. This means you’ll always have a quick, comprehensive view of your channel’s health, without having to switch between multiple tabs or screens.
- Set and track goals: Databox allows you to set specific growth goals (like hitting a certain subscriber count, view milestones, or engagement rates) and then track your progress in real-time. By visualizing these goals alongside current performance metrics, you can quickly assess how well your content strategy is working and make adjustments based on data.
- Automated YouTube performance reports: With Report Software, you can schedule custom reports to be automatically sent to your team or stakeholders, summarizing the latest insights on views, audience retention, and more. These reports can be set up daily, weekly, or monthly, ensuring everyone stays informed without the need to manually gather data.
- Access to real-time industry benchmarks: Databox’s Benchmark Software allows you to compare your YouTube channel’s performance against industry benchmarks across similar companies or content creators. By comparing metrics like average watch time, engagement rates, or subscriber growth, you can gauge how well your channel is performing relative to others in your niche and spot areas for improvement.
If you’re like most other creators and are tired of sifting through mountains of data in YouTube’s unintuitive analytics dashboards, Databox could be the ideal solution.
For example, let’s say that you want to quickly analyze how much time your audience spends on your content.
You can easily do that with Databox’s pre-built Watch Time Dashboard template.
You can easily connect your YouTube data with one click, and the platform will automatically pull in your data and fill in the dashboard. Once your data is synced, you can start exploring your watch time metrics in detail.
The dashboard displays key insights like total watch time, average view duration, and watch time by individual video.
But that’s not all. With Databox, you can track trends over time by monitoring how your watch time changes daily, weekly, or monthly. This helps you understand the impact of your content releases and promotional efforts, so you can adjust your strategy accordingly.
Plus, with real-time data monitoring, you’re always up-to-date and can react quickly to any spikes or drops in viewership.
This is just one dashboard example from our YouTube Dashboard Library.
Conclusion: The Path to YouTube Success
Mastering YouTube Analytics is more than just crunching numbers—it’s about finding out what your audience really wants to watch and connecting with them on a deeper level with your content.
So, how can you make sure your analytics approach is as efficient as it could be?
With Databox’s powerful analytics dashboards, you can finally track, visualize, and fine-tune your most essential YouTube metrics, all in one place.
With seamless integrations, real-time updates, and visual insights, you’ll quickly see where your videos are making an impact and where adjustments could help you reach a broader audience.
Even better, you can benchmark your results against other creators in similar niches, giving you a clear view of what’s working across the board and where you can go further.
Whether you’re tracking audience retention, engagement, or overall channel growth, Databox takes the guesswork out of success.
And the best part? You don’t need to be a data scientist to make sense of it all.
Sign up for a free trial today and see how easy growing your channel can be with the right partner by your side.


