Table of contents
Hello everyone. Welcome to another episode of Data Snacks. I’m Monja, a product marketer here at Databox.
Today, we’re going to talk about building a business performance dashboard that most SaaS executives want to see. But what are the most commonly asked for KPIs that these software company leaders demand in their dashboards?
Well, let’s start with a bunch of acronyms that seem to capture their interest on a daily, weekly, monthly, quarterly, and annual basis, including:
MRR, or Monthly Recurring Revenue and ARR, or Annual Recurring Revenue
Then there’s LTV, or Customer Lifetime Value, and CAC, or Customer Acquisition Cost, and their ratio, LTV over CAC.
Next, there’s Net Retained Revenue, or NRR, which is the amount of revenue left after churn is subtracted.
After that, executives like to see ARPC, which is the Average Revenue Per Customer, or its cousin, ARPU, which is the Average Revenue Per User.
With this information, SaaS executives can quickly assess where they are relative to goals they have set in quarterly business reviews and their annual plans.
In this episode of Data Snacks, I’m going to show you how to:
Visualize a variety of SaaS metrics, including MRR, ARR, LTV over CAC, NRR, ARPC, and the growth of revenues compared to goals.
Below, you can view the full episode or keep reading for a fully transcribed version of the episode, complete with relevant screenshots.
Let’s get into it.
Time to Build a Board
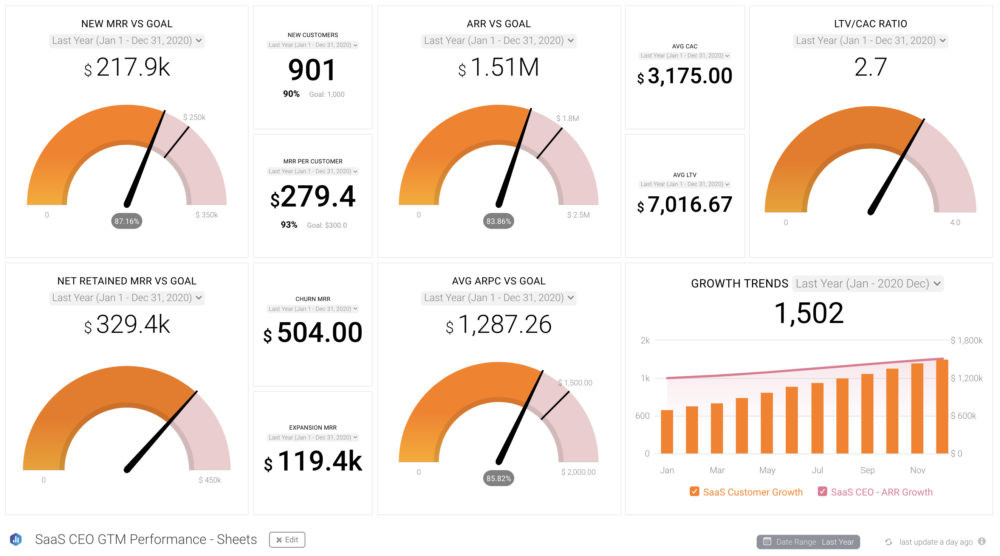
Here’s what I want to see––I want to track MRR and ARR vs. Goals we have set for these KPIs. I want to look at total customers and MRR per customer too. I also want to see the average LTV and CAC and calculate the ratio of LTV to CAC and compare that to our goal. Then, Net Retained Revenue, total Churn and Expansion MRR, Average ARPC relative to Goal, and a chart showing revenue growth compared to our goals.
We’re going to pull this data from a Google Sheet that our executives use to pull data from different financial sources and calculate the KPIs they want to keep track of.
From the Databox Designer, I’m going to the Metrics Library and selecting Google Sheets as the data source, then select the Google Sheet I want to use, which in this case is called Saas CEO Summary.
It’s smart to draw a sketch or at least create a list of the order and position you want to see these metrics on your final dashboard. That makes it easy to plan and drag and drop the appropriate metrics onto your data board and do any final tweaking to make your dashboard design balanced and easy to read.
I drag and drop my metrics onto the board and make sure they are set to the date range I want to assess, in this case, we’re looking at last year. Make sure your date range corresponds with the data you have in your Google Sheet, or your metrics may not be consistent and accurate. Setting Custom Date Ranges for Google Sheets is an option that’s coming soon to Databox!
Now I can quickly assess how my SaaS company is performing, make any adjustments needed, and set new goals for upcoming quarters. This dashboard is helpful in keeping everyone aware of our goals and where we might be falling behind.
You can browse more SaaS dashboards here.
You Don’t Have to Build This SaaS C-Suite Dashboard Alone
Want help creating this report? Start a chat with one of our dashboard experts and they’ll help build this report for you for free.
Just create your free Databox account and reach out to our team either via chat or email.
See you next time.