Table of contents
What are your 10 most-important KPIs?
Here at Databox, we have what we call our “Company Top 10”, which are the 10 most-important KPIs that we look to influence every day, week, and month.
They’re what we set goals around.
They’re what we update our teams on during weekly meetings.
In short, these 10 KPIs, and our progress toward the goals we attach to them, act as a north star across marketing, sales, customer success, product, and engineering.
Everyone knows what’s important, what’s prioritized, and most importantly, what the goals are based on our collective alignment around these 10 metrics.
Traditionally, however, most people within a company or team need to go and find the updates they need. When that happens, you’re much more likely to be reactive to the data rather than proactive.
A big part of our mission at Databox is to enable you to proactively influence your business performance.
To do that, your KPIs need to work for you.
Based on what we’ve been learning from users, as well as our own experience, we’ve made some updates to the Scorecard feature in Databox that will allow you and your team to receive personalized updates based on the metrics you’ve identified as important.
Imagine starting your day with a cup of coffee and an automated message showing how your most important KPIs are performing.
No digging. No having to log in to any apps. Just the insights you need to stay on target.
With Scorecards, your data is delivered to you, so you can quickly get on with your day with the right information already in hand.
What’s a Scorecard?
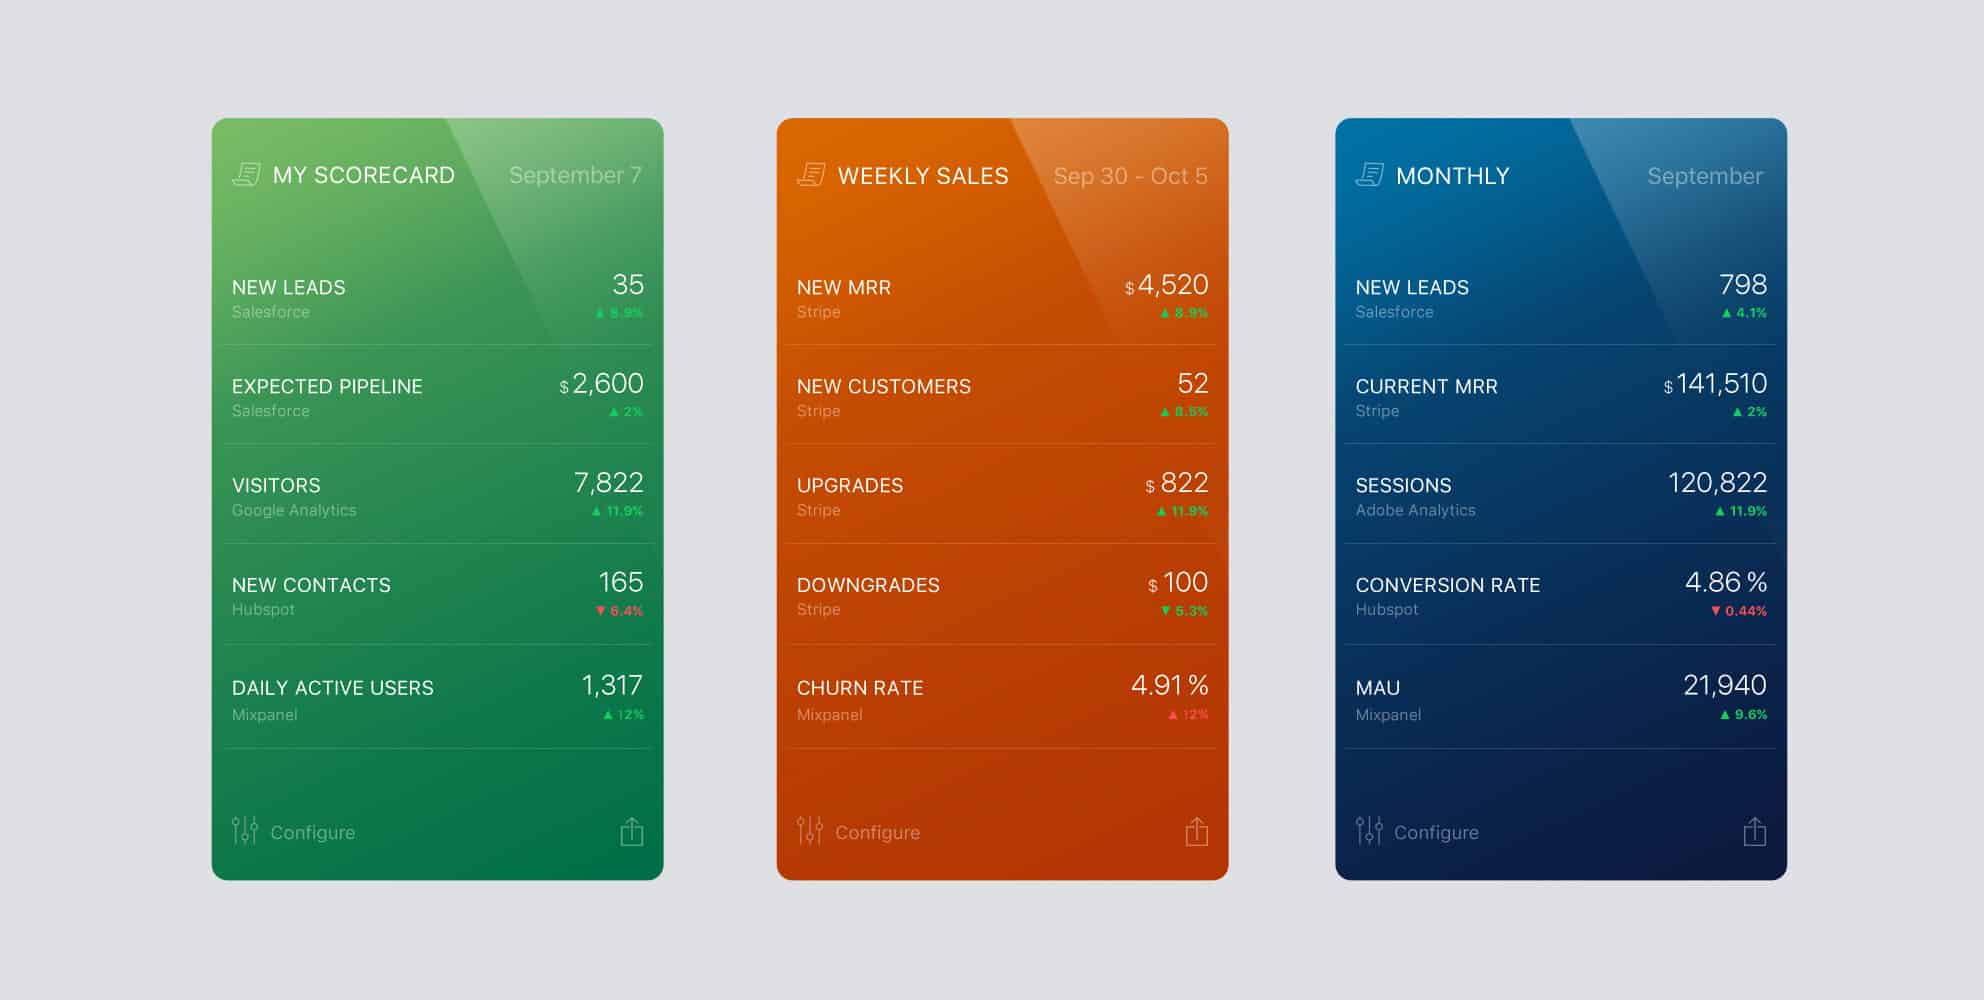
A Scorecard is an automated report comprised of up to 10 of your most important metrics, delivered to you by email, push notification on mobile, and/or Slack every day, week, or month.
As mentioned, we’ve made some pretty big updates that allow you and your team to take a more proactive approach to improving the business KPIs that matter most.
The easiest way to track your most important business KPIs
‘Daily Scorecard’ and ‘Weekly Summary’ have been merged into “Scorecard”
Up until now, the Daily Scorecard and Weekly Summary were separate features that allowed users to stay up-to-date with their most important business metrics.
Now, we’ve simplified things and have merged these two separate features into Scorecard in order to offer you more flexibility. Now you can set your Scorecard to be delivered Daily, Weekly, or Monthly.
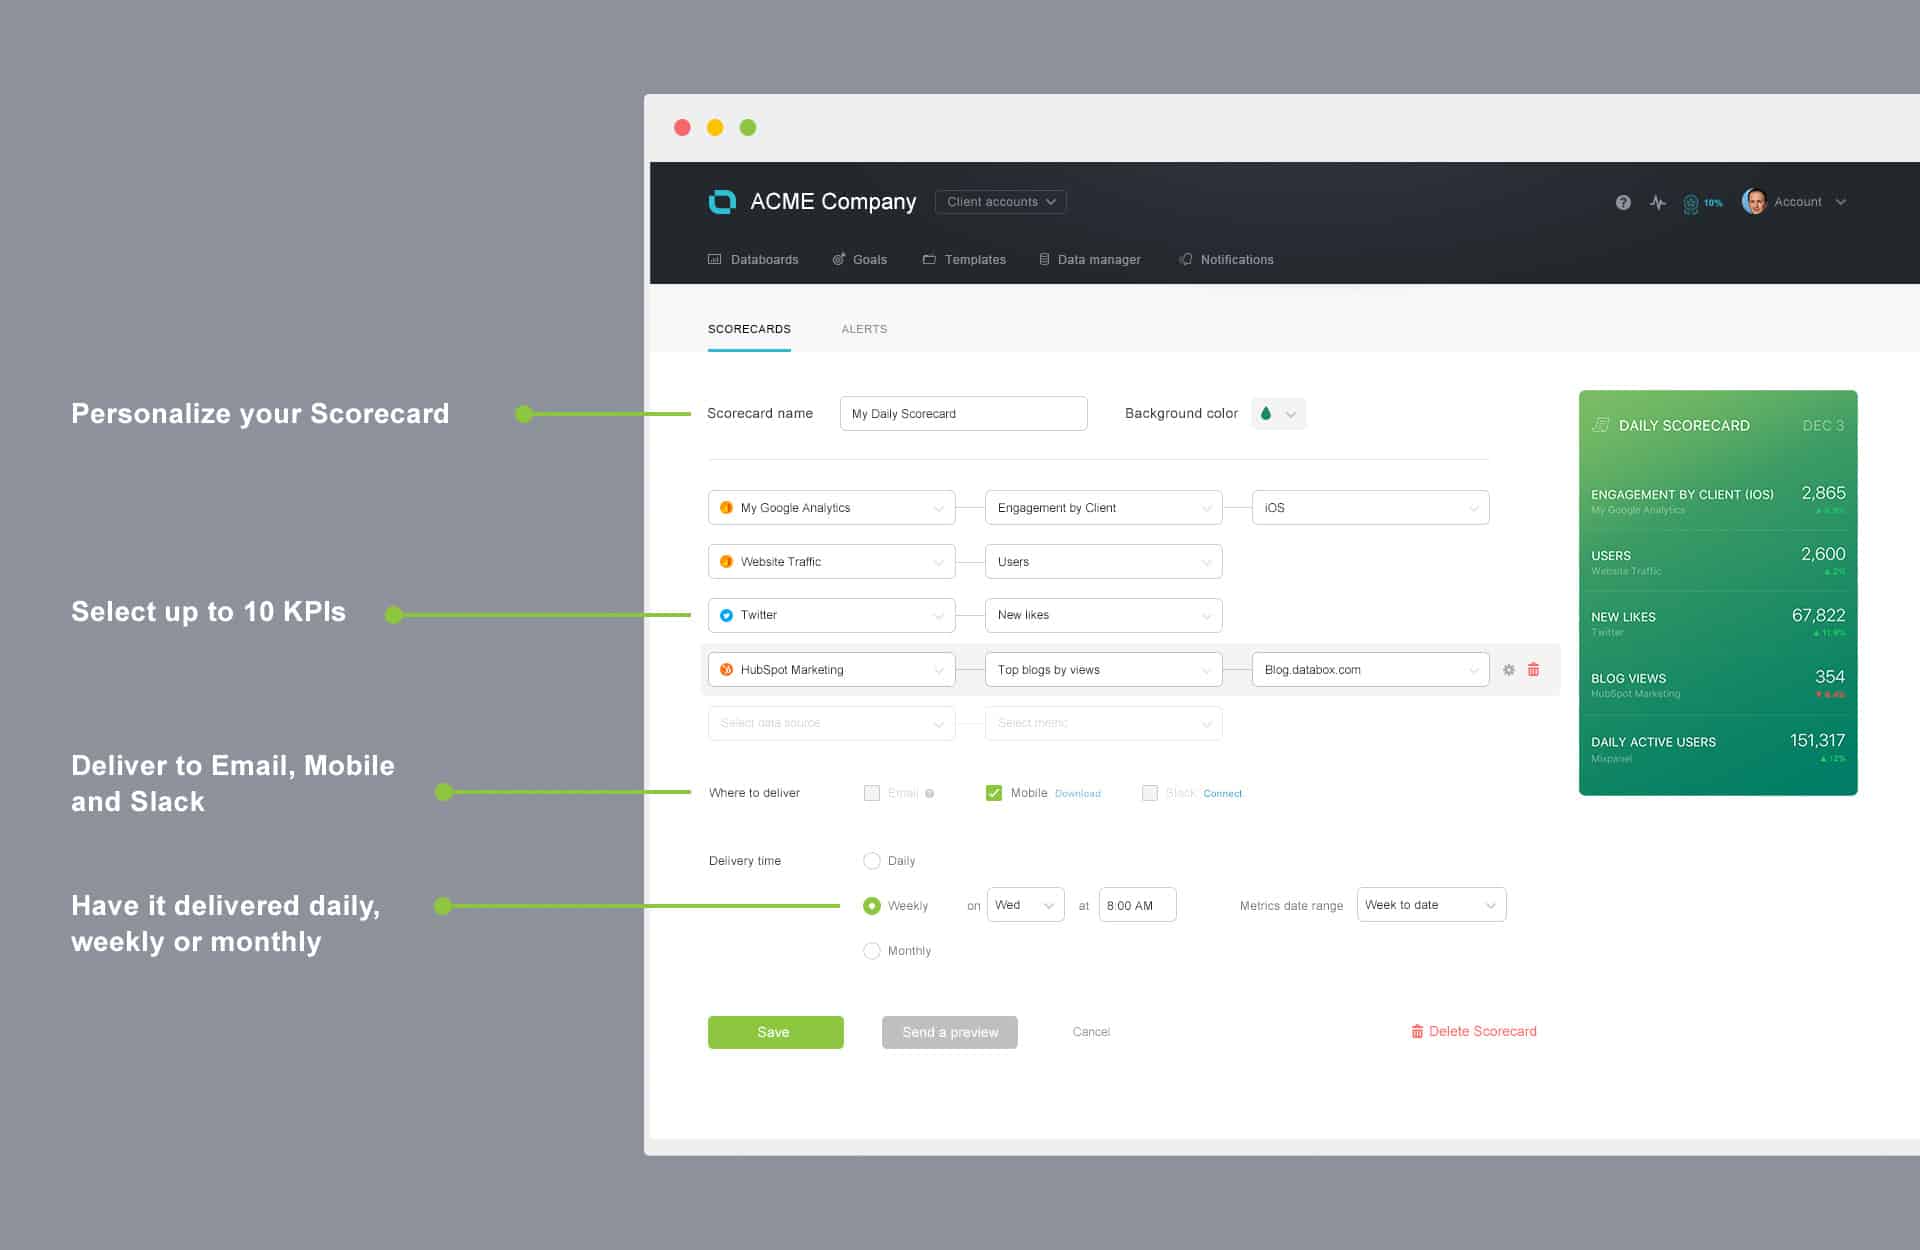
Choose up to 10 KPIs
Previously, you were able to choose up to five KPIs to include in your Scorecard. With this update, you can now include up to 10 KPIs, allowing you to cover a wider range of metrics, thus making your Scorecard more relevant to the various teams at your company.
Create as many Scorecards as you need

From talking with users, we’ve learned that there are a number of use cases where having multiple Scorecards is a huge benefit.
Some metrics require daily updates. Others make more sense weekly or even monthly.
We also spoke with users that wanted separate Scorecards for Marketing, Sales, Customer Success, etc., each with different frequencies depending on the team.
Starting now, we’ve added the ability for you to create as many Scorecards as you need. You can name each one accordingly and even choose different colors to fully brand each Scorecard.
More new Scorecard features

Choose daily, weekly, or monthly frequencies
As mentioned above, now you can choose the delivery interval for each Scorecard as daily, weekly, or monthly.
For the daily option, you can choose the time of day you’d like your Scorecard delivered.
For weekly you can choose the specific day of the week and time of day, and for monthly, the specific day of the month and time of day.
Select your desired date range for any Scorecard
Before, the hardcoded date range for the Daily Scorecard was ‘Yesterday’, and for the Weekly Summary it was ‘Last 7 days’.
Now, you can select the desired date range for any Scorecard.
For example, you can have a daily Scorecard tracking your KPIs by ‘Month to Date’, or have a weekly Scorecard tracking your KPIs by ‘Last week’.
Deliver via email, mobile, and/or Slack
Historically, Scorecard was meant to be a mobile-only feature. The email was designed to be as a fall-back if you hadn’t checked your mobile phone for more than 30 minutes.
As users wanted more control over this, we updated the functionality so that your Scorecard can now be delivered via Email, Mobile, and/or Slack.
Advanced settings
Each Scorecard item can be tweaked through the advanced popup.
By clicking the gear icon next to each KPI in your Scorecard, you can change the compare interval and function (compare to the same period last year, show absolute change, etc.), format, rename the item, and more.
Create your next Scorecard
New to Databox? Create your first Scorecard and get updates on your most important business KPIs when you want them most.
Are you an existing user? We’d love to hear what you think about these new and updated features.


