![Here’s How We Track & Improve Our Website Conversion Rate [Data Snacks]](https://cdnwebsite.databox.com/wp-content/uploads/2018/03/29141704/datasnacks_video_opener.jpg "Here’s How We Track & Improve Our Website Conversion Rate [Data Snacks]")
Table of contents
How do I improve my website conversion rate?
What’s the best way to track it?
What’s considered a good website conversion rate?
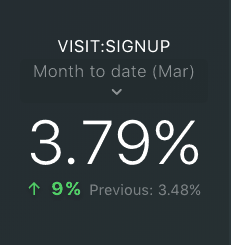
At Databox, our marketing team uses conversion rates like visit-to-signup, as well as signup-to-paid, as our “north star metric”–metrics that provide clarity (and therefore, direction) into all areas of the marketing funnel.
I was recently asked what my desert island metric would be and wanted to share my response, and details for how I track it and approach improving it, on this episode of Data Snacks.
Note: Want the template used in this episode? You can grab it for free right here, courtesy of our friends over at Pepperland Marketing.
How to track and improve your website conversion rate
Audio transcription
I was on a webinar this morning when I was asked about a desert island metric, which I thought was a really interesting question.
The question was, “what would be your desert island metric if you could only measure one thing?” It got me thinking and I wanted to share my thoughts here as well.
To illustrate my point, I went looking around for a template in the Databox template directory and found what might be one of the tightest templates in terms of tracking your overall website health from Pepperland Marketing, one of Databox’s agency partners.
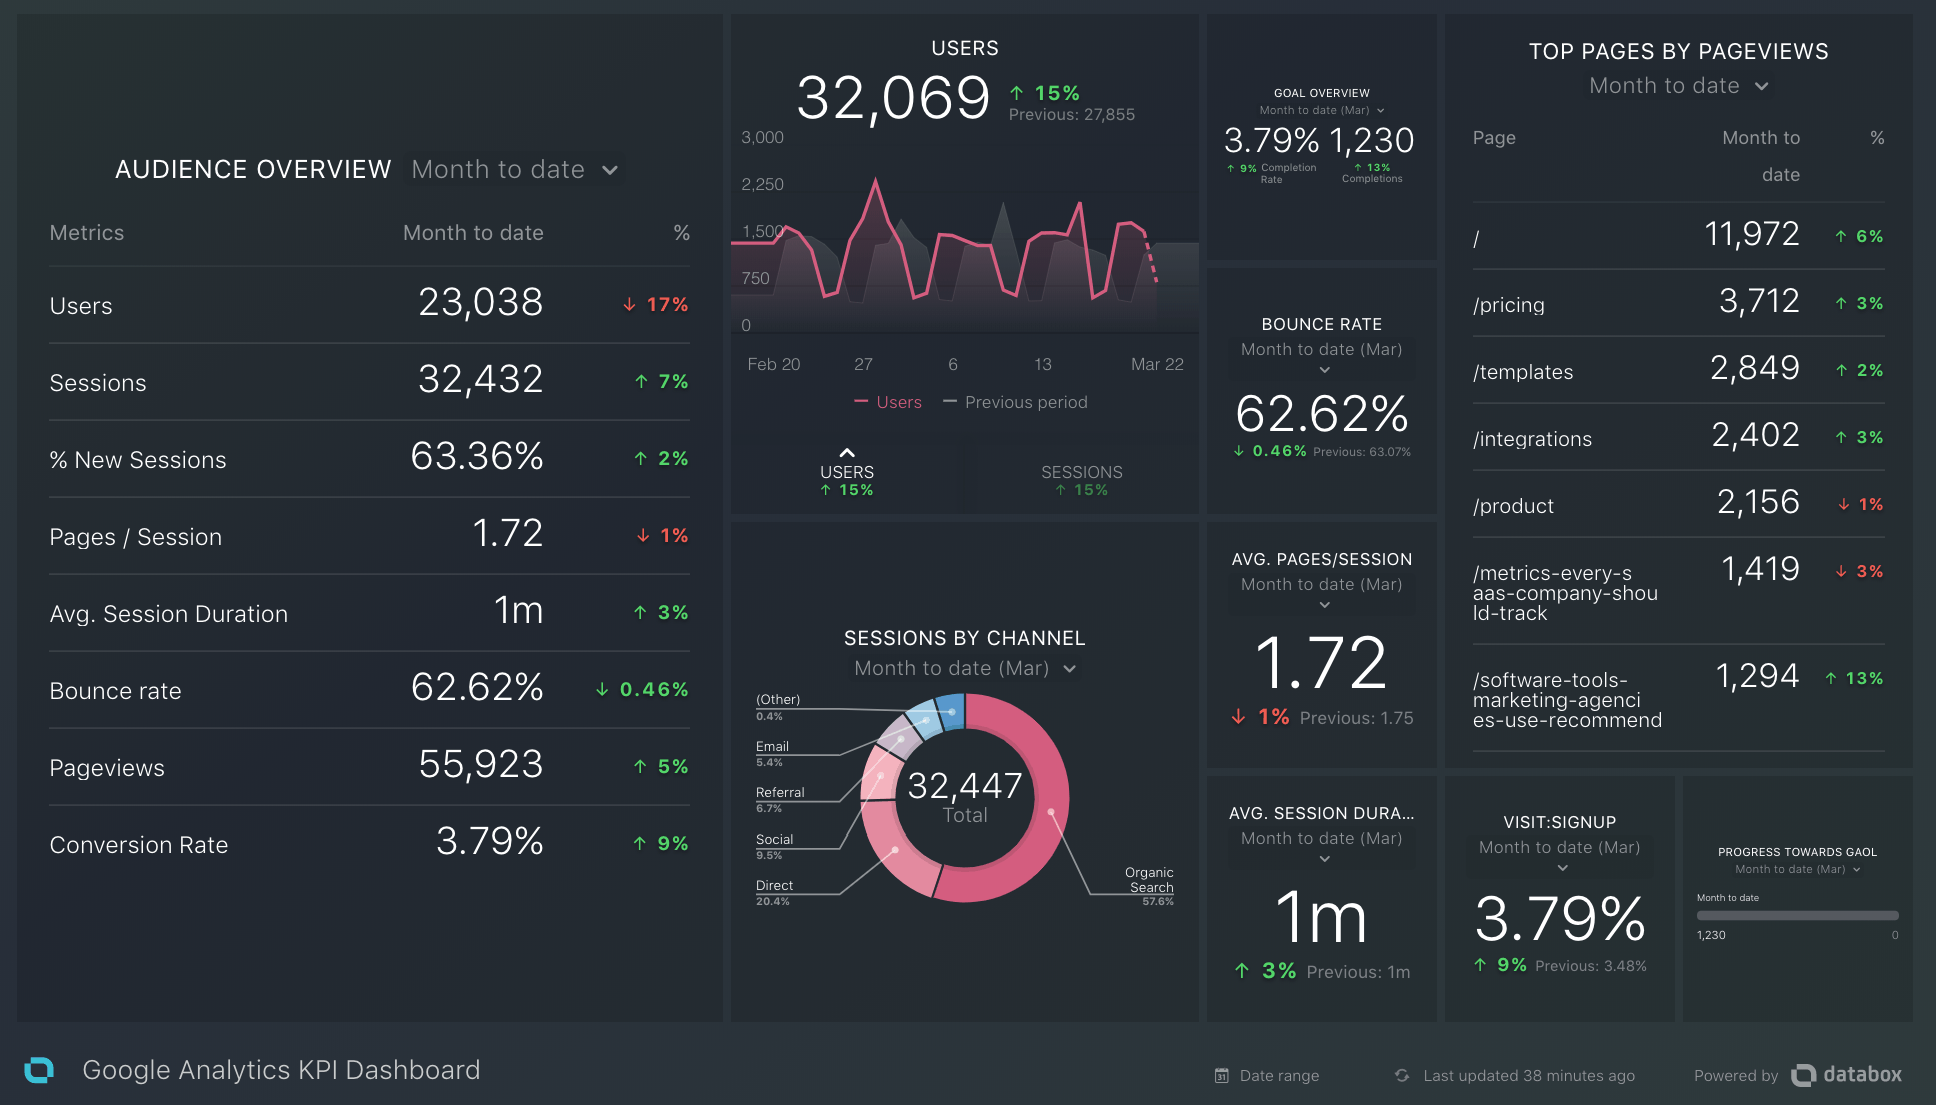
They put together this great template which covers a bunch of essential metrics, but I want to zero in on website conversion rate, or in our case at Databox, visit-to-signup rate.
While looking at KPIs in terms of the whole, absolute numbers (total sessions, new signups, etc.) is certainly helpful, I use percentages like visit-to-signup and/or signup-to-paid as a “north star metric” that allows me to gauge how several areas of the funnel are performing.
Visit-to-signup, in this case, allows me to gauge the effectiveness of several key areas of the funnel all at once.
The effectiveness of the landing page where people are signing up, the calls-to-action that drive people there, the amount of traffic that we’re doing to the website in general–all of these things have a direct influence on our website conversion rate.
If any of these areas are lagging, that’s going to affect our number, and most importantly, provide me with a few focus areas to zero in on. So by looking at one metric, I can focus on several areas of the funnel at once rather than just looking at absolute whole numbers like visits, leads, signups, etc.
So to answer the original question, visit-to-signup rate, or more broadly website conversion rate, would be my desert island metric. And what I would do is actually drag a new visualization block into my dashboard and dedicate it to displaying my website conversion rate.
Improving your website conversion rate
My next step from here is to break down this metric into all of the individual inputs that influence it. This gives me and my team several areas of focus in order to improve this metric rather than starting from scratch. I touched on this earlier, but when we think about improving website conversion rate, we think about:
- The form where people complete their sign up: What’s the completion rate of the form? Where are people dropping off? How can we improve the completion rate without sacrificing lead intelligence?
- The landing page where people sign up: How many visitors make it to the area of the page where the form is? Or if we’re using a chat widget, how many visitors are engaging with it? Can we test some variations of headlines, button copy, overall page length, etc?
- The calls-to-action that people click to reach that page: What’s the click-through-rate on these CTAs? How many pages do they appear on? What tests can we run to improve overall CTR?
- Overall traffic to the pages where the aforementioned calls-to-action appear: How are we driving people to these pages where the CTA and/or form appear? How can we drive more?
This is just one example, but as you can see, we can work backward from the point of signup all the way to the initial visit to determine where the key leverage points are that we can improve upon.
If you were simply looking at “sessions” or “new contacts”, your starting point for identifying improvements wouldn’t be as clear.
For example, how do I increase leads? Well, I can run a paid ads campaign. I can publish more ebooks. I could write more content.
How do I increase sessions? You could list out 30 ways, but when you look at website conversion rate as your north star metric and break down the individual inputs that influence that one metric, it gives you an area of focus that you can now zero in on and look at ways to improve.
Setting goal criteria in Google Analytics
In order to track your website conversion rate in Databox, you’ll need to make sure (if you haven’t already) that you’ve set the appropriate goal in Google Analytics in order to pull the metric.
There are a few ways you can do that. The 4 goal types in Google Analytics are:
- URL destination: Goal is triggered when a visitor hits a specific URL.
- Visit duration: Triggered when a visitor hits the specified duration of time on your website.
- Page/visit: Triggered by the number of pages a visitor views before leaving your website.
- Event: Custom event.
You’re going to want to log into your Google Analytics account and, if you haven’t already, specify the appropriate website conversion goal you want to then track in Databox.
From there, you’ll have a really good feel for how your website is performing and, most importantly, have specific areas of focus for improving your website conversion rate.
A better way to track your website conversion rate
Want an easy way to track your website conversion rate as well as all of the other KPIs that are critical to tracking the overall health of your website?
Grab the template used in this episode, connect your Google Analytics account, and you’ll see your data populate within minutes.