


Table of contents
The Metric Builder is our advanced setup engine that allows you to extract custom metrics, events, goals and data with just a few clicks.
A few years ago, we created Metric Builder so we could build custom integrations for Enterprise clients. Soon after making it available to the public, we realized it was helpful for companies of all sizes. And it became increasingly apparent that some users had complex data demands that could not be handled using predefined metrics.

Metric Builder 2.0
Last year, our users made almost 5,000 custom queries.
Our new version addresses feedback we received from these customers. Most of the feedback was how to make it easier to use. We listened and got back to the drawing board. These are the improvements:
- Supporting multiple time intervals with only one query.
- Making queries accessible right from the Designer, where customers setup visualizations.
- Improvements behind the scenes, so users don’t have to set correct data types or metric mappings to get accurate numbers.
- Making the Metric Builder a robust service that can eventually be an extension to any of our native connectors.
We strongly believe we checked all these boxes and even more.
While the Metric Builder form is different based on each supported connector, let’s take a closer look at how it works for Google Analytics and what has changed:
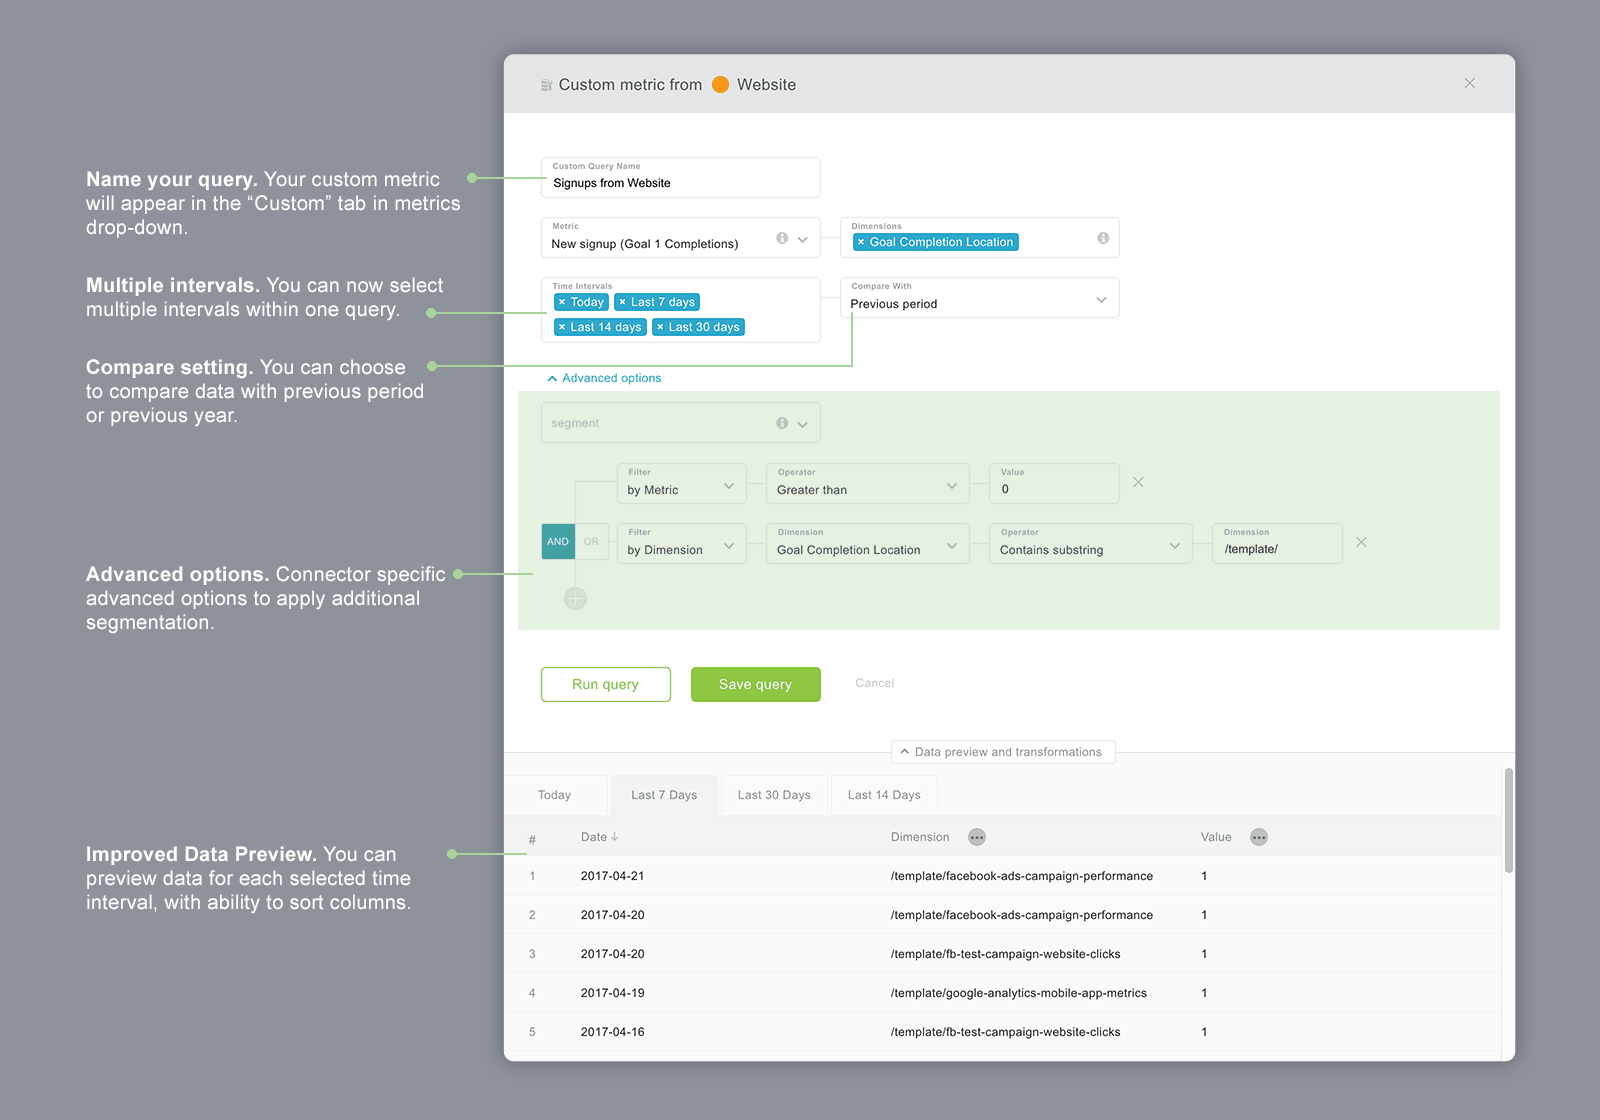
 Name your queries. Each query will produce a custom metric that you can name, so it’ll be easier to find it in your query list and within the Designer. In the Designer, all of your queries can be found under the “Custom” tab in the metrics drop down.
- Multiple time intervals with a single query. Now you don’t need to create multiple queries to cover multiple time intervals. Just select all the time intervals you need and they will be available for that metric.
- Compare setting. If you want to see the value compared to the previous period or the same period last year, you can now specify that in the Metric Builder. On a Number block, it will appear as a change value beneath the actual value. On a line or bar chart, it will add a second line/bar with values from the compared period.
- Advanced options. This part of the Metric Builder form is individual to each connector. It allows advanced segmentations, filters and settings to get the data you need.
- Improved data preview. Once you run the query, you will see the raw data response from the connector below. If you have selected multiple intervals, the results will be split and you can switch between them with tabs. The data preview shows raw data. You can sort by each column and apply a few transformations to the dimensions (we call them ‘Attributes’). Read about some more technical details in our help docs article.
PRO TIP: How Are Users Engaging on My Site? Which Content Drives the Most Online Activity?
If you want to discover how visitors engage with your website, and which content drives the most engagement and conversions, there are several on-page events and metrics you can track from Google Analytics 4 that will get you started:
- Sessions by channel. Which channels are driving the most traffic to your website?
- Average session duration. How long do visitors spend on your website on average?
- Pageviews and pageviews by page. Which pages on your website are viewed the most?
- Total number of users. How many users engaged with your website?
- Engagement rate. Which percentage of your website visitors have interacted with a piece of content and spent a significant amount of time on the site?
- Sessions conversion rate. How many of your website visitors have completed the desired or expected action(s) and what percentage of them completed the goals you’ve set in Google Analytics 4?
And more…
Now you can benefit from the experience of our Google Analytics 4 experts, who have put together a plug-and-play Databox template showing the most important KPIs for monitoring visitor engagement on your website. It’s simple to implement and start using as a standalone dashboard or in marketing reports!

You can easily set it up in just a few clicks – no coding required.
To set up the dashboard, follow these 3 simple steps:
Step 1: Get the template
Step 2: Connect your Google Analytics account with Databox.
Step 3: Watch your dashboard populate in seconds.
How you can try it out…
The Metric Builder feature is available for all users on the Business plan (free trials included). To try the new Metric Builder:
- Log in to the Databox webapp,
- Create a new Datacard/Datawall, or edit an existing one
- Select the “Visualization Types” datablock menu on the left
 and drag & drop an empty visualization (ie. Number, Line chart, Table).
 - Select the data source from the right panel. (The Metric Builder is supported for: Mixpanel, Google Analytics, Salesforce, Zendesk, Adobe Analytics, Facebook Ads and all SQL connectors.)
- In the Metrics dropdown, switch to ‘Custom‘ and select ‘+ New Custom Query.’ The Metric Builder form will pop up.
- Once you make a custom query, run it to see the results. If you’re satisfied with the settings, save the Query.
- Once saved, it will start to fetch data. Wait a moment and you should see the data on the Datablock. You can switch between the time intervals that you selected within the query.
With the Metric Builder, you can now pull the data you need to build advanced reports.
We are always eager for feedback, suggestions and ideas on how to improve it further, so feel free to contact us at help@databox.com.


