Table of contents
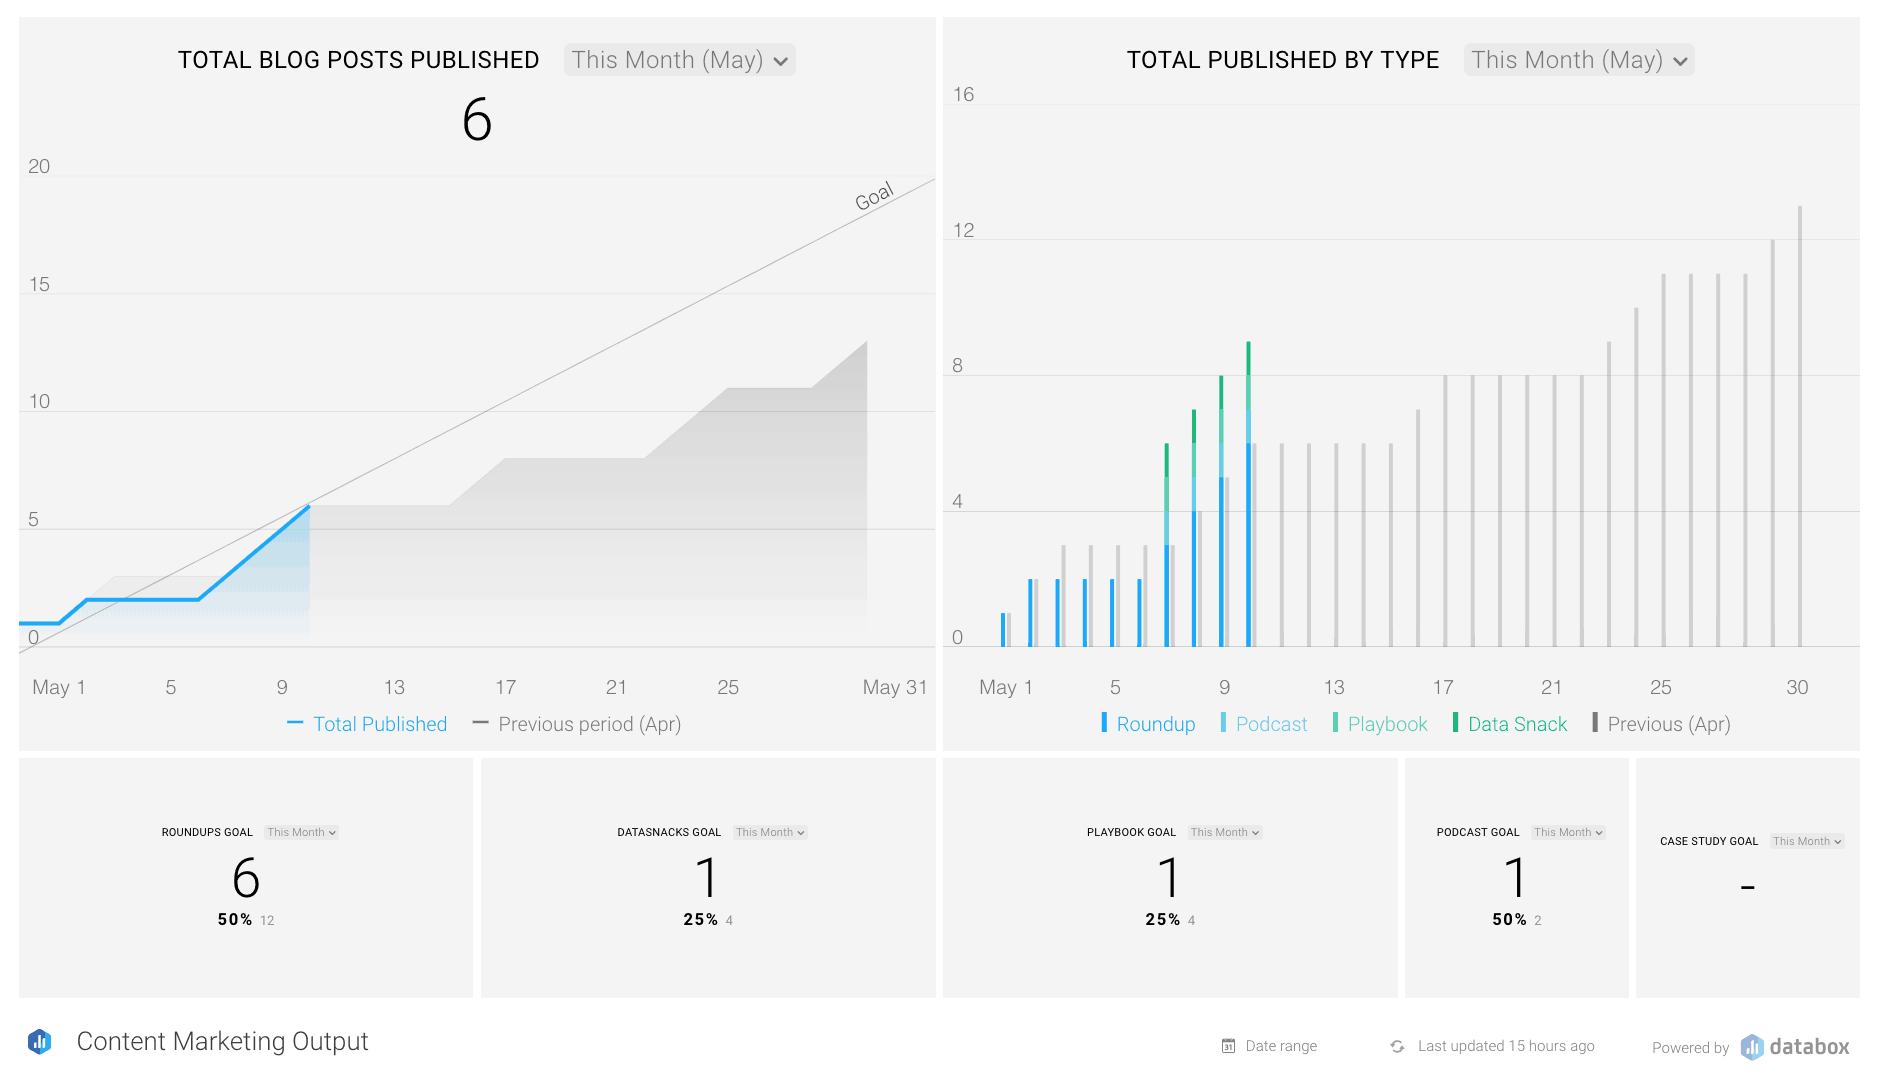
A couple of weeks ago I built a Databoard in order to track our editorial output here at Databox. (Seen below.)
Now, before I even finished that sentence, it’s likely your first thought was––just output, really? What about results? Traffic? Signups? What about quality over quantity? Isn’t volume for the sake of volume an exercise in vanity?
I hear you. Your reactions are valid.
However, we don’t track output from a content standpoint simply for the sake of volume.
Instead, because we know how our content efforts influence the rest of our business, we use output as a leading indicator for acquisition and sales.
We’re largely a content-driven organization. (Last month, 65% of our traffic came from organic search. )
So, since our acquisition model is largely dependent on our content efforts, tracking output gives our team a great starting point in terms of understanding performance in real-time. Most importantly, it’s a metric that even the individual writers can influence.
Often times, marketing teams are tasked with improving metrics that have multiple outputs across several teams. So, when you ask your team to improve signups, there are probably dozens of activities they can do in order to do so.
However, if you have a good feel for how individual activities influence the rest of your business, then measuring those activities as leading indicators (in our case, content output) is a meaningful metric that individual contributors can influence.
In this episode of Data Snacks, I walk you through how I built this simple editorial Databoard using only Databox and our native integration with Google Sheets.
Oh, and also I’ve created a public link to the Google Spreadsheet I use to track all of this, which you can have. It’s basic so you can customize it however you’d like.
I’ve already included the formula in the ‘volume’ column which will automatically calculate a ‘1’ any time you add a new post to this spreadsheet. So, just make a copy of the spreadsheet and its plug-and-play.
Hope you find it helpful. Enjoy.