


![How Rheo Makes Data-Driven Product Decisions Using Real-Time Dashboards [Case Study]](https://cdnwebsite.databox.com/wp-content/uploads/2017/09/01112108/RheoTVCaseStudyBG.jpg "How Rheo Makes Data-Driven Product Decisions Using Real-Time Dashboards [Case Study]")
Table of contents
Imagine you are on a business trip, and you return to your hotel room after a 12-hour day of meetings and emails.
You flop onto your bed, and flick on the TV to relax before falling asleep and doing it all again the next day.
There is one issue- unless your favorite show is on at the time, you will find yourself idly thumbing through commercials and re-runs that you don’t even want to see in the first place!
This is the problem that Alan Cannistraro set out to solve by founding Rheo in 2015. Instead of randomly searching your TV or YouTube when you want to find entertainment, he felt that you should be able to get video served to you based on your tastes and mood.
Of course, there is one major challenge in front of them- people use their product when they feel impatient, lazy or need to find a crowd-pleasing option.
Imagine you have a 20-minute bus ride to work every day. You want to make the most out of that time, but you also don’t want to spend too much mental effort at 8AM in the morning!
This is where Rheo’s product team comes in. They need to make Rheo easy to use, but also smart enough that it will reliably serve the right videos at the right time. Otherwise, people will just go back to roaming YouTube.
Since they have aggressive growth goals, the Rheo product team monitors their live data on TV, desktop and mobile. They measure improvement on a weekly basis, and if something goes wrong in their conversion funnel, they can start looking for a fix immediately. Here is how the team integrates data into their daily activities.
The Company
Rheo was founded in 2016 as an Apple TV app for watching videos that fits your mood in the moment. Rather than scanning channels or searching for a show, you can choose your mood and the app will begin streaming clips that are 2-10 minutes long. Much like Pandora, the more you use the app, the better it understands your tastes. It uses a combination of humans and machine learning to serve you the most relevant videos possible.
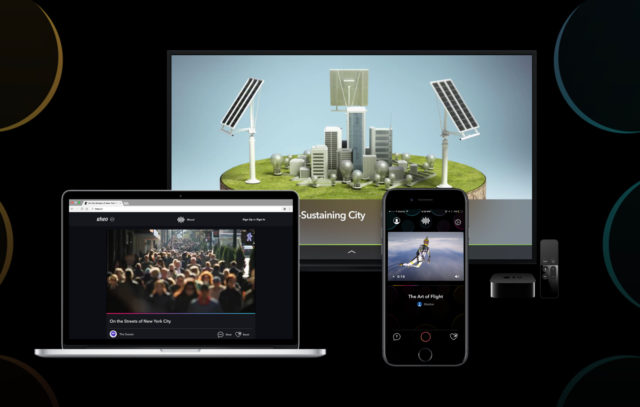
In 2016, the company raised 2.3 million dollars in venture capital financing, and in 2017, it expanded to the web and iOS.
People use their apps in a variety of settings:
- On the commute to work
- During meals
- At parties looking for ambient entertainment
- Travelling for business
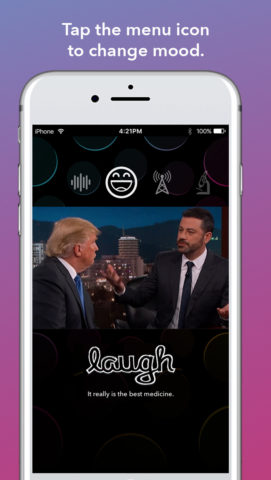
Their channels are called Laugh, Inform, Learn, Taste, Spark, Move and Chill. For example, Inform carries the latest news, Move has extreme sports footage, and Laugh might have clips from late-night talk show hosts.
Rheo is a tech company creating a media experience for always-on screens. They compete with the traditional practice of flipping through videos or channels until something that fits the mood pops up. By prioritizing the user’s habits, tastes and feelings up front, they eliminate the search process and get right to the content.
The Challenge
Rheo uses a series of tools to analyze usage of their product. All of these tools prioritize data collection, and not data communication or analysis.
The tools do a great job of tracking data within Rheo’s apps. But, they are not flexible when it comes to displaying data or combining metrics from multiple digital services. Every user interface (UI) is different and requires different analysis.
Pipelines are extremely important to Rheo’s internal measurement. When different parts of the pipeline come from different data sources, the product team cannot quickly view the health of their metrics. Before they started using business dashboards, they would bring up multiple tabs in Chrome in every meeting and go through the services, one by one.
Also, if their CEO was in an investor meeting, he could only use graphs within his slide deck. If potential investors asked for further details on any metric, he would not be able to reply immediately.
How They Use Real-Time Dashboards
Rheo primarily uses the following data sources in their business dashboards:

Localytics


iTunes Connect


Social Media (Facebook, Twitter)

They stay on top of their data via these methods:
Growth meetings 3x/week– The product team meets three times a week to make sure they are retaining new cohorts of users at higher rates than earlier cohorts. Users are broken up into iPhone users and Apple TV users since Localytics uses a different app ID for each. They display a series of performance dashboards in a row, and ensure that each funnel is on track to meet or exceed expectations.
For example, they use Google Analytics and iTunes Connect to create a pageviews to app download ratio. When they tweak their page in the App Store, they measure whether copy changes affect this ratio.
Weekly emails- Product team members get a weekly email with changes in KPIs from the past week.
Automated alerts- The team has customized notifications for major events in their data. For example, if conversion rates fall off a cliff in one funnel, there may be a bug. Team members get a real-time notification from this business dashboard software. Or, if downloads are unusually high, they can investigate the cause.
Key Metrics They Monitor
Rheo uses metrics that are typical of online media companies:
- Daily Active Users (DAU)
- Monthly Active Users (MAU)
- DAU/MAU ratio
- Time Spent per User per Day (their own calculations)
- Time Spent per User per Month (their own calculations)
- Videos Watched per User
- Total Videos Viewed
- Total Clips Played per Day/Week
- Total Time Spent on whole platform
- 28 day Rolling Churn
To be clear, “28 day rolling churn” answers the question, “What percentage of our users churned in the last 28 days?” So, if you had 100 active accounts on your app in August, how many became inactive in September? And how does that percentage compare to the previous 28 days?
The definition of a churned user is relative to the type of app, but in the case of an app like Rheo, a churned user might count as someone who has not logged in for 14 days.
Gautam Banerjee, the product manager of Rheo, says:
“Retention is king in Silicon Valley. Downloads only matter if your app is sticky.”
So, the Rheo team analyzes retention using all the metrics above. Some can be displayed in Databox, while others are not available via the Localytics API. Those must be analyzed within Localytics.
Lessons Learned on Running a Data-Driven Team
Here are some of the things that impressed me after learning about the tactics used by the Rheo product team:
Learning user habits at scale: The two Rheo apps have completely separate use cases. This creates two distinct user patterns that the product team needs to plan around. And that means two pipelines with separate benchmarks for conversion rates.
On one hand, you might think that the Rheo team needs to track double the data compared to other startups. But, plenty of sites and apps have this challenge. For example, if you have a freemium SaaS app, you might have two profiles of users: the free/low-paying ones, and the ones with larger demands and budgets. Each will have separate needs from your SaaS product.
Ease of access to data determines level of attention: The product team would have a hard time running three growth meetings a week without the help from Databox’s dashboard designer tool. If they could not aggregate different sources into one place, the team would either meet less often or data extraction would become somebody’s part-time job.
Retention is king: If you want to quickly grow your company, you must focus on retention first. No amount of acquisition will help you overcome a leaky funnel. The Rheo product team measures at least 8 retention metrics simultaneously so they can discover which actions in their app create ongoing habits. Then, they can make more data-driven decisions on features and conversion points within the app.


