Table of contents
Hello everyone. Welcome to another episode of Data Snacks. I’m Monja, a product marketer here at Databox.
Today we’re going to focus on organic search, and more specifically, how and what to track in order to see how well organic search performs for your business.
We’ll build a dashboard that helps us answer a few key questions…
- How much of our website traffic is coming from organic search?
- How many new contacts?
- Which keywords and landing pages are ranking best?
This information will help us decide which topics and keywords to focus on for content marketing.
We’ll take a look at overall organic search performance from Google Search Console, then drill down to look at our top ranking keywords and landing pages with data from AccuRanker.
Below, you can view the full episode or keep reading for a fully transcribed version of the episode, complete with relevant screenshots.
In this episode of Data Snacks, I’m going to show you how to:
- Track Impressions, Avg (Keyword) Position, Clicks, and Click-Through Rate (CTR), as well as keywords and landing pages that rank best, and compare the data to the previous period.
- Assess the effectiveness of our organic search strategy in driving traffic and new contacts, again compared to the previous month
- Determine which keywords and landing pages are performing best, and concentrate on them for content marketing and conversion opportunities
First, Let’s Track Overall Organic Search Performance
Here’s what I want to see – I want to track overall organic search performance in terms of visibility and keyword rank for both keywords themselves and for landing pages that feature them. This should tell me how well we are doing in organic search and pinpoint opportunities for improvement in our content strategy.
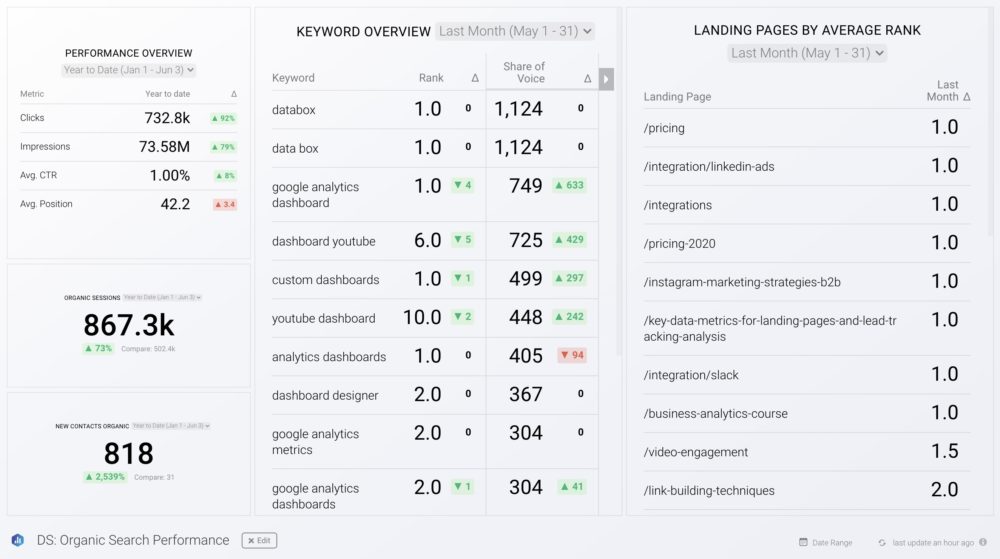
To do this, First, I’m going to the Databox Dashboard Designer, then to the Databox Metric Library, selecting Google Search Console from the data sources, and dragging and dropping the Performance Overview advanced table to my databoard. This table shows the number of Impressions, Average Position (or rank) for all of our indexed keywords, Clicks, or the number of times a user clicked on a search result including one of our pages, and the average Click-Through Rate, or the percentage of users who clicked a search result linking to one of our pages.

What this means for our content strategy – our organic search performance this month is a little down from last month, but if you change the date range to Year to Date, you can see that we have made significant progress since last year. Our Average Position is still a little low, so we need to keep reviewing and improving our content strategy to raise the profile of our strategic keywords.
Time to Include the Accuranker
Now, let’s look at individual keyword performance from Accuranker. We’re doing very well for branded keywords like “Databox” with a number one rank and a high share of voice, which is the click-through rate multiplied by the average monthly volume for each position. We see other high-ranking keywords that are relevant for our products and services performing well too.
Finally, we can look at our best landing pages and how they rank for the keywords they feature. This gives us an idea of what people are searching for and clicking through to read on our website, and the list includes a variety of blog posts, product pages, and our pricing page, which implies that people with high purchase intent are visiting our site. That’s a good thing!
So, What Did We See
From this dashboard, we can draw some important conclusions. Overall, our efforts in organic search have been successful in driving qualified traffic to our website, and we are ranking highly for strategically important keywords.
On a month-by-month basis, we can see opportunities to improve upon both keyword and landing page performance, and this might inspire us to update our content strategy accordingly.
Want help creating this report? Start a chat with one of our dashboard experts, and they’ll help build this report for you for free.
If you haven’t already, Just create your free Databox account and reach out to our team either via chat or email.
See you next time.


