


Table of contents
Customer churn analysis or keeping tabs on customers who quit using your product or service is the key to retaining customers.
After all, when you can identify what challenges your users are facing and solve them in time, you can save the customer from leaving. Even if you identify the problem after a customer has churned, you can save your business from losing more such customers struggling with the same issue.
The result? Increase in revenue, a better product that meets users’ requirements, and loyal customers.
But where should you start with analyzing your churn data? We talked to 39 experts to learn their tips to effectively study churn data. So altogether, here’s what we’ll cover in this post:
- Why Does Churn Analytics Matter?
- How Does Churn Analytics Work?
- How Often Companies Analyze Churn Data
- Most Common Reasons Behind Customer Churn
- Best Ways to Analyze Churn Data for Your Industry

Why Does Churn Analysis Matter?
Studying customer churn analysis is essential for understanding not just how many customers are opting out of using your product/service, but also why and when they are churning.
For instance, users may be churning at the third step of your onboarding process (when) because the step action to take there requires too much information from them (why).
It’s only when you have this information that you can fix the problem adequately and reduce churn. Most of all, customer churn analysis is how you create loyal product/service users (or whatever your goal is) — ultimately improving your revenue.
It’s also important to note here that analyzing churn is not limited to app users. Instead, you can also measure website churn to convert site visitors into paying users, for example.
Related: Save Your Business From Churn: 9 Churn Risk Factors to Identify
How Does Churn Analytics Work?
Churn analytics is a measure of the rate at which customers are quitting using your product, service, or website. It also looks at data that identifies:
- At which point users are churning
- Exactly which customers are churning [and]
- Why are customers churning
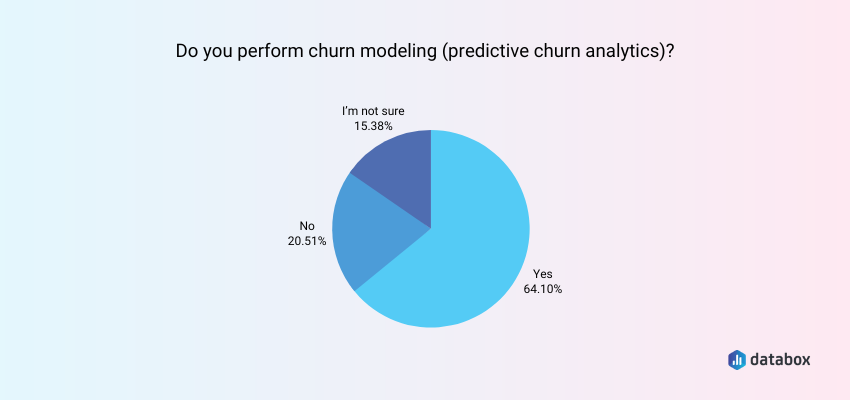
You can also conduct a predictive churn analysis — also known as churn modeling. That is: go through historical data (patterns in customer churn and individual customer use of your product/service) and customer feedback to predict the future churn rate.
2 in 3 companies perform churn modeling for its benefits. Only 20.5% of the experts we surveyed say they don’t conduct a predictive churn analysis.
When analyzing predictive churn data for yourself, use the information to solve issues customers are struggling with to retain them before they churn.
By solving these churn-causing issues in time, you can also reduce future users from discontinuing to use your product/service for the same reasons that past customers have.
For example, if you find that a poor customer fit is a leading reason behind your product churn, you can plan strategies like improving your product and site messaging to better target, speak to, and attract your ideal customers.
Predictive churn analytics also help subscription businesses better understand your monthly and annual recurring revenue. By knowing how much churn to expect, you can better predict your income for the month/year.
As for site owners, predictive churn analysis helps improve conversions and forecast and set sales goals for new leads coming through your site directly.
Listen to our Metrics & Chill podcast to learn how Logan Lyles, VP of Customer Experience at Sweet Fish Media, lowered revenue churn from 15% to 3% in 12 months despite the pandemic.
How Often Companies Analyze Churn Data
With it being clear that customer churn analysis is super important, let’s look at how often you should measure it.
According to our research, 2 in 3 companies typically analyze their churn data monthly. They use different tools to analyze their churn data, including Databox, Spreadsheets, Churnly, and more.
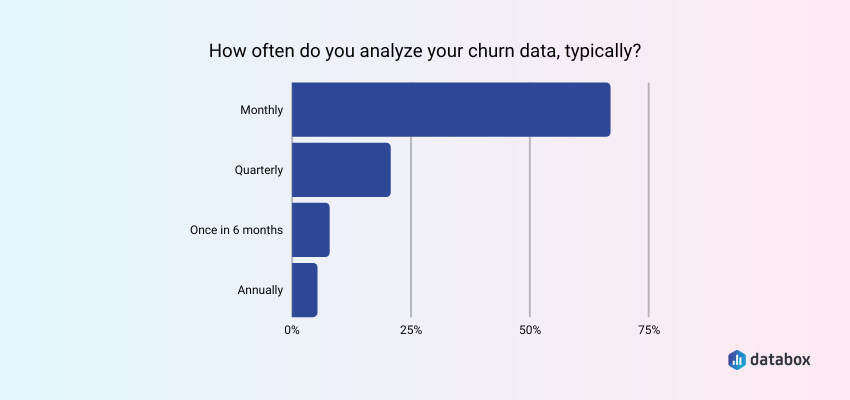
This makes sense because by tracking churn data every month, you can see whether your churn rate is increasing or decreasing.
If you’re actively optimizing your site, product, or service or making significant changes, the monthly churn data can help you see how it’s impacting your churn rate. Based on what you learn, you can decide whether to double down on the change or, if it negatively impacts churn rate by increasing it, kill the idea altogether.
Related: 14 Proven Ways to Reduce Customer Churn in SaaS
Most Common Reasons Behind Customer Churn
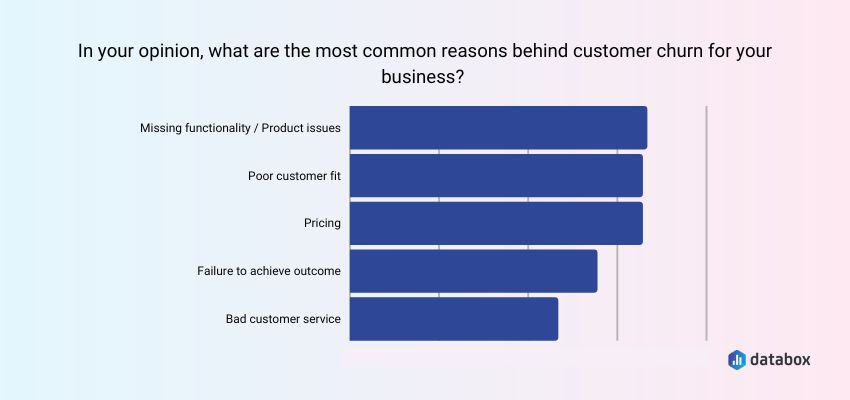
Missing functionality/product issues, poor customer fit, and pricing are the top three reasons behind customer churn.
Failure to achieve outcomes and bad customer service are two more common reasons behind customer churn.
Essentially, if your product is packed with bugs or doesn’t meet a customer’s goals, it makes sense for users to quit using your tool.
The same is true about your pricing and your tool not being able to help users achieve results that they expected to accomplish with your product.
The solution then is to continuously optimize and create new features that meet users’ requirements. At the same time, it’s essential to get rid of features that don’t add value to most of your users. By collecting user behavior insights, you can quickly and effectively learn about:
- How users interact with your product
- Where users struggle with using the product
You can also use the data to identify bugs in your product and fix them before they cause churn.
As for poor customer fit, aim to improve your product and site messaging to better target the right users. For this, talk to your power users to learn how they define your product and how it helps them. Also, ask them if they’re satisfied with paying your pricing. Then use their language to inform your copy and create new pricing or pricing packages (if needed).
Lastly, customer service is a must for most users. Given users have lots of product choices to choose from, proactive customer service is the key to standing out and providing users an exceptional experience that retains them. So be sure not to push customer service to the backburner.
PRO TIP: How to Track the Right Metrics for Your SaaS Company
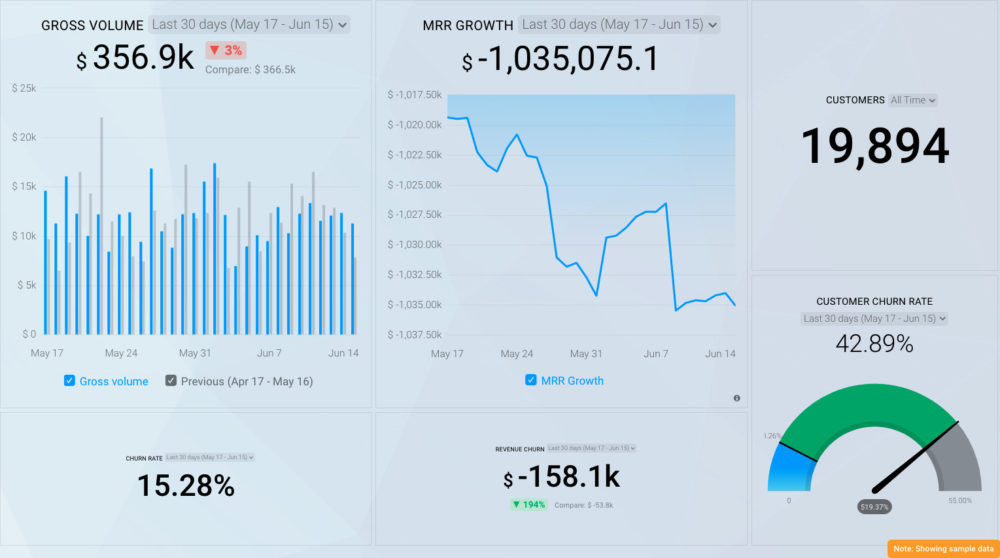
It’s not easy to know which KPIs to track for sales, marketing, and customer success in a SaaS company. There are many possibilities, and so much to do! Why not start with the basic metrics that determine the health of your company?
- Sales (Gross) Volume: How much revenue did your sales team bring in this month, this quarter, or this year?
- MRR Growth: How fast are you growing revenues from recurring subscriptions?
- Customers: How many customers do you have right now?
- Customer Churn Rate: What’s your customer churn rate, and how much revenue have you lost to churn?
If you want to track these in Stripe, you can do it easily by building a plug-and-play dashboard that takes your Stripe customer data and automatically visualizes the right metrics to allow you to monitor your SaaS revenue performance at a glance.
You can easily set it up in just a few clicks – no coding required.
To set up this Stripe dashboard, follow these 3 simple steps:
Step 1: Get the template
Step 2: Connect your Stripe account with Databox.
Step 3: Watch your dashboard populate in seconds.
Best Ways to Analyze Churn Data for Your Industry
Now for tips to improve your customer churn analysis. Here’s a quick lowdown, followed by the details:
- Conduct a location-specific customer churn analysis
- Study customers’ behavioral patterns
- Analyze churn data by segmenting customers
- Use dashboards to better study churn data
- Gather qualitative data on top of quantitative data
- Factor in seasonal trends too
- Review customer lifetime value for a better churn analysis
1. Conduct a location-specific customer churn analysis
This involves reviewing how users from specific locations are churning.
In terms of product, this could lead to insights like users from location X quit using your tool frequently because the pricing is too high for them.
For a website, location-specific churn analysis can lead to insights like visitors from a specific location bouncing back because they couldn’t translate the page, for example.
At Four 19 Properties, Neil Dempsey shares that location-specific customer churn analysis has proven to be super useful.
“A location-specific analysis is one way to generate effective churn data. It allows me to assess whether my marketing strategies are successful or not. This gives me valuable insight into key customer trends,” Dempsey says.
“Hence, I take immediate action by making budgetary decisions for a higher churn rate. As a result, customer satisfaction increases. It’s a top priority for running a successful business. That’s because it positively translates into higher profits and sales.”
Explaining further, Dempsey comments: “Here are a few insights I gained by analyzing churn data using a location-specific method:
- It helps me understand why customers don’t re-visit my shop.
- It helps me optimize my products and services based on data-driven insights.
- It also allows me to assess whether I should invest in a product prototype or not.”
2. Study customers’ behavioral patterns
Another important tip here is to analyze the way customers are interacting with your product, as we mentioned above.
Priya Kumari from Valasys Media talks about: “The first step in analyzing churn data is to identify the behavioral patterns of customers who churned. This can be done by looking at the following:
- How many times had they used your product before they left?
- What was the reason for leaving (e.g., poor service)?
- Did they return after their first time using your product? If not, why not?”
Kumari also prioritizes predictive customer churn analysis. “In order to predict churn, you’ll need to build a model that uses your churn data,” Kumari advises. “You can do this by creating an algorithm that predicts the probability of a customer churning based on certain factors.”
“For example, if you have observed that customers who bought their products through Amazon’s website are more likely to churn than those who purchased them at retail stores or other sites like eBay and Craigslist, then it would be valuable for your business model if you could identify which customers fall into this category and target them with specific marketing campaigns.”
“Once you’ve created your model and tested it using historical data from previous sales cycles or behaviors of current customers (such as how many times they’ve visited), it’s time to start using it in real-time!” Kumari continues.
Talking about how to analyze the data you’ve gathered, Kumari writes, “To gain insights into customer behavior, you may want to know more about why customers are leaving your product or service, and what factors influence their decision.
For example, you could look at the average length of time for which customers have been with your company before canceling and compare that number with other companies’ churn rates (assuming there are no differences between them).
Or maybe you would like to know whether people who use this particular app tend to stay longer than those who do not; by observing how often people use it over time, we might be able to determine whether there is any correlation between usage patterns and retention rates.”
Finally, convert the data into “actionable insights for improving customer loyalty and retention rates.”
3. Analyze churn data by segmenting customers
A handful of our respondents recommend segmenting users as you analyze churn data.
According to Andrew Pfund of Scale and Prosper, user segmentation is critical. “Most companies will analyze their monthly churn as a whole percentage. This can be misleading when all your customers get lumped into one big group,” Pfund warns.
“The problem with this approach is that a customer who churns within their first month does so for significantly different reasons when compared to a subscriber who churns out after 1-2+ years.”
Says Pfund, “Do you know when your customers drop off most after signing up for your service? Most people have no idea as tracking this isn’t easy. Looking at it this way opens up a new way of analyzing your churn that’s effective and easy to understand. To do this, you calculate your churn based on a customer’s first month of signing up. Or any other period you want to analyze.”
“For example, you can track how many customers churn within their first three months, six months, or their first year of being an active subscriber with you. When you look at your churn like this, you can spot where the biggest drop-off is happening along your customer’s journey on average.”
“Once you know when that’s happening, you can use that to decide where you should focus on when it comes to your customer success and retention efforts,” observes Pfund.
“On average, the biggest drop-off happens within the first 1-3 months of new customers signing up. This is where you can make the biggest difference in reducing your overall churn,” Pfund points out. “When you make any improvements to your onboarding or customer experience in these stages, tracking churn like this can help show you if your new changes help reduce your churn.”
Lastly, Neutypechic’s Lukee Li is of the same view but calls the method cohort analysis as it relates to measuring churn in the eCommerce niche.
“Cohort analysis essentially boils down to tracking groups of users (or, in this case, customers) over time and observing how they interact with your product,” says Li.
“This approach has a few key advantages when it comes to understanding and combatting churn:
- It allows you to identify patterns and trends in customer behavior.
- It helps you isolate the effects of different factors (such as changes in your pricing model or the addition of new features) on customer retention.
- Helps you identify factors that impact customer satisfaction and loyalty.
- Helps you predict future customer behavior and trends.
“All of these factors make cohort analysis an essential tool for understanding and reducing churn in eCommerce.”
So you know what to do, right? Segment users into groups — based on any factors that are important to you, such as their location or where they are in their sign-up journey. Then study them to determine patterns in churn data to retain customers better.
4. Use dashboards to better study churn data
“The best way to analyze churn is via dashboards that centralize data from our exit interviews. They help us gain quantitative and qualitative insights into why the users churned and act appropriately,” notes Charles Cridland from YourParkingSpace.
Essentially, dashboards make it easy to see all the data on a central board that you can share with your team and stakeholders. They also visualize data in easy-to-understand charts — further simplifying studying and digesting churn data.
You can also pick and choose between customer metrics you want to review and those that you want to give the most space to in your dashboard. All this makes it really simple to study data, which, in turn, makes it easy to identify patterns and trends in the data.
If you don’t know where to get started, we have a handful of prebuilt SaaS dashboards that you can download for free and simply plug in your data to have it ready for at-a-glance analysis.
5. Gather qualitative data on top of quantitative data
Another useful tip for effective customer churn analysis is pairing your quantitative data (data with numerical value) with qualitative data (data featuring customer voice) to get a full understanding of the common causes of churn with your product.
One simple way to gather feedback directly from customers is to survey them. At Coolparcel, Daniel Hedegaard shares that they take this approach. “After we tried to reengage our customers without luck, we ask them to share with us what made them leave via a Typeform. In the absolute majority of cases, the pricing is to be blamed, which is understandable for our price comparison service model.”
Hexclad’s Jason Panzer takes this approach too for learning about their email list’s churn rate. “One way that we measure our customer churn is by surveying and analyzing email unsubscriptions. We ask for feedback to understand why leads drop off our email newsletter to improve our email marketing strategy and retain leads longer.”
Here’s what this approach has unearthed for Panzer’s team: “We have found that some users prefer not to receive promotional content via email or only want to subscribe for an account or order-related emails.”
“Amongst other data insights, this customer feedback helps us refine our marketing approach and segment our email audiences by their investment in our brand,” Panzer adds.
“We also measured an inclination in our customers who unsubscribe from emails to purchase less of our products over time. There are a few explanations for why that may be, but segmenting these populations together has helped us implement new strategies that improve our approach and retain more leads.”
Another way to gather qualitative data is by interviewing customers. Host regular chats with different groups of users who are willing to share their thoughts.
For example, talk to your core users to learn about what might be bothering them. Similarly, talk to users who have churned to learn about what caused them to quit using your product/service.
6. Factor in seasonal trends too
Depending on the industry you are in, it’s also essential you take seasonal churn trends into account.
Caitlyn Parish of Cicinia shares this tip in reference to churn in the bridal fashion industry. According to Parish, the typical formula for calculating churn (dividing the number of leaving customers by the total number of customers at a given time) isn’t suitable for every business model and type.
But by continuing to stick with using this formula, businesses risk using inadequate data for measuring churn, which misleads and misinforms stakeholders.
With that, Parish talks about calculating churn in their specific industry. “The one way we analyze churn data effectively for the bridal fashion industry, our business niche, is by doing an analysis based on seasonal trends.”
“What happens is that more weddings take place during the summers than in the winters, so we end up doing more business during summer months as compared to the rest of the year. So we divide our customer churn data into summer months and winter months and analyze it separately. This way, we have accurate information about how many customers we had at the start of each season and by what amount that number has decreased.”
“As our business niche is bridal fashion, we do not expect to have repeat customers. We do get a lot of new customers due to the nature of our niche, so we have modified the process to suit our business model better,” Parish explains.
“Insights gained by analyzing churn data on a seasonal basis If we analyzed data yearly based on the number of customers we had at the start of the year and the number of customers left at the end of the year, we would have come to the conclusion that we are losing more customers than gaining new ones in the same time period.”
“However, that would not have been accurate as our customer volume varies seasonally instead of based on yearly,” continues Parish.
“Analyzing churn data seasonally has allowed us to have more accurate data, and based on those numbers, we have been able to modify our marketing campaigns and make them more aggressive during the wedding season. We have also been able to allocate funds accordingly towards achieving our sales targets.”
7. Review customer lifetime value for a better churn analysis
This one’s a hat tip to Jonathan Saeidian from BrentonWay, who also shares another industry-specific tip for measuring customer churn.
“One way to effectively analyze churn data for my industry is to look at the lifetime value of each customer (CLV). This is a common metric that can be used to determine how much an individual customer contributes over time, which can help you better understand what drives customer acquisition costs,” elaborates Saeidian.
“I’ve gained some insights by analyzing churn data in this way,” Saeidian continues, explaining how reviewing the CLV has helped them.
“For example, I’ve noticed that customers who are referred by existing customers tend to be higher value customers, and this makes sense because these existing customers have already validated the product’s value proposition.”
Related: 18 Tips for Increasing Your Customer Lifetime Value (CLTV)
“I also learned that customers who do not buy the product again after their first purchase are typically less valuable than those who do, so it seems like it might be important to provide more incentive for those individuals who don’t buy again after their first purchase,” Saeidian adds.
Nolah Mattress’s Stephen Light also champions measuring CLV in the eCommerce industry to understand churn better.
“Measure churn rate as it relates to Customer Lifetime Value,” Light suggests. “In eCommerce, some customers may not be gone for good but are just taking a break because they probably don’t need another purchase for some time.”
“Keeping track of the churn data and CLV gives you an idea of who these customers are vs. those at risk and how you can strategize your retention efforts and convince them to come back,” summarizes Light.
Track and Analyze Your Churn Data in One Place
Remember, customer churn analysis is super important to retaining customers in the long haul and for growing business revenue.
But here’s the thing: excellent analysis of churn data depends on effectively tracking and studying the data in one place — such as a Databox dashboard.
The dashboard presents all important customer metrics on one screen and visualizes data such as churn rate using easily readable charts.
All of this not only makes it easy for you to track churn data in one place but also simplifies studying the data to identify patterns in it.
The best part? Setting up a Databox dashboard is a piece of cake. Simply plug in your data sources in the software, and the data in the dashboard will populate automatically.
You can also use a churn analysis template to create your dashboard or shout to our support team so they can create your first dashboard for you.
So are you ready to reduce churn and improve customer retention? Sign up for a free trial now!


