


Table of contents
Every good salesman knows that in order to sell your product, you first have to know your customers.
While drawing traffic to your website through different marketing channels is an important part of the sales process, it’s even more important to convert the traffic that you already have.
If you don’t know why and when your visitors choose to buy a product, acquiring more traffic won’t make much of a difference. Once you figure out what makes your sales process appealing to the visitors, the conversion rates will undoubtedly increase.
To better understand your visitors’ behavior, their overall reaction to your sales process, and why they choose to leave the website at a certain stage – we use Google Analytics Funnel Visualization Reports.
This guide will show you how funnel visualization reports work and how you can determine which funnel steps cause the most drop offs. Once you understand this, you can improve the problematic funnel step and increase your conversion rates.
- What Is a Funnel in Google Analytics?
- Under Which Report Does Funnel Visualization Come in Google Analytics?
- Types of Google Analytics Funnels
- When You Should Create a Funnel?
- How Do I Decide Pages for My Funnel?
- How Do I Create a Funnel Report in Google Analytics?
- Common Issues You May Come Across When Setting Up Funnels in Google Analytics
- How Do You Analyze a Funnel in Google Analytics?
- How to use Funnel Exploration Report in Google Analytics 4
- Build Custom Google Analytics Multi-Channel Funnel Metrics in Databox
- Understand How Your Marketing Channels Contribute to Conversions & Sales with Databox

What Is a Funnel in Google Analytics?
In Google Analytics, a funnel is a series of steps that you want your visitors to take, in order to convert them into customers.
Turning a visitor into a customer is the main goal of each website owner. To achieve this, you should include a specific stage process for your visitors to follow.
Funnels in GA track these different stages and gather data on each step of the customer’s journey. The data you receive from these reports later helps you optimize the stages to ensure more conversions.
This is what an ideal customer journey looks like:
- A visitor opens your website and checks out the products
- They open a specific category page and find a product that they like
- They take a look at the product details
- They add the product to the cart
- They view the cart and make the purchase which leads them to the confirmation page
The main goal of funnels is to provide you with an insight into the visitor’s behavior during each stage of the conversion process. This lets you know which changes you have to make to optimize your website.
Funnel reports are immensely useful because they show you the exact stage at which users tend to drop off and leave the website.
For example, if the funnel report shows that users leave the website at the ‘View Cart’ stage – it might mean that they are having difficulties navigating through the different steps they have to take to finalize the purchase. If that is the case, you should immediately revamp that specific page.
Funnels typically consist of a few goal pages and funnel pages (aka funnel steps).
Under Which Report Does Funnel Visualization Come in Google Analytics?
Companies use funnel visualization reports to monitor visitor interactions and determine which steps of the funnel record the most drop-offs. With this information, you will know which part of the conversion process needs to be fixed.
You can find the funnel visualization report by opening up your GA view and going to Conversions > Goals.

Types of Google Analytics Funnels
Google Analytics offers users access to 4 different funnel types.
These include:
- Goal Funnel – This type of funnel includes a step-by-step process that you expect website visitors to follow. The goal is usually something of a non-transactional manner (newsletter signups or downloads).
- Sales Funnel – Very similar to the goal funnel, but the objective is for the visitors to complete a transactional goal such as ordering a product from the website. A good example of this funnel is the checkout process.
- Multi-channel Goal Funnel – This is a goal funnel that analyzes the impact that multiple marketing channels had on the conversion process.
- Multi-channel Sales Funnel – This is a sales funnel that analyzes the impact that multiple marketing channels had on the conversion process.
- Strict Funnel – The strict funnel is used when you want the visitors to strictly follow the steps you inserted during the creation of a funnel. It excludes the possibility of the visitors skipping a step. This funnel is primarily used to clearly determine the main drop off points in what would otherwise be an ideal customer journey.
- Flexible Funnel – You can use this funnel if you don’t want to set any strict steps that users have to follow to make a purchase. Since user interaction tends to differentiate, they don’t have to end up adding products to the cart the same way.
This article will mainly focus on goal funnels and sales funnels. This is because the data gathered in these two funnels is considered to be the most important when it comes to conversion optimization.
When Should You Create a Funnel?
Although Google Analytics funnel reports can be immensely useful, not all business models require them.
You should create a funnel if your website has a clearly defined stage process through which your visitors go to complete a certain objective.
If the objective can easily be achieved through a variety of different stages or steps, you won’t need to include funnels on your website. They simply won’t be of much use for conversion analyses.
Instead, you can try incorporating filtered views for organic traffic, social media, paid search, etc.
How Do I Decide Pages for My Funnel?
The pages your visitors most often view before completing the website goal should be the ones used as funnel pages. To figure out which pages fit into this criterion, you can use the page value metric.
Another option is to use the “Reverse Goal Path” report that can be found in Conversions > Goals (in your GA account).
This feature provides you with insight into what triggers goal conversions and the number of conversions triggered on each separate stage. The stage that drew the most conversions is the one you should use as a funnel.
Related: How to Create & Measure Your Content Marketing Funnel
How to Create a Funnel Report in Google Analytics
With a bit of help, creating a funnel report in Google Analytics can be a piece of cake.
Follow this step-by-step guide to set up your funnel reports in no time:
- Step 1: Create a Goal
- Step 2: Customize the Goal
- Step 3: Fill in the Goal Description
- Step 4: Goal Details
Step 1: Create a Goal
Before you set up funnel reports, you first have to create a new goal in your Google Analytics account. The advanced visualization features come afterward.
Follow these few steps to create a goal in GA:
- Open up your GA account
- Find the view under which you want to insert a goal
- Press “Goals”
- Press “New Goal”

Step 2: Customize the Goal
Once you create a goal, we move on to the customization process.
Under “Goal set-up”, choose the type of goal that you want to create. We will go with “Custom”.

Step 3: Fill in the Goal Description
Use an appropriate name for the goal you create. Google Analytics includes a naming conversion that you should follow. For instance, PDF – Best business marketing strategy 2022 document.
GA will choose the Goal ID/Set and we advise you to stick with it. If you change it, you risk replacing other goals displayed on your website.
Next, you will be asked to choose which “Type” of goal you want. To set up a funnel visualization report, you should choose the “Destination” type and press “Continue”.

Step 4: Goal Details
The “Destination” page is where conversions occur.
You should specify this page by entering an URL in the “Goal Details” box. Let’s say that you want to track the product page as a destination goal – instead of entering “www.business.com/productpage.html”, you only add “enter/productpage.html”.

When you finish adding the goal details, you can now set up the funnel visualization reports.
Related: What’s a Good Funnel Conversion Rate?
You can find the “Funnel” option underneath and switch it to “On”. You can also specify the steps that the website visitors have to take to complete a specific goal.
PRO TIP: How Well Are Your Marketing KPIs Performing?
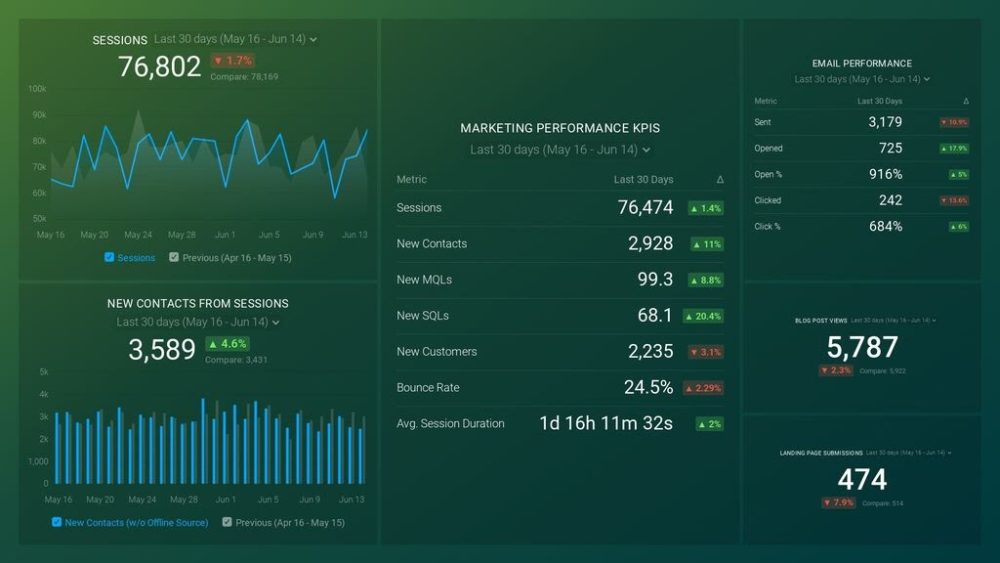
Like most marketers and marketing managers, you want to know how well your efforts are translating into results each month. How much traffic and new contact conversions do you get? How many new contacts do you get from organic sessions? How are your email campaigns performing? How well are your landing pages converting? You might have to scramble to put all of this together in a single report, but now you can have it all at your fingertips in a single Databox dashboard.
Our Marketing Overview Dashboard includes data from Google Analytics 4 and HubSpot Marketing with key performance metrics like:
- Sessions. The number of sessions can tell you how many times people are returning to your website. Obviously, the higher the better.
- New Contacts from Sessions. How well is your campaign driving new contacts and customers?
- Marketing Performance KPIs. Tracking the number of MQLs, SQLs, New Contacts and similar will help you identify how your marketing efforts contribute to sales.
- Email Performance. Measure the success of your email campaigns from HubSpot. Keep an eye on your most important email marketing metrics such as number of sent emails, number of opened emails, open rate, email click-through rate, and more.
- Blog Posts and Landing Pages. How many people have viewed your blog recently? How well are your landing pages performing?
Now you can benefit from the experience of our Google Analytics and HubSpot Marketing experts through a plug-and-play Databox template. It includes key metrics for tracking your leads and can be used as a standalone dashboard or as part of your marketing reports. You can try it during your free trial no setup headaches.
You can easily set it up in just a few clicks – no coding required.
To set up the dashboard, follow these 3 simple steps:
Step 1: Get the template
Step 2: Connect your HubSpot and Google Analytics 4 accounts with Databox.
Step 3: Watch your dashboard populate in seconds.
Common Issues You May Come Across When Setting Up Funnels in Google Analytics
Google Analytics can be difficult to use and navigate through even for the most experienced marketing experts.
This is why we prepared a list of some of the most common issues that you can come across during the setup process. Let’s check out what they are and what you can do to resolve them.
- Selecting the Wrong Conversion Path
- Not Using Descriptive Names for Funnel Steps
- Entering Incorrect Data While Defining Goal and Funnel Pages
- Using the Same Goal Page for Different Funnels
- Capitalization Issues
- Assigning a Monetary Value to Transactional Goals
- Using the Incorrect REGEX for Goal and Funnel Pages
- Not Understanding the Required First Step
- Not Testing the Funnel Set Up
- Payment Gateway Issues
Selecting the Wrong Conversion Path
To make the most out of funnel visualization reports, you first have to understand how exactly they work. Wrong funnels can cause all sorts of problems and your conversion rates won’t get any better.
Funnels should be used only when you have an established step-by-step process that your visitors should follow to achieve your website’s goal.
In case the goal is something that can be achieved through a variety of different methods, then a funnel won’t be necessary.
Not Using Descriptive Names for Funnel Steps
For describing funnel steps, you should always come up with some illustrative names. These names will show up in your funnel visualization reports so it’s important that you refer to specific things.
For example, names such as step-1, step-2, or step-3 won’t cut it. Instead, you should use names such as ‘Home’, ‘Product Category’, and ‘Product Details’.
The name should clearly describe the purpose of the funnel page.
Entering Incorrect Data While Defining Goal and Funnel Pages
Make sure to always use the correct data when defining the funnel page.
We mentioned this briefly in the implementation heading. When setting up your funnel page, you should only use the Request URL. This is what comes after the domain name.
This is the example we used – Instead of typing “www.business.com/productpage.html”, you should only add “enter/productpage.html”.
Using the Same Goal Page for Different Funnels
Some of you may be interested in setting up two or more different funnels for the same goal. This is useful in cases when you want to compare the conversion rates between two product pages (or any other page on the website).
To do this, you would have to use a different URL for each funnel and set two different goals in your GA account.
For instance, let’s say the URL of both funnels on the goal page is ‘/product-page/’.
This means that the first goal in the appropriate funnel setup will be something like ‘/service1/’ and for the second goal it would be ‘/service2/’.
Once you start collecting data for these two goals, you will realize that it’s exactly the same. This problem occurs because goal completions and conversion rates work separately from the funnel steps.
To resolve this issue, you should use a different goal page URL for the separate goals. For the first goal, it could be an URL such as ‘/product-page-service1/’ and for the second goal you can use ‘/product-page-service2/’.
After doing this, Google Analytics will start displaying the correct completion and conversion numbers for each goal and you can do the comparison with accurate data.
Capitalization Issues
Capitalization issues may seem like a minor problem, but if they go overlooked you may start looking for the problem in some other areas and lose your head trying to find them.
Plenty of websites use some form of uppercase/lowercase letters in their URLs. During the setup process, this could slip your mind and you will set up your funnel page with a typo in the URL. This later results in incorrect data and bad optimization decisions.
To make sure your goal page and funnel page URL match, you can use the “Case-Sensitive” checkbox during the implementation process.
Assigning a Monetary Value to Transactional Goals
Specifying a goal value for transactional goals is a huge mistake since it can lead to inflated revenue metrics in the GA reports.
Instead, you should use monetary value for non-transactional goals (newsletters, downloads, etc.). This triggers Google Analytics to calculate the goal value per session and overall ROI.
Here are a few things you should keep in mind:
- Goal value is a monetary value that should only be appointed to non-transactional goals. This metric calculates what you get once you achieve the set goal.
- Transactional conversions are calculated each they occur during a Google Analytics session.
- Non-transactional conversions are counted only once within a single Google Analytics session.
Using the Incorrect REGEX for Goal and Funnel Pages
Establishing an incorrect regular expression (REGEX) for goal and funnel pages is probably one of the most frequent and complicated problems.
You will know you have a REGEX problem if the continuation rate from one stage to the next is always displayed as 100% in the funnel report. The reason this occurs is because there are probably a few funnel steps that match the same web pages.
To put it simply, REGEX problems occur when multiple funnel pages contain the same character (such as ‘/’). The best way to fix this problem is to re-write the REGEX for each funnel page individually.
As we said, this is probably the most complicated issue you can run into. For more information on how to re-write REGEX, you should check out this official guide from Google Support.
Not Understanding the Required First Step
A lot of people get confused about what enabling “Required” on the first step actually does.
When you mark “Required” on the first step, the funnel report will display only conversions that have gone through the required step. This means that the conversion rate in a funnel that doesn’t have a required first step will display different numbers.
But, you can also arrange that the order in which a user viewed the required funnel page doesn’t matter, as long as it results in a conversion. In other words, a website visitor doesn’t have to visit the required funnel page first.
For instance, you can set up your home page to be the required funnel step. In this scenario, funnel visualization reports will only include conversions in which a user viewed the home page of your website, regardless of the order.
Keep in mind, there is also the option of setting up multiple funnels for one website goal with the “Required” funnel step. This can provide you with more detailed insight into conversions. However, this kind of setup can be a bit complicated to follow, which is why we recommend the goal flow report as a better option.
Not Testing the Funnel Set Up
Once you are finished with setting up your funnels, always make sure to test them out first.
You don’t want to end up in a situation where you check your conversion funnel after a few days and it comes up empty.
Funnel visualization reports only show data that occurs after the implementation, they can’t show data retroactively. The data you could’ve used for analysis and optimization in the few days before resolving the issue will be lost forever.
Some of the common problems are typically capitalization issues or incorrect REGEX for the funnel pages. These issues disrupt the data reports, leading to inaccurate feedback.
To test REGEX, you can use the “Matching RegExp” box in the reporting interface.
To test the goal page, you can go to the “Verify this Goal” link on the funnel page.
Payment Gateway Issues
If you notice that your visitors are dropping off at the last conversion step and then returning to the “Thank You” page, it’s almost certain that you have a payment gateway issue.
This issue occurs because a lot of visitors use some sort of third-party website to approve the payment and then return to your website once they do it. The funnel report will display this action as a user drop off.
You can fix this by including a third-party website or even a payment gateway domain in the GA referral exclusion list.
Another method you can use is to integrate your cart with a specific payment system. This way, users won’t need to go to any third-party websites and the funnel reports will show accurate data.
How Do You Analyze a Funnel in Google Analytics?
Once you are finished with setting up your funnel visualization reports in GA, we can move on to the fun part – analyzing the funnels.
To make accurate CRO decisions, you have to use the right methods in the analysis process. Misinterpreting the data you get in your funnel reports can lead to wrong conclusions and bad marketing decisions.
Here are some of the best funnel analysis points you should know before you start interpreting the reports.
- The funnel visualization report does not report on users but unique pageviews
- The funnel visualization report does not always show the actual order in which the funnel pages were viewed
- The funnel visualization report does not show loopback
- Funnel visualization report shows continuation only from the funnel pages
- Google Analytics reports the funnel pages in the order they were set up, not in the order they were actually viewed
- Funnel visualization report can show multiple unique pageviews for a single user
- The funnel visualization report can backfill certain skipped funnel steps
- Repeating a goal funnel in a single GA session does not alter the conversion count
- Users repeating the sales funnel alter the conversion count
- The funnel visualization report shows data only going forward
- The date comparison feature of GA doesn’t work on funnel visualization report
- You cannot segment the funnel visualization report via custom segments
- Always segment the Google Analytics funnel data before you interpret it
- The funnel visualization report can suffer from data sampling issues
- Avoid using small time frames or small data sets for your funnel analysis
- There is no impact of funnel steps on conversion rate and conversion volume
- The funnel conversion rate is not the same as the goal conversion rate or ecommerce conversion rate
The funnel visualization report does not report on users but unique pageviews
The number you see under ‘Completed Purchases’ is often misinterpreted as the number of people who completed a goal conversion.
This isn’t the case – the number actually represents the number of unique pageviews.
A unique pageview calculates the times a page was viewed in a separate session. This means that if one user goes to the same page multiple times in one web session, the unique pageview will still be 1.
Reversely, if a person went to the home page four times in one session, the number of pageviews will be 4.
Additionally, unique page views don’t represent the number of users.
The number of unique page views is not equal to the number of users. One user can open the same page multiple times during multiple sessions which leads to multiple unique pageviews.
Let’s say that a user opened the home page four times in his first GA session and five times in a second GA session. The number of unique pageviews will be 2, even though it’s only 1 user.
The funnel visualization report does not always show the actual order in which the funnel pages were viewed
The funnel reports in GA track the order in which you set them up; they don’t track the actual order in which the visitors viewed the funnel pages.
Google Analytics only tracks whether the funnel page was viewed during a session. If it was, it will be reported based on the existing order.
Loopbacks can’t be included, which means any activity that involves going back to a previous step won’t be captured.
Visitors don’t always follow the order you set up, they can enter the funnel or exit it halfway through the process.
The funnel visualization report does not show loopback
As we just mentioned, the funnel visualization report can’t capture loopbacks.
Imagine this scenario:
- A visitor lands on your website to the ‘Home page’.
- They go to the ‘Product page’ section.
- They come back to the ‘Home page’.
- For some reason, they refresh the ‘Home page’.
All of these activities occurred in one GA session.
In this conversion path, there were two loopbacks. The first one was when the visitor navigated back to the home page from the product page. The second was when they refreshed the home page.
This is how it would be displayed in GA:
- ‘Home page’ entrance
- Continuation to ‘Product page’
- ‘Product page’ exit
- ‘Home page’ exit which leads back to the ‘Home page’
Funnel visualization report shows continuation only from the funnel pages
To better explain continuation, let’s take this scenario as an example:
- A visitor lands on your website through a Product-X page
- They go to the ‘Home page’
- They go to the ‘Shopping Cart’ page
- They go to the ‘Contact Us’ page
In this case, we can see that there weren’t any loopbacks during the session since the visitor didn’t return to any previous steps or pages.
This is how the funnel visualization report in GA would track it:
- Product-X page to ‘Home Page’ – Entrance (there isn’t a continuation from Product-X page to home page since the Product-X page isn’t a funnel step)
- ‘Home page’ to ‘Shopping cart page’ – Continuation
- ‘Shopping cart page’ to the ‘Contact Us’ page – Exit (if the ‘Contact Us’ page isn’t a funnel step, the report won’t track it as a continuation but as an exit)
Google Analytics reports the funnel pages in the order they were set up, not in the order they were actually viewed
We briefly mentioned how GA funnel reports only track data in the order you set up, instead of the order in which they were viewed.
Let’s use this example for an explanation:
- A visitor lands on your website through a Product-X page
- They go to the ‘Shopping Cart’ page
- They go to the ‘Home page’
- They go to the ‘Contact Us’ page
All of these activities took place in a single GA session. We can see that there weren’t any loopbacks in the conversion path since the visitors didn’t return to any previous steps.
The funnel report will show this:
- Product-X page to ‘Home Page’ – Entrance
- ‘Home page’ to ‘Shopping cart’ page – Continuation
- ‘Shopping cart’ page to ‘Contact Us’ page – Exit
Google Analytics is only interested in checking whether a funnel page was viewed. If it was, it will display the view in the order that you set up, no matter if the visitor viewed the funnel page in a different order.
Funnel visualization report can show multiple unique pageviews for a single user
You should keep in mind that a single user can create multiple unique pageviews on a funnel report.
Let’s say that the user’s first GA session looked something like this:
- They landed on the website through the ‘Home page’
- They opened the ‘Shopping Cart page’
They left the website but came back after a short while. This is the second GA session:
- They landed on the website through the ‘Home page’
- They opened the ‘Shopping Cart page’
- They opened the ‘Checkout page’
No loopbacks were captured since the user came back to the home page and shopping cart page in a separate GA session.
However, because these pages were viewed in two separate sessions, the unique pageviews for both of them will be 2. At the same time, the unique pageviews for the ‘Checkout page’ will be 1 since the user only opened it in one GA session.
The funnel visualization report can backfill certain skipped funnel steps
To better explain backfills, we will use this conversion path as an example:
- A visitor landed on your website through the ‘Home page’
- They opened the ‘Checkout page’
- They opened the ‘Order Review page’
As we can see, the visitor skipped the ‘Shopping cart page’.
In cases like this, when a visitor skips one of the steps, the funnel visualization report uses a “backfill” for the skipped step.
If the shopping cart page comes after the ‘Home page’, the funnel visualization report will automatically backfill it.
This is what the report will show:
- ‘Home page’ entrance
- ‘Shopping Cart page’ continuation
- ‘Checkout page’ continuation
- ‘Order Review page’ continuation
Repeating a goal funnel in a single GA session does not alter the conversion count
Take this scenario as an example:
- A visitor landed on the website through the Home page
- They opened the ‘About Us’ page
- They opened the ‘Membership page’
- They opened the ‘Signup page’ (the goal page)
- They returned to the ‘Home page’
- They returned to the ‘Membership page’
- They returned to the ‘Signup page’ again (this time on behalf of a friend e.g.)
We can see that the visitor completed the signup (which is the goal conversion) twice. However, the funnel visualization report will capture this as only one goal conversion since it happened in a single GA session.
This means that no matter how many times a visitor completed the goal conversion in a single GA session, your funnel report will display it as only 1 signup.
If the visitor were to complete the goal conversion in a second session, then it would count as 2 conversions.
Users repeating the sales funnel alter the conversion count
To explain how the sale funnel works, we will use this conversion path example:
- A visitor landed on your website through the ‘Billing page’
- They opened the ‘Shipping page’
- They opened the ‘Payment page’
- They opened the ‘Purchase page’ (goal page)
- They returned to the ‘Billing page’
- They returned to the ‘Shipping page’
- They returned to the ‘Payment page’
- They returned to the ‘Purchase page’ (goal page)
According to this conversion path, the user has repeated the sales funnel twice and placed two orders.
Sales funnels will increment the additional order (transactional goal) in the funnel report every time a single user places new orders. Whether the order was made in the same GA session or not is irrelevant in this case.
The funnel visualization report shows data only going forward
Funnel visualization reports don’t work retroactively. This means that historical data from your website won’t be available in the new funnels you set up.
Once you create a new funnel in GA, you can only gather data for activities that occur going forward.
Also, if you make any changes to the funnels that you already have in your GA, they won’t be applied to the previous data.
The date comparison feature of GA doesn’t work on funnel visualization report
Funnel visualization reports can’t be integrated with the GA date comparison feature. In other words, you won’t be able to see the difference between the various funnel steps.
The only difference you can capture will be the one regarding the total conversion rate.
You cannot segment the funnel visualization report via custom segments
Funnel visualization reports can’t be segmented on Google Analytics by using the custom segments. But, you can use the goal flow report or create filtered views for segmentation.
For instance, if you are interested in obtaining data about the organic search traffic converts on your website, you can follow these few steps:
- Make a filtered view that you will use for organic search traffic
- Include goals and funnel pages inside the filtered view
- Let the data pile up in the funnel visualization report for around a month
- After a month has passed and enough data has been gathered in the report, you can use it to analyze your goals and sales funnel for organic traffic
Always segment the Google Analytics funnel data before you interpret it
For instance, let’s say that your website had 5000 visitors, of which 50 (1%) proceeded to the shopping cart page.
Naturally, the more visitors you can get on the shopping cart page, the more sales your website will record.
The issue is, we don’t really know which majority of visitors are exiting the funnel (organic search visitors, paid search visitors, email campaign, or social media visitors).
This is why we need to segment the funnel. You will want to know the main reason visitors decide to exit a funnel and understand the different traffic converts.
Here is how you can segment the funnel data:
Step 1: Use these traffic sources when creating filtered views:
- Organic Search Traffic
- Paid Search Traffic
- Referral Traffic
- Direct Traffic
- Social Media
- Mobile traffic
- Tablet Traffic
- Desktop Traffic
Step 2: Include the goals and funnel pages in each filtered view
Step 3: It will take approximately one month for the data to pile up in the funnel visualization reports. Once the data piled up, you can start analyzing the goals and sales funnel for different traffic sources.
The funnel visualization report can suffer from data sampling issues
Running into data sampling issues isn’t anything out of the ordinary, but if you run a high-traffic website, you should see to these issues immediately.
In case Google Analytics is doing a bad job with sampling data, the metrics you receive won’t be of any use. They can be anywhere from 10%-80% inaccurate.
Google Analytics will automatically sample data if your funnel visualization reports that count more than 100k sessions.
You can fix data sampling issues by running funnel reports in shorter time frames. It’s recommended that you use time frames with less than 100k sessions.
Avoid using small time frames or small data sets for your funnel analysis
Making marketing decisions based on smaller time frames and small data sets can be a huge mistake. This is because establishing the best conversion path and optimizing the conversion funnel can only be done after you have collected at least a few months’ worth of data.
Statistically, the sample size of smaller data sets isn’t very significant or relevant for making future marketing strategies.
One month of data is the bare minimum you need in your funnel reports before you even consider any optimization methods. This is also the reason why low-traffic websites struggle with getting more conversions in a specific time frame.
There is no impact of funnel steps on conversion rate and conversion volume
The funnel pages you create in GA don’t have any kind of impact on conversion rates (goal conversion rate and ecommerce conversion rate) and conversion volume (number of orders or goal completions).
The only thing these funnel pages affect is the visualization of your funnel reports.
The funnel conversion rate is not the same as the goal conversion rate or ecommerce conversion rate
The last thing we would like to mention is that funnel conversion rates differentiate from goal conversion rates and ecommerce conversion rates.
Shortly, a funnel conversion rate calculates what percentage of funnel sessions ended up as successful conversions (goal conversions for example).
You can use this equation to calculate the funnel conversion rate: (Total Conversions/Total Funnel Sessions) x 100
How to use Funnel Exploration Report in Google Analytics 4
Ever since Google Analytics 4 got released in 2020, it brought some new and exciting changes to the community.
As far as funnel reports go, Google Analytics 4 has allowed users to build them on the fly and fixed a lot of issues that were causing headaches in Universal Analytics.
For example, it resolved issues with capturing the number of visitors that viewed a specific product and adding/removing certain steps in the funnel.
Let’s review some of the basics on how to use the funnel exploration report in GA4.
Main Components
You can check out the main components of Google Analytics 4 by going to Explore > Funnel Exploration (or ‘Blank’).
Once you open this section, you will get a sample report with certain configurations. If you opened ‘Blank’, you get an empty piece of paper where you can add details from scratch.
There are 3 main parts of the funnel exploration report interface:
- Variables – There aren’t any similarities with the GTM variables. The GA4 variable section serves as a place to store data that you plan on using in future reports. It includes metrics such as date range, segments, and dimensions.
- Tab Settings – The tab settings section allows you to modify the look of your report. The different options in tab settings include visualization, segment comparisons, funnel steps, elapsed time, funnel breakdown, next action, filters, etc.
- The Output – This is the final version of the funnel exploration report you created through the configuration process. Once the report is created, you can start gathering data and analyzing it.
Some additional options that GA4 offers are ‘Show elapsed time’, ‘Next Action’, ‘Trended Funnel’, and ‘Exploring Users’.
Open vs Closed funnels in Google Analytics 4 (How data is calculated)
In Google Analytics 4, you can set funnels to be either open or closed.
The closed funnel is the default option and it sets up only one entrance to the funnel for the visitor – through the first step. They can’t enter the funnel through any other steps.
Inversely, with open funnels, visitors can enter the funnel through any step.
Funnel exploration reports count drop-offs as soon as visitors leave the website at a certain step. For example, let’s say that a visitor enters the first step, skips the second one, and completes the third step. In this scenario, the last step won’t be counted since the drop-off will be reported in the first step.
In short, in Google Analytics 4, visitors cannot skip funnel steps.
Build Custom Google Analytics Multi-Channel Funnel Metrics in Databox
Databox has over 110 Google Analytics multi-channel funnel metrics that allow you to dig deeper into the conversion path your prospects take before becoming eventual subscribers, leads, or customers.
Available in Query Builder, you can use multi-channel metrics to analyze the path your website visitors take in meeting the custom goal criteria you’ve set in Google Analytics.
Here’s which multi-channel funnel metrics are available in Databox and how to use them.
What Are Google Analytics Multi-Channel Funnel Metrics?
Multi-Channel Funnel reports help you understand how your marketing channels work together to drive goal conversions and/or sales.
While conversions and transactions in Google Analytics are attributed to the last touch a user takes, Multi-Channel Funnel metrics analyze the entire path your users take and allow you to understand which channels initiate engagement, and which ones actually help close.
They help you answer questions like:
- Is Paid Search an initiating or a closing channel?
- How much time has passed since a user’s first and final interaction?
- How many, and which channels, did users engage in before purchase?
The Multi-Channel Funnel reports are generated from conversion paths that led up to the conversion/transaction. You can find those reports in Google Analytics under Conversions where you then select Multi-Channel Funnels.
Instead of your channels being credited only to the last touchpoint, in these reports they’re credited according to the roles they play in the entire conversion process.
- Assisted conversions include all the channels that appeared anywhere – except as the final interaction – on a conversion path.
- Top Conversion Path report shows the entire conversion path your customers take on their way to a purchase.
- Time Lag and Path Length give you insights on how long it usually takes users to become customers.
For your Multi-Channel Funnel reports to work, you need to set up goals and/or e-commerce tracking in Google Analytics.
And for the reports to help you figure out which of your advertising efforts are working effectively and in benefit of your goals and transactions you can select a specific goal/e-commerce tracking that you’d like to report on.
Databox Query Builder: Which Multi-Channel Funnel Metrics Are Available?
We’ve added a Multi-Channel Funnel option in Query Builder, meaning you can go even deeper with your Google Analytics conversions.
Here are all the Google Analytics Multi Channel-Funnel metrics that we’ve added to Query Builder as well as the associated dimensions that you can use to dig for even deeper insights.
- First Impression Value
- Impression Assisted Conversions
- Impression Assisted Value
- Total Conversions
- Total Conversions Value
- Assisted Conversions
- Assisted Conversions Value
- First Interaction Conversions
- First Interaction Value
- Last Interaction Conversions
- Last Interaction Value
And they can be further filtered by these dimensions:
- MCF Channel Grouping
- Source
- Medium
- Source Medium
- Campaign Name
- Keyword
- Conversion Goal Number
- Conversion Type
- Path Length
- Time Lag.
In order for Multi-Channel Funnel reports to have data, you must define goals and/or collect e-commerce transaction data in Google Analytics.
How to Use Multi-Channel Funnel Metrics
Conversions and/or purchases don’t always happen on the first visit to your website.
That’s why attribution is important. But, attribution isn’t as simple as assigning credit to the first or last touchpoint in a person’s journey.
To really understand how people engage with your brand and the impact your marketing and sales efforts have on new business, you need to understand how people engage across all the channels your brand is present in.
For example, while someone may purchase from your brand after seeing and clicking a popular tweet, they may have visited your website weeks ago via a blog post they found in Google.
Or, maybe they’ve been on your email list for several months and have engaged there, too.
Multi-channel funnel metrics help you analyze how all of the different touchpoints contribute to sales.
Let’s walk through how you can use multi-channel metrics to analyze your channels in Databox.
Let’s say you’re interested in seeing the involvement of all channels in your users’ path to conversion. In order to do that, you’d need to track the First, Assisted, and Last Conversion split up by MCF Channel Grouping.
The First Interaction Conversions tell us the number of sales and conversions that specific channel initiated.
With Assisted Conversions, you’ll understand how users engage in specific channels when gathering more information.
And, the Last Interaction Conversion is the channel where the user converted and/or made a purchase.
The first step to tracking the conversion path is to create custom metrics for First, Assisted, and Last conversions by MCF Channel Grouping in Query Builder.

Once all three metrics are created, you add them to an Advanced table visualization on your dashboard where they’re outlined next to the other.

That’s how you get a complete visualization of how all of your channels are working together.
Now what? The analysis.
Let’s look at the data above. For an SEO focused company, it’s no surprise that organic search is leading on all fronts. Having high ‘direct’ figures is also a good sign, as it shows that people may know the company and the brand. We can see the referral numbers rising, presenting an opportunity to leverage that channel further––run co-marketing campaigns with partners, build backlinks, etc.
There’s also more that can be done on the (Other) front. You can look up what exactly is covered under that in your GA account by clicking on (Other) in your MCF Assisted Conversions report. That can be any CTA’s or Campaigns that you have Goals set up for. That way you’re able to identify exactly which projects have the potential to help you grow.

If you’re running advertising campaigns, this visualization would be extremely valuable. You can then build custom metrics (First, Assisted, and Last interaction Conversion) based on the Campaign Name which would help you decide how to allocate your paid spend.

Any Multi-Channel Funnel Metric and Dimension that’s available in Query Builder helps you dig deeper and make better decisions moving forward.
Just because some may have a high last conversion rate, others might have a large assisting one, meaning they still have a big influence on users’ decision-making process.
That’s just a small part of what you can do by tracking Multi-Channel Funnel Metrics. Dig in further to better understand how your marketing channels contribute to conversions and sales.

Understand How Your Marketing Channels Contribute to Conversions & Sales with Databox
Even though funnel visualization reports can provide you with a wealthy amount of useful data, it can sometimes be overwhelming to analyze all the different funnel performances.
Luckily, there is marketing reporting software that can make this process much easier and less time-consuming.
Databox allows you to extract the data you receive from the funnel stages and gather it in one comprehensive report.
With over 100 Google Analytics funnel metrics available, our customizable dashboards will allow you to modify your reports in any way you deem fit.
By visualizing all of the most important metrics, you will know exactly which conversion stages are doing well and which need to be optimized.
Understanding which of your marketing channels bring the most value to conversions has never been easier.
Sign up here for a free trial and make the most out of your funnel visualization reports.


