


Table of contents
At Databox, we believe in making our users feel badass, and a big part of making that happen is carefully listening to candid feedback.
So thanks to all of you who have already helped us by sharing your input – keep it coming! In our latest release, you’ll see a number of nifty new features that have been inspired by you, our users. Here’s a look at what’s new.
Easier at-a-glance views
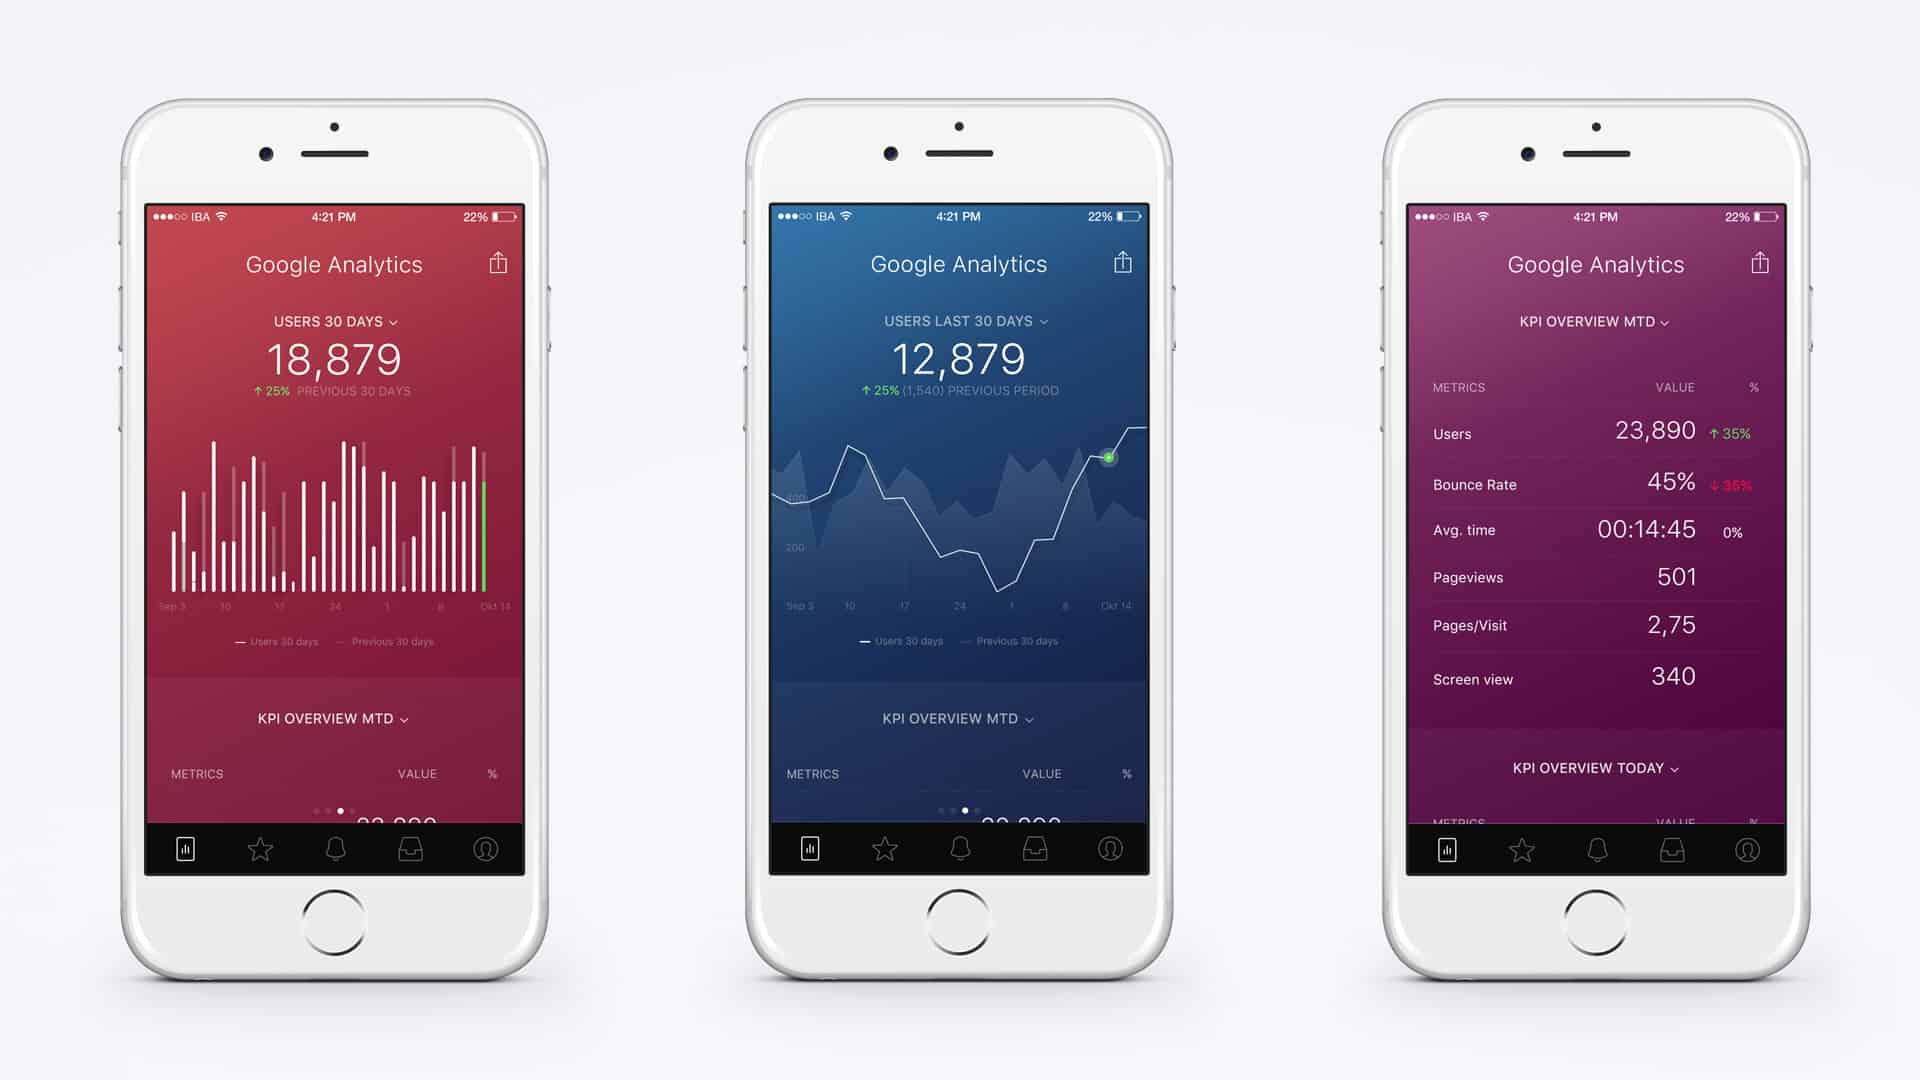
We’ve made it easier than ever to tell when something changes with your data. Now, the percent change for any metric will show as green if it’s an increase and red if it’s a decrease. With just a quick glance you’ll be able to get a good read on the status of your business.
In addition, we’ve also made some changes to the look of our bar, line, and pie charts to make your data even clearer to see.
Weekly Scorecard
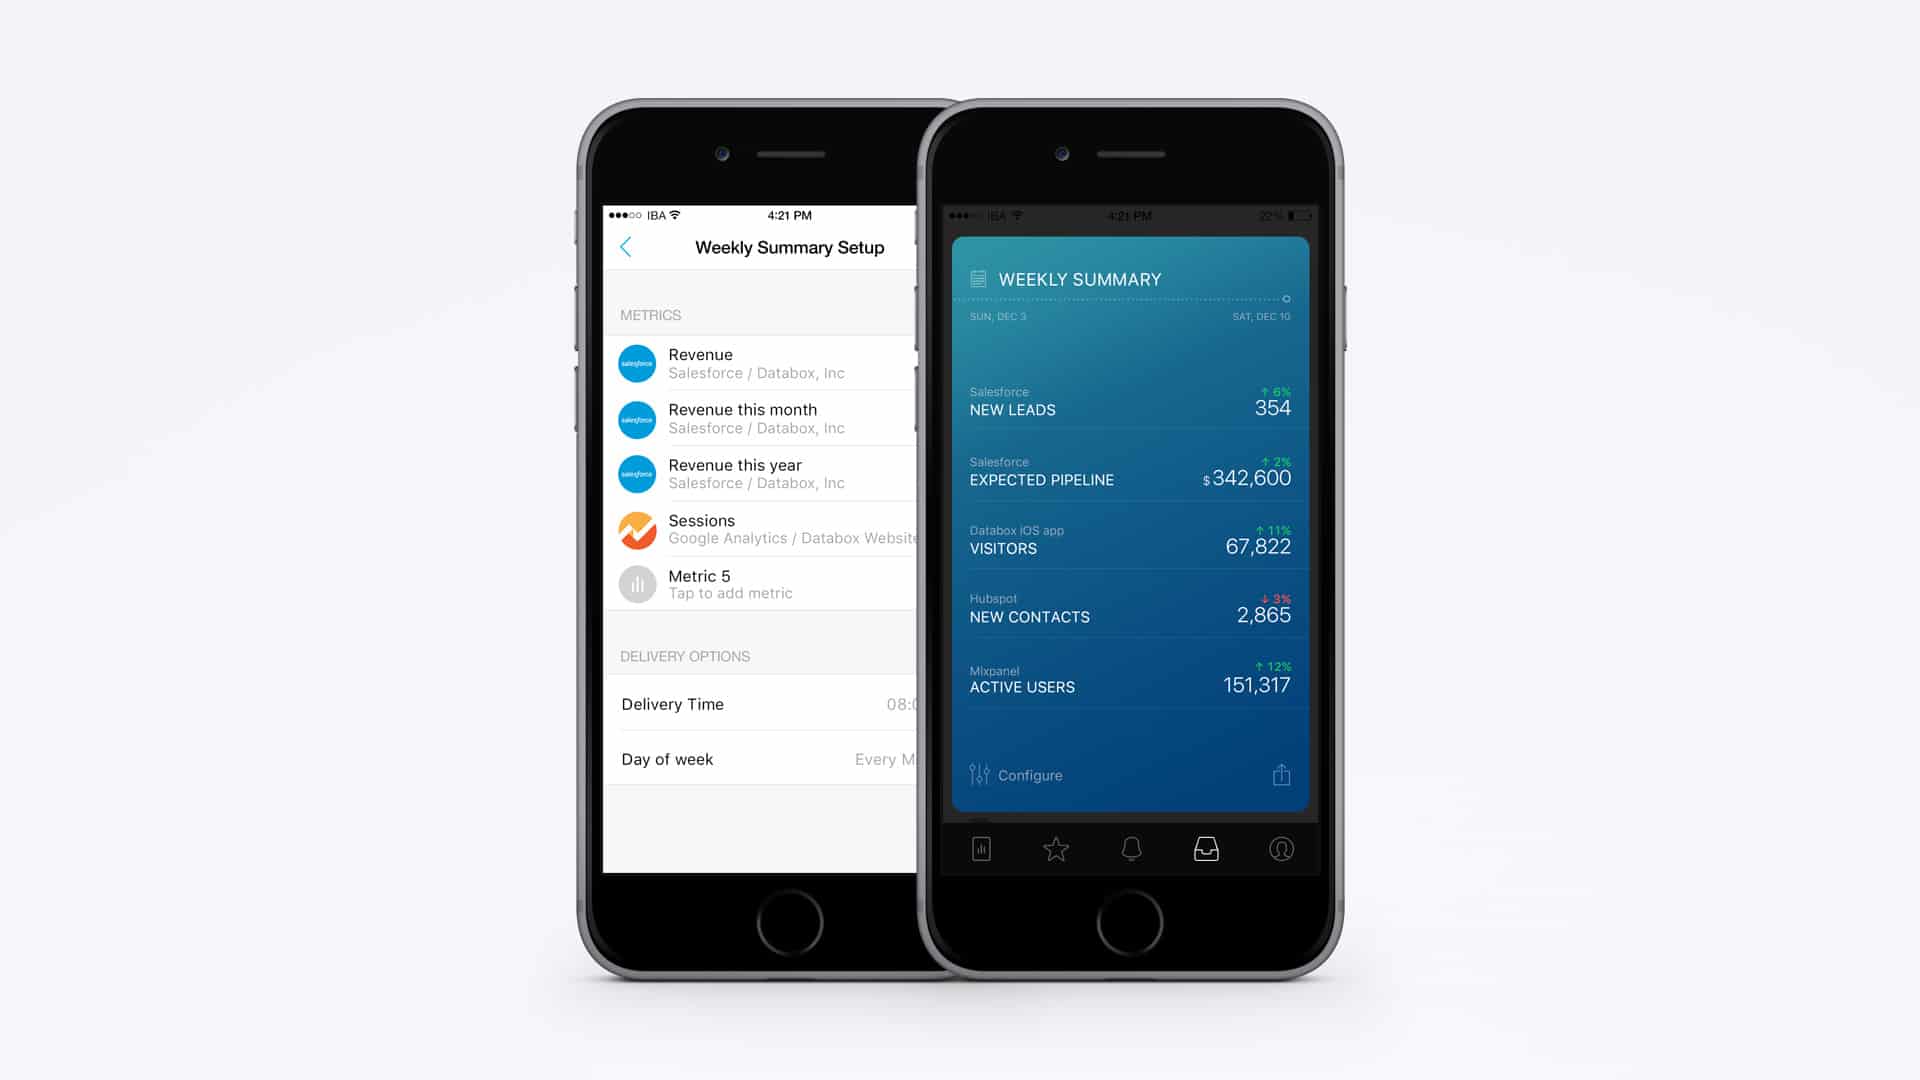
If you’re like me, you rely on your daily scorecard for a morning briefing on where the business stands. But what we heard was that a lot of folks were also looking for a weekly rollup of how this week compared to last week. So now you can get just that with the addition of our Weekly Scorecard. As with your Daily Scorecard, just select which metrics you’d like to see and when you’d like your scorecard delivered, right from the mobile app. Voila!
The more the merrier
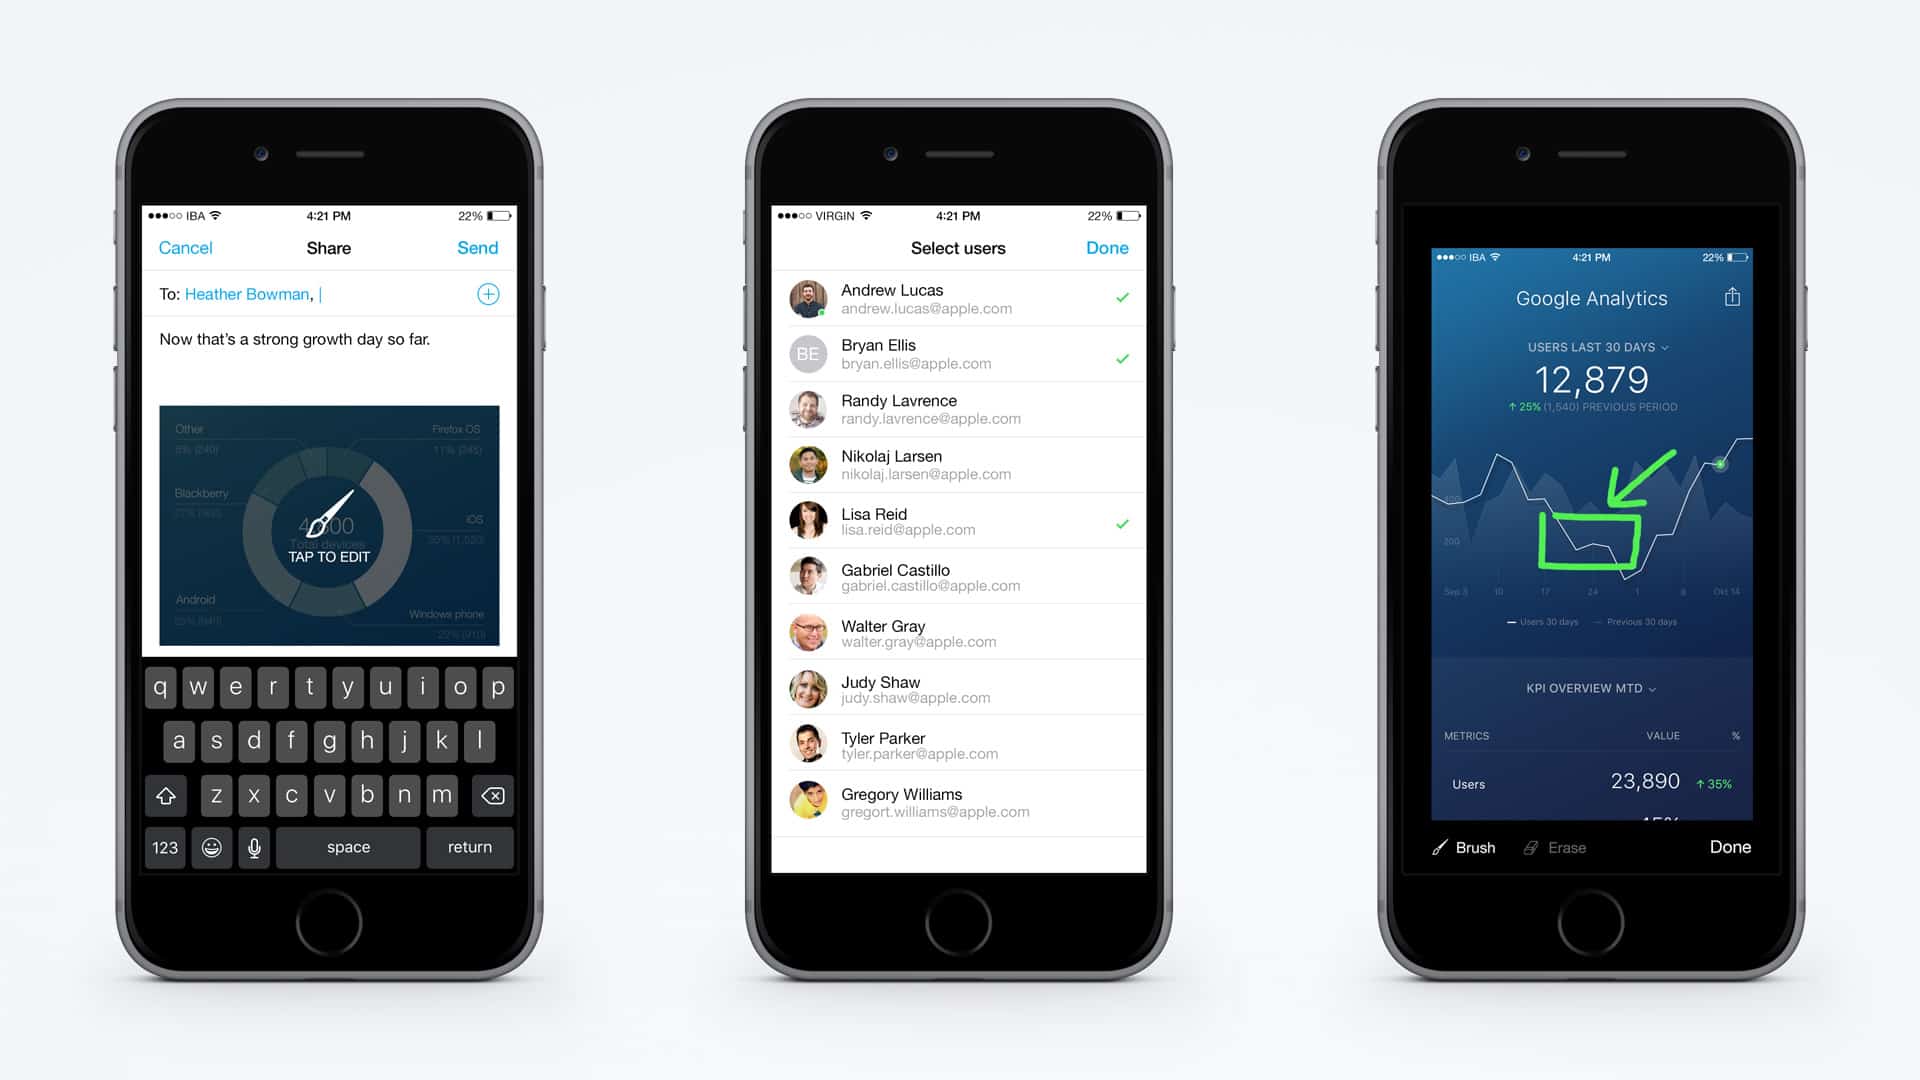
They always say data is more fun with friends, right? (Ok, well that’s what we say, at least!) That’s why we’ve made it even easier to share your data with multiple people — regardless of whether or not they use Databox. Now, just type their names or email addresses into the “To:” bar, and you’ll be good to go. And of course, you can still mark up or annotate anything that you’d like to highlight before sending.
Want to check out all the new improvements we’ve made? If you’re already using Databox, just download the latest version from the app store. Not yet a Databox user? Request an invite to our early access program!
And as always, if you have any questions or suggestions, don’t hesitate to let us know at hi@databox.com!


