


Table of contents
Data at your fingertips is only a click away.
Isn’t it a mess when your conversations about data and the data itself are in completely different places?
There’s no doubt about it – copying and pasting images, switching between windows, and retyping data is a total PITA. That’s why we’ve introduced Databox for Slack! Now you can view data in context – right where the conversation is happening.
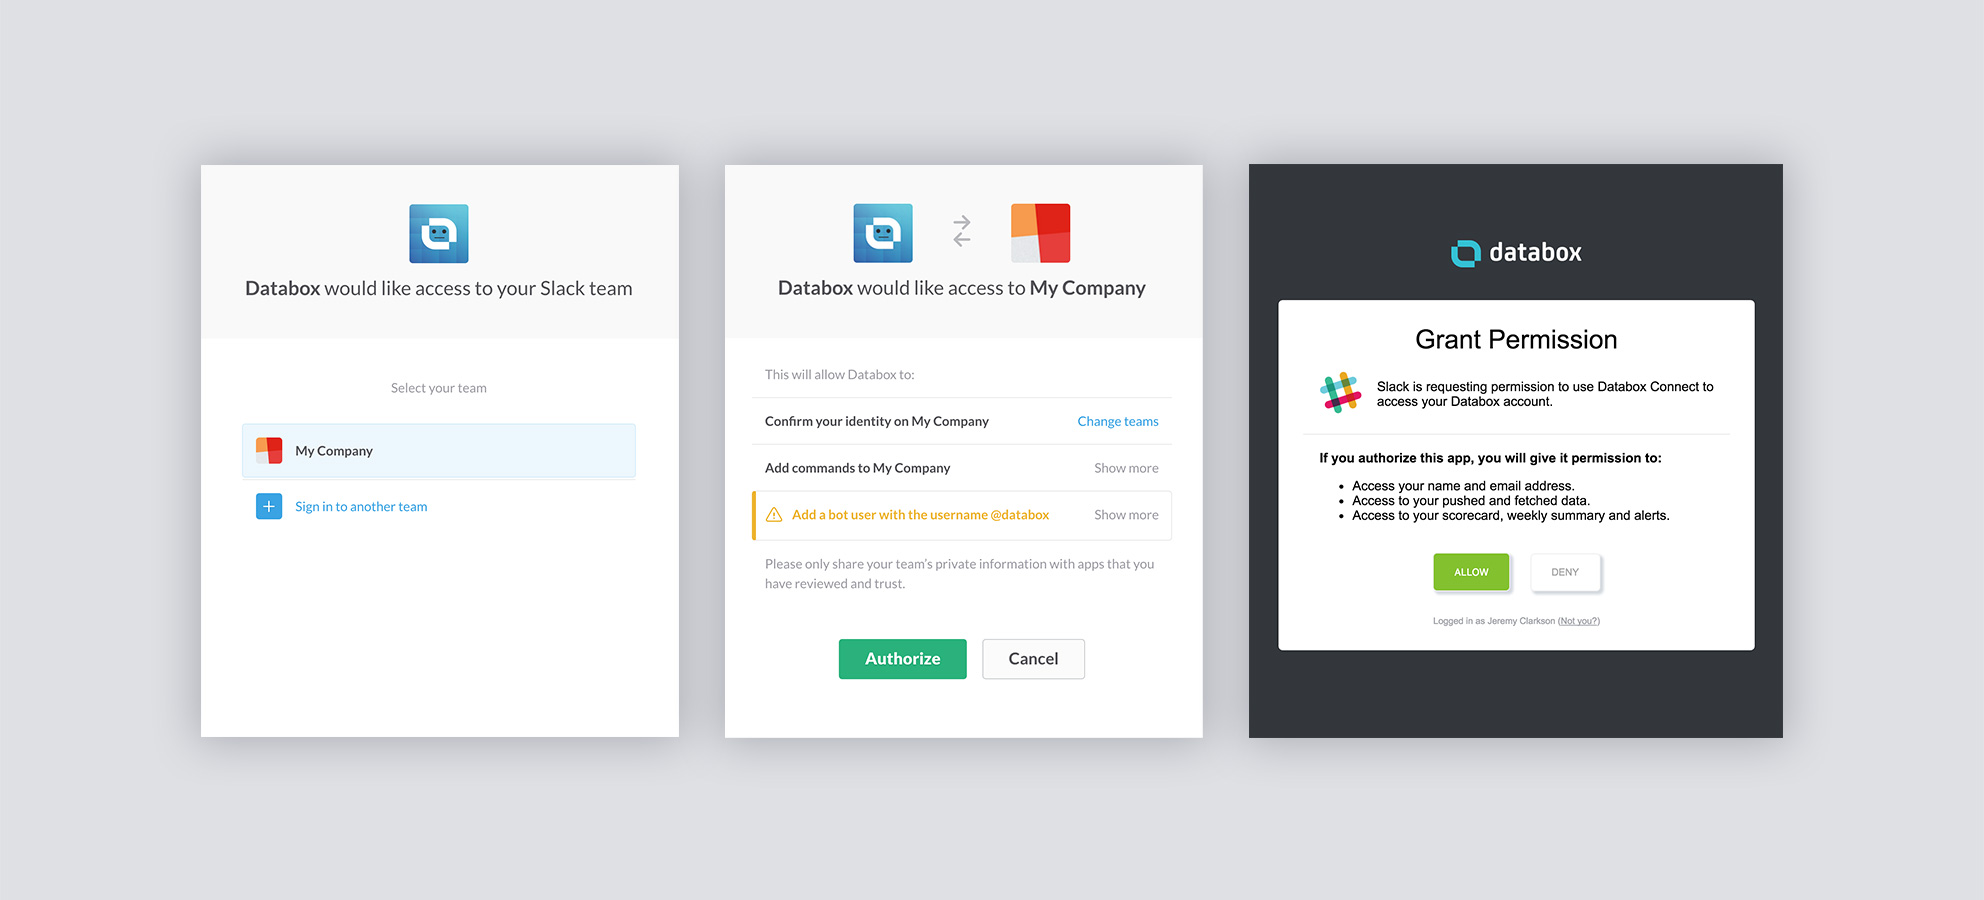
Viewing your Databox data right in Slack is a piece of cake. First, just add the Databox bot to your Slack team. Then you’ll be prompted to authorize access so that Databox and Slack can communicate.
Simple commands deliver metrics when you need them.
Once you’re connected, you can use slash commands or talk directly to the bot (private conversation). Here are some of the quick and easy commands you can use to access your metrics right from Slack:
/metricslists all available metrics/metric [your metric] [period]reports the data for the requested metrics. You can also use the following optional short codes for periods:24h(last 24 hours),1d(today),-1d(yesterday),-1w(last week),7d(last 7 days),WTD(week to date),14d(last 14 days),30d(last 30 days),-1m(last month),MTD(month to date)…/alertslists the 5 most recent triggered alerts for your account/scorecardshows your latest scorecard with up to 5 of your key metrics/weeklydelivers your latest weekly summary/helplists available commands
And voila! Data at your fingertips is only a click away. You’ll be able to instantly access metrics from any of your Databox-connected data sources, right from Slack. Check it out today!


