Table of contents
When you wake up in the morning, what story do you tell yourself about the purpose of your work?
Is it something along the lines of: “I am laser-focused on helping the company increase revenue by 10% like we talked about in the last company-wide meeting.”
Not that? What about aiming to achieve a departmental goal, like “Increase site traffic by 30% compared to this quarter last year”?
I imagine it’s not that either. You probably joined the company for a more aspirational reason. Maybe you support the company’s mission. Or you want to work for a brilliant leader in your field.
The metrics are just a way to measure your progress towards achieving that goal. They are not the goal itself.
This is where OKRs, or Objectives and Key Results, become useful. When your company talks about quarterly or annual goals, the OKR system enables every employee to connect with the overall mission so they don’t lose interest after hearing about boring metrics over and over again. Or, even worse, they could forget their purpose because there are no goals at all.
OKRs were created by Andy Grove, the famous CEO of Intel. They started to gain popularity in 1999, when John Doerr, a venture capitalist, helped Google implement OKRs to manage a rapidly scaling team.
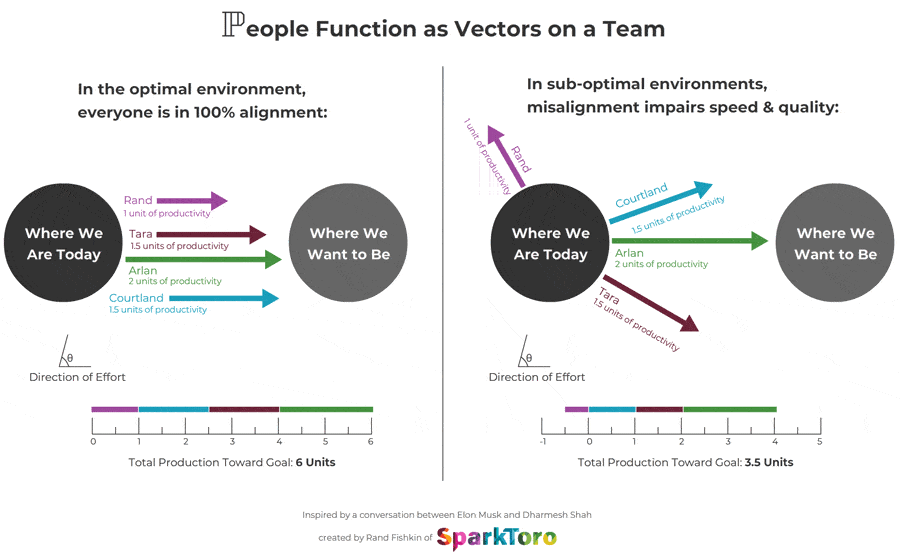
Credit: SparkToro
In both cases, the company leadership needed a way to communicate goals and make it clear how each department could contribute.
Leaders need “every person rowing in the same direction”… or every vector pointing in the same direction, if you prefer the diagram above.
If each department formed their own goals, then all employees would be handicapped by the lack of alignment. Employees would be disappointed when they failed to accomplish their personal goals.
Here’s how to start using OKRs at your company.
What Are OKRs?
Objectives and Key Results bind an audacious goal to a series of actionable steps. Every level of the organization can create one–from management to teams to individual contributors.
Generally, no team or individual should have more than 5 total objectives and 5 key results for each objective. An individual should have closer to 1-2 objectives, while an entire department might have 5 objectives.
An objective is a qualitative, ambitious goal that will be challenging to accomplish.
The key results are the steps that need to be taken to hit that goal, and they are always quantitative.
The key results are hypothesized steps that will lead to the accomplishment of the objective. Since the objective is qualitative and can’t be measured, you can’t guarantee that the results will help you accomplish the objective by the end of the quarter.
Here’s an example from Buffer:
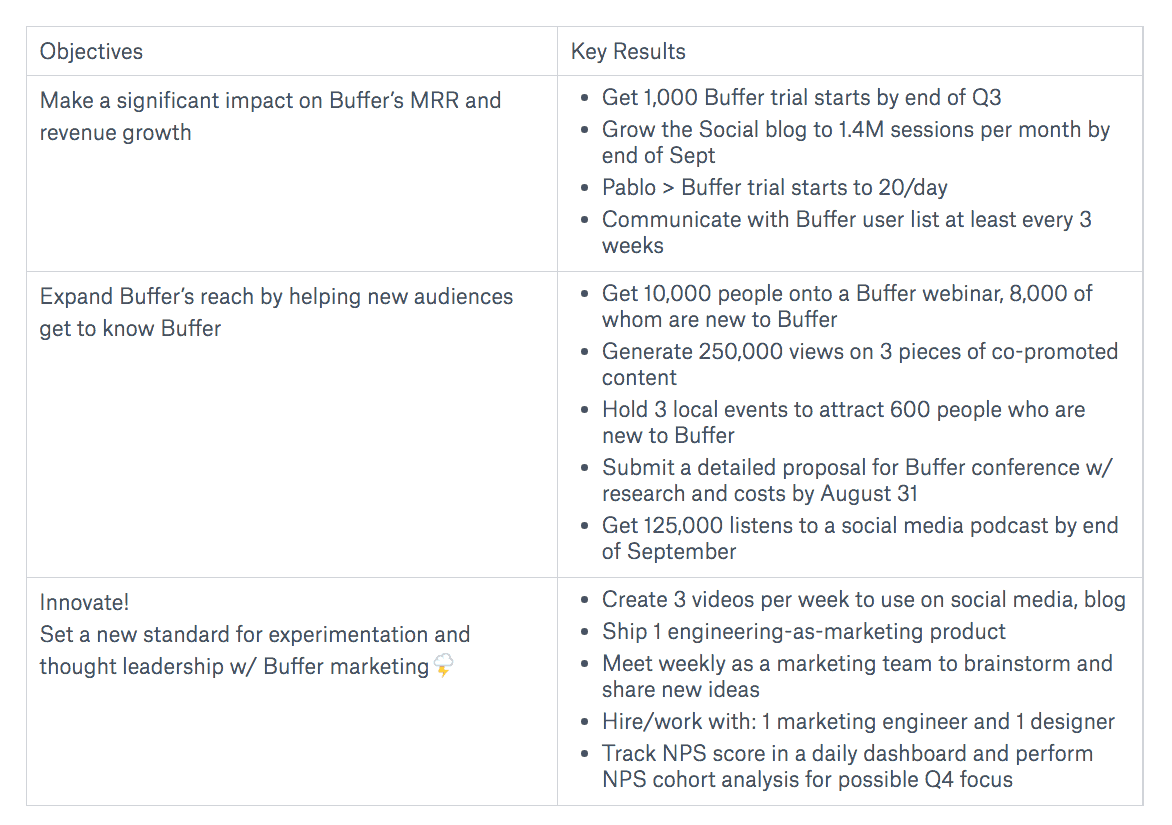
These are OKRs for the Buffer marketing team. On the left side, you can see how this can become difficult.
In the first objective, Buffer’s marketing leaders can’t definitively say whether they have made a “significant impact”. After all, they could be using an entirely different marketing strategy that helps them grow 20% faster.
That isn’t the point. If they can accomplish the key results on the right side, they are hypothesizing that they will hit their objective and see a large impact on revenue.
There is one more important rule about setting up OKRs. Managers should only expect that their team will achieve 60-70% of key results, according to Google. If the achievement rate is higher, that means that the key results were too easy to accomplish.
This also gives the team some flexibility. It acknowledges the fact that managers will not have a perfect estimate about reasonable key results at the beginning of the quarter. So, rather than expecting employees to work nights and weekends to achieve all key results, the team can refocus their efforts as the quarter continues to hit that 60-70% success rate.
While OKRs start at the top of the organization, they give some flexibility for each team to decide on their own activities. If an organization wants to become a trusted name in the “CRM for small businesses” market, each department can decide how they will accomplish the key results related to that objective.
Here’s a chart that describes how OKRs travel down multiple levels of an organization each quarter. It is from the book “Measure What Matters” by John Doerr, the venture capitalist who helped Google implement OKRs.
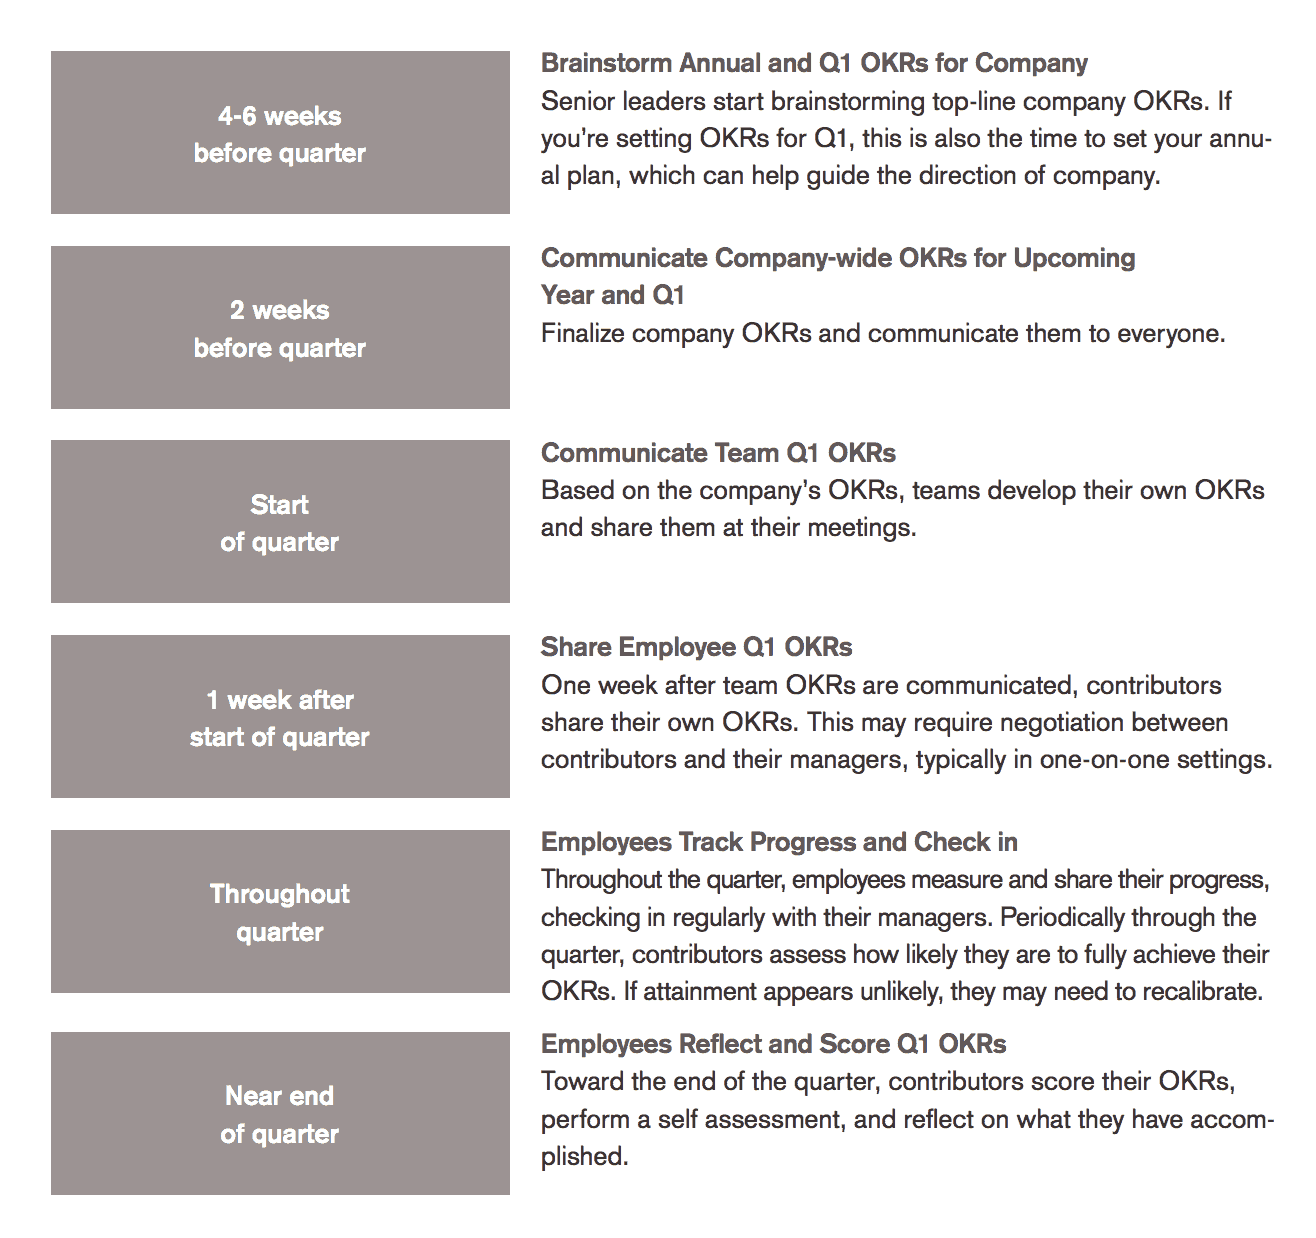
Each level of the company has 1-2 weeks to react to the OKRs set by the level above it. Even individual employees set OKRs at Google, although this is an agreement between the contributor and the manager.
This 1-2 week time frame gives every employee a chance to agree on OKRs with their boss. Here’s a full explanation from Google:
Here is one commonly cited example that is actually a bad example of OKRs. Imagine that you are running a football team in the NFL. This is the OKR chart for your organization:
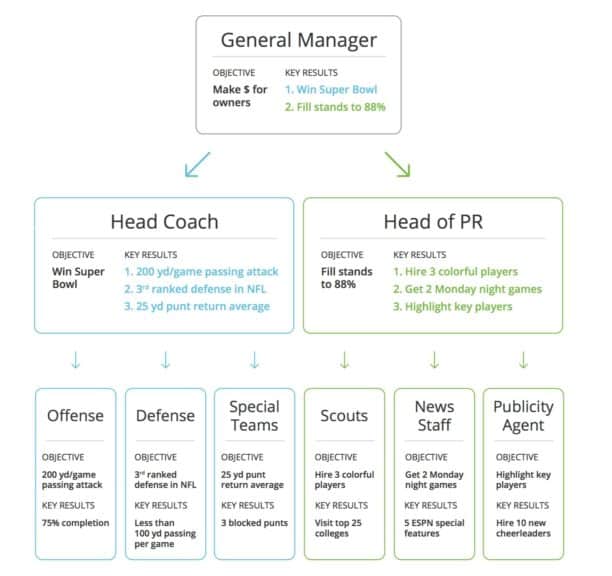
There are two huge issues:
- Each team does not seem to get any input on their own objectives. Their objectives were delegated by their boss. That means that the person who will be responsible for the OKR did not get any input while setting it up.
- The objectives are all quantitative since they are copies of a Key Result. There is no aspirational goal for all the individual teams, just a number.
Here’s how you might be able to reorganize this. The head coach’s objective of winning a Super Bowl is binary. That means it is more suitable for being used as a Key Result.
A better objective might be “Assemble the best all-around team in the NFL” using the three Key Results described.
After that, the Objective for the Offense should be “Create a passing-first offense that puts extra emphasis on tight ends and running backs.”
That should lead to success for the first Key Result of the coach–a “200 yards per game passing attack.”
PRO TIP: How Are Users Engaging on My Site? Which Content Drives the Most Online Activity?
If you want to discover how visitors engage with your website, and which content drives the most engagement and conversions, there are several on-page events and metrics you can track from Google Analytics 4 that will get you started:
- Sessions by channel. Which channels are driving the most traffic to your website?
- Average session duration. How long do visitors spend on your website on average?
- Pageviews and pageviews by page. Which pages on your website are viewed the most?
- Total number of users. How many users engaged with your website?
- Engagement rate. Which percentage of your website visitors have interacted with a piece of content and spent a significant amount of time on the site?
- Sessions conversion rate. How many of your website visitors have completed the desired or expected action(s) and what percentage of them completed the goals you’ve set in Google Analytics 4?
And more…
Now you can benefit from the experience of our Google Analytics 4 experts, who have put together a plug-and-play Databox template showing the most important KPIs for monitoring visitor engagement on your website. It’s simple to implement and start using as a standalone dashboard or in marketing reports!
You can easily set it up in just a few clicks – no coding required.
To set up the dashboard, follow these 3 simple steps:
Step 1: Get the template
Step 2: Connect your Google Analytics account with Databox.
Step 3: Watch your dashboard populate in seconds.
The Difference Between OKRs and KPIs
Compared to OKRs, KPIs are much more straightforward. They do not require each person to have an aspirational goal and connect it to specific results.
Quick refresh–KPIs, or Key Performance Indicators, connect an individual metric to a general business goal.
So, if you are running an assembly line, your business goal for the year might be “Increase the reliability of our assembly process.”
You would measure the rate of defects in final products as a KPI. You might be trying to go from 10% defects to 5% defects.
KPIs are based around the SMART system:
- Specific
- Measurable
- Assignable
- Realistic
- Time-bound
And, since one KPI connects to one business goal, the outcome is binary. You either achieve your goal for the quarter or year, or you fail. There is no range of achievement compared to the OKR system.
Also, KPIs do not focus on individual initiatives.
Let’s say that you are a software engineer working at a payment processing software company.
Your department’s goal is to reduce fraud from 2% to 1%. You are launching a new feature to make this possible.
In the KPI system, there is no need to create a new objective for the project and an associated KPI. You are simply working on the department-wide KPI.
That brings us to the last rule about OKRs that I haven’t shared yet. There are actually two types of OKRs–committed and aspirational. We have just covered aspirational OKRs so far.
Committed OKRs require 100% achievement of the Key Results. You can use these Objectives for initiatives that are straightforward.
For example, launching a new feature for a software product.
The Objective would be “Launch Feature X.”
The Key Results might be:
- Get the feature live in our test environment by Sept 1
- Run a beta program with 20 users
- Test each of 5 key flows and eliminate all bugs
Examples of OKRs at Databox
Databox is a SaaS and marketing reporting software for small and medium-sized businesses.
We have around 20 employees. Here is how our OKRs might cascade through the organization for this quarter (Q3 2018).
I am going to use 3 key results for each objective, but if we were a larger organization, I would use 5.
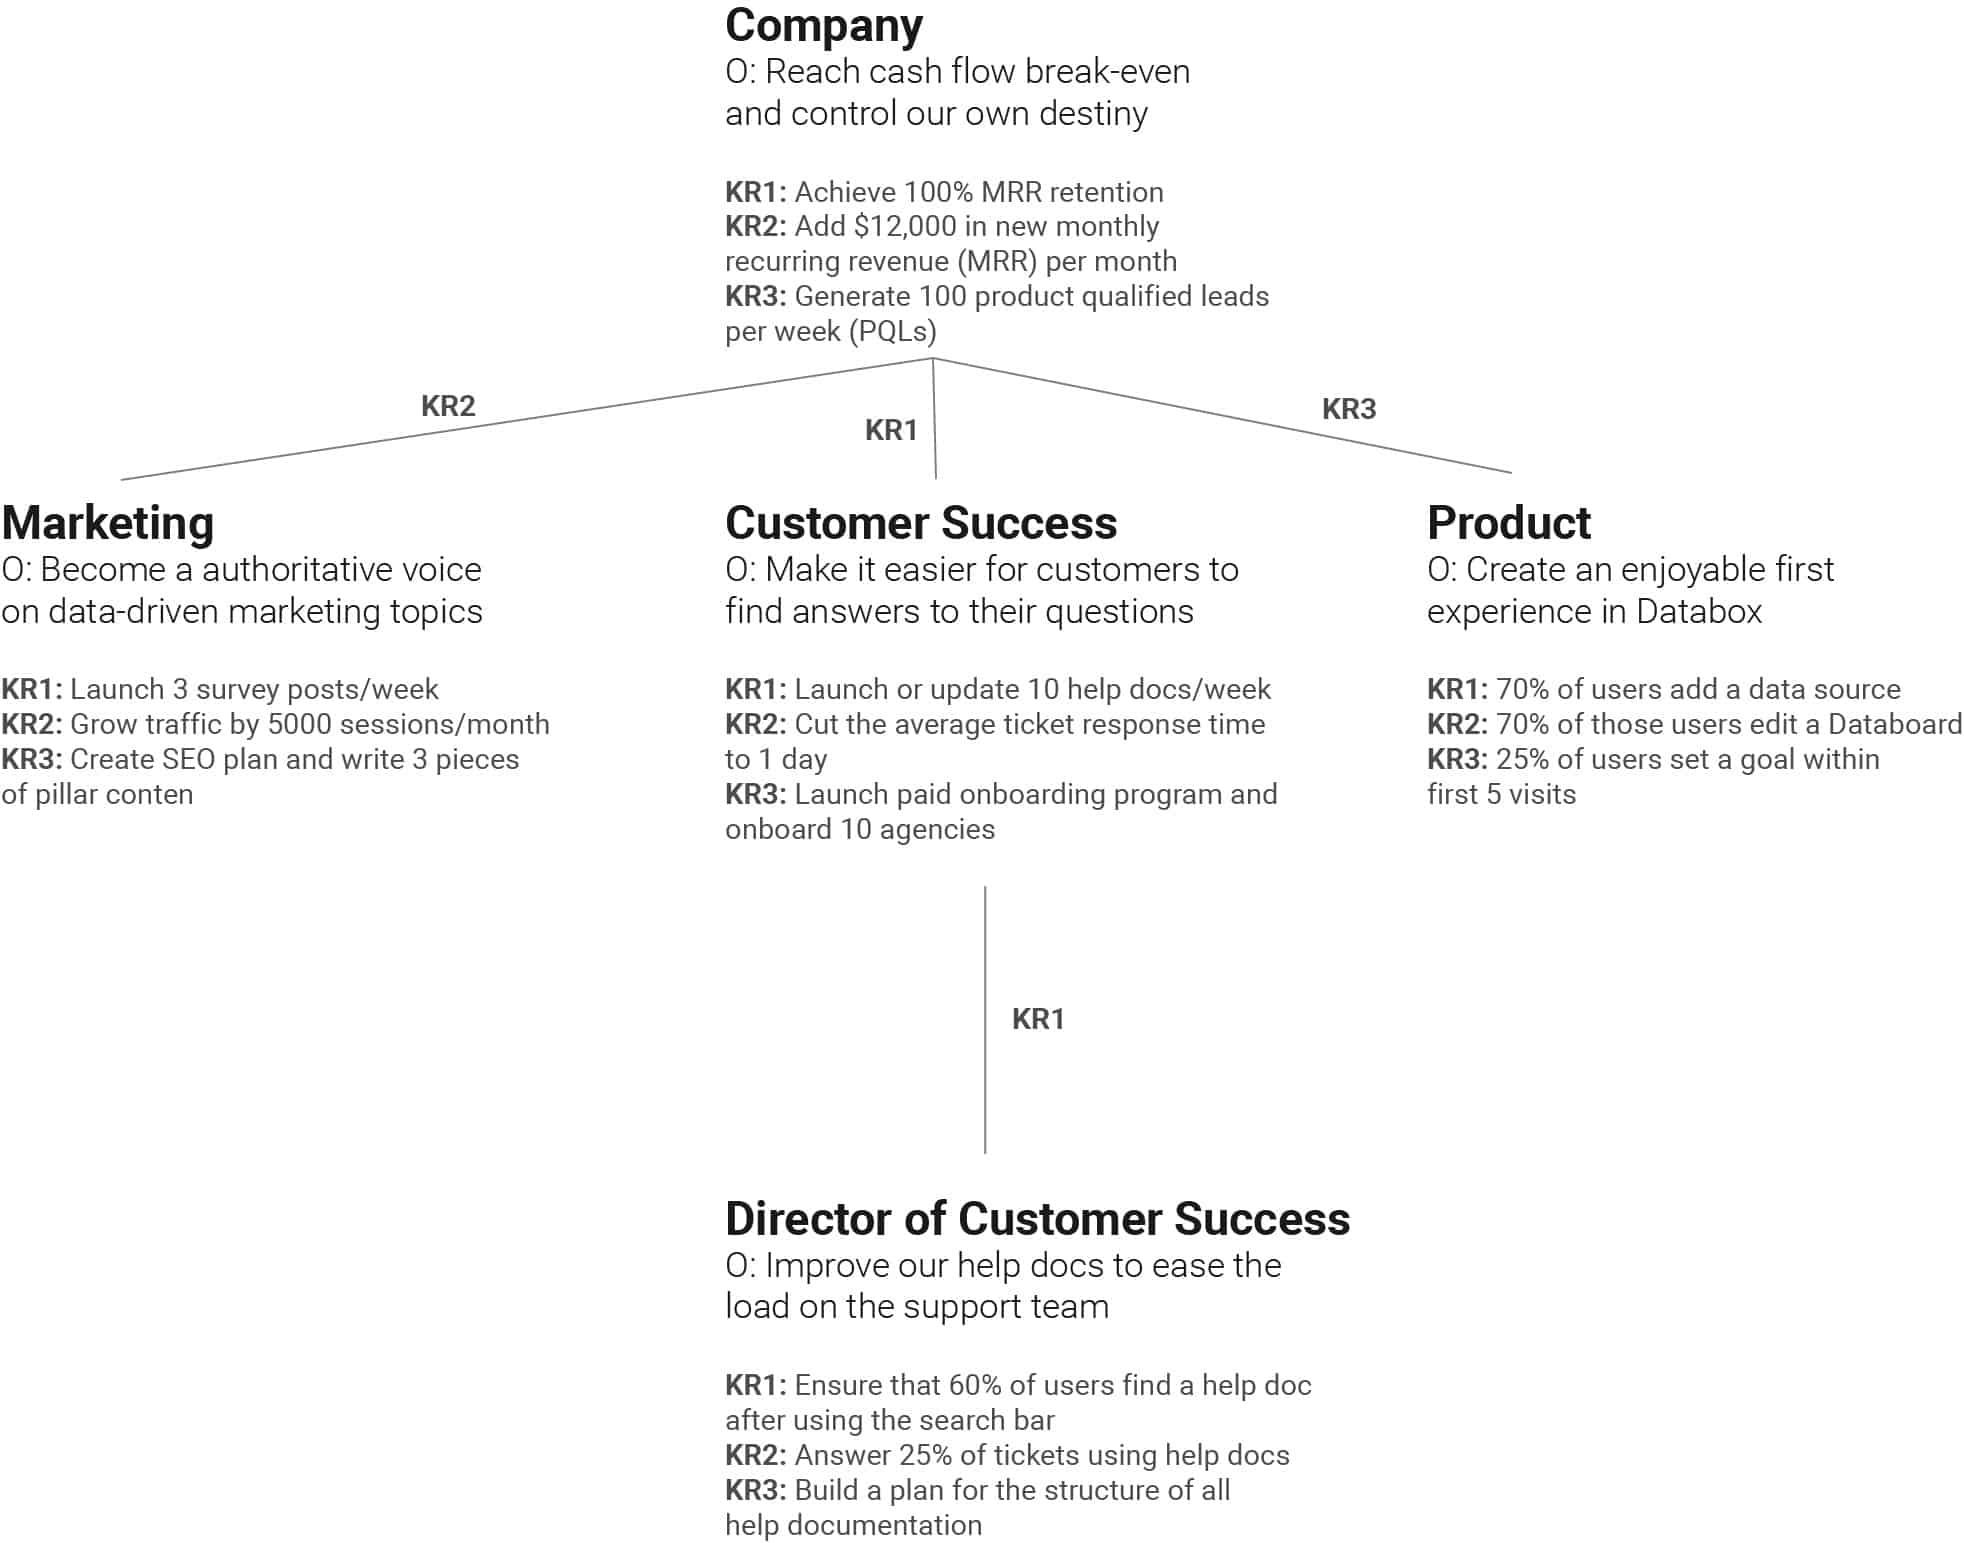
I labeled the lines to show how each Objective connected to a Key Result on the level above it.
Databox is a freemium SaaS product, which means we have plenty of happy users that do not pay us but could become paying customers one day. So, the customer success and product teams must focus on finding ways to help these users as much as possible before they talk to an actual human being.
For each of the OKRs above, all 3 Key Results are certainly achievable, but since each team member has a limited amount of time, it is unlikely that any given team or employee will hit all 3.
Fortunately, we should still have a chance to hit our objective if KRs are achieved 66% of the time (2 of 3).
How to Share OKRs Across Your Organization
If you work at a company with less than 10 employees, the CEO or managing director will still be having personal conversations with each employee. Conversations about goals can be personal.
But, if you have ever worked in an organization with more than 10 people, you probably know that a leader can’t announce a new initiative once and expect all employees to commit it to memory.
In a larger organization, leaders need to make sure that their management principles are clear by referring to them in every company-wide meeting. That will remind managers that they need to follow suit with their employees.
When it comes to OKRs, company leaders set quarterly Objectives and announce them to managers 1-2 weeks before the start of the quarter. Managers then have 1-2 weeks to set their own OKRs. By the time the quarterly company-wide meeting arrives, all managers already have their plans in place.
Angus Davis, CEO of UpServe, explained how he uses OKRs to make sure every team clearly understands how they contribute to the larger mission:
“We had grown to the low eight digits in revenue, and we’ve got a lot of teams dependent on one another to succeed — no one person knows everything going on inside the organization anymore. The right way to look at OKRs is a way to communicate so there’s clarity of purpose.”
Within the quarter, managers should check in on OKRs with their direct reports during every weekly meeting. You might think that this will put extra pressure on employees since they will be forced to think about their demanding goals every single day.
Instead, this is why OKRs connect ambitious goals to high-level aspirations. Employees know that the meetings are centered around their team’s Objective, not a frivolous demand from a manager.
Bob Ruffolo, CEO of IMPACT, implemented OKRs in 2016 after looking for ways to make IMPACT a top workplace in Connecticut. He began tracking all of the company’s OKRs in one central place and made sure every team knew how they were contributing to IMPACT’s success. He saw immediate results.
“There was one month where we were struggling a bit in marketing. Because everyone could see the company’s goals, people from the client services team volunteered to help out. This is just one example. People do this without being asked.”
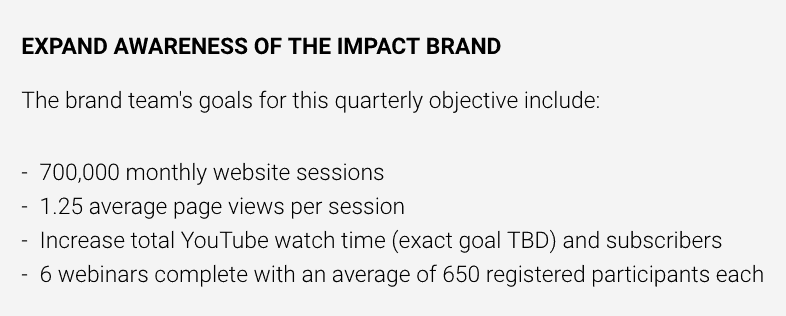
Example OKR from IMPACT
Perdoo, an OKR software company, recommends the following cadence for weekly meetings:
- Employees review OKR progress before the meeting and report at beginning of meeting
- Employee and manager discuss opportunities for improvement or course correction
- Manager sets the priorities for the following 7 days
How To Track OKRs in Real-Time in Databox
You could use a Google Sheet to track all of this and make it transparent to members of your organization. But, that would require every team member to manually update their metrics each week. Whenever a teammate wants to see progress, they will see data that is up to a week old.
If you run a sales, marketing, product or customer success team, you can track OKRs in real-time using Databox’s 130+ integrations, like HubSpot, Google Analytics, Jira, Mixpanel and more.
First, you will need to create a free Databox account and synchronize your data source of choice. Then, head over to the Goals section using the top bar.

Your Key Results will connect to specific metrics, so we will set that up first. Here’s an example of a website sessions Key Result from Google Analytics:

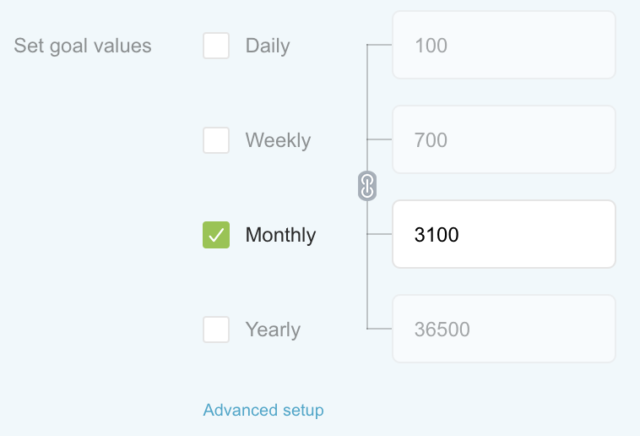
You then need to add your goal for a specific time period. Since website visits can be tough to change on a weekly basis, you may want to set a monthly goal that you can review each week:
Add the name of the Key Result and assign it to the appropriate member of your team:

You can add multiple Key Results to one goal using the Tags feature. Click the Tag icon in the bottom right of a Key Result
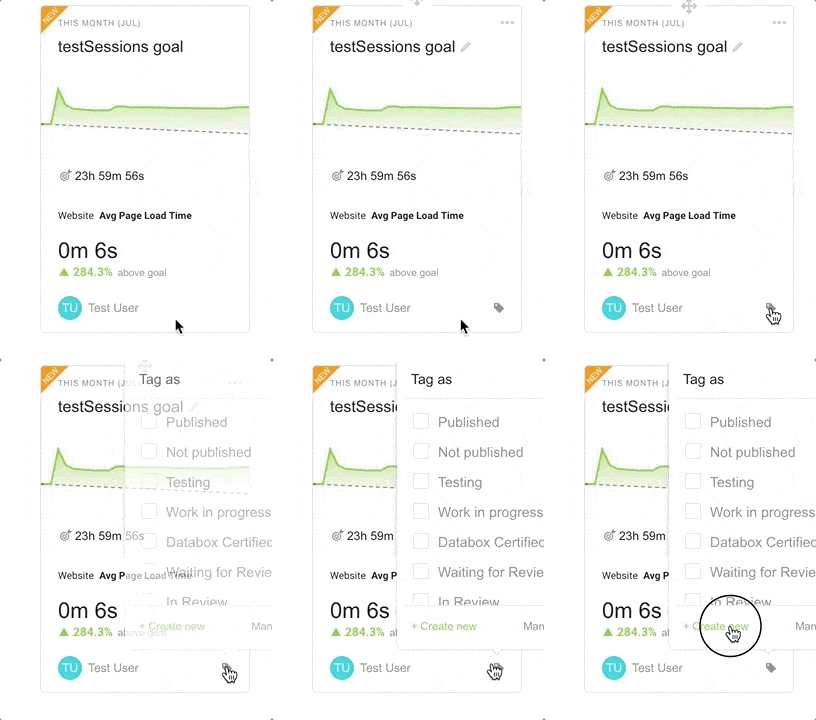
Then add the name of the Objective.
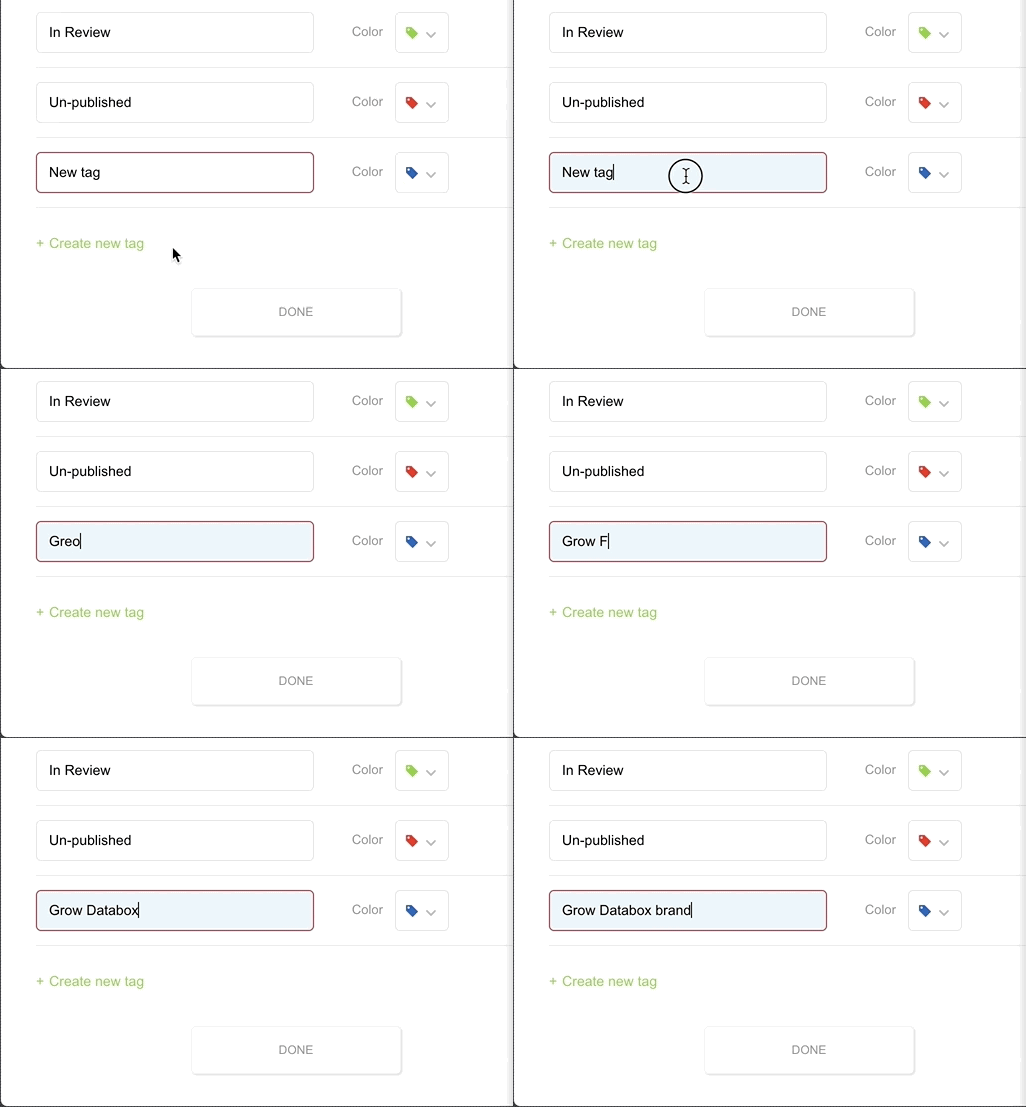
Then, after you have added all your Key Results and created tags based on objectives, you can sort by tag or by employee.
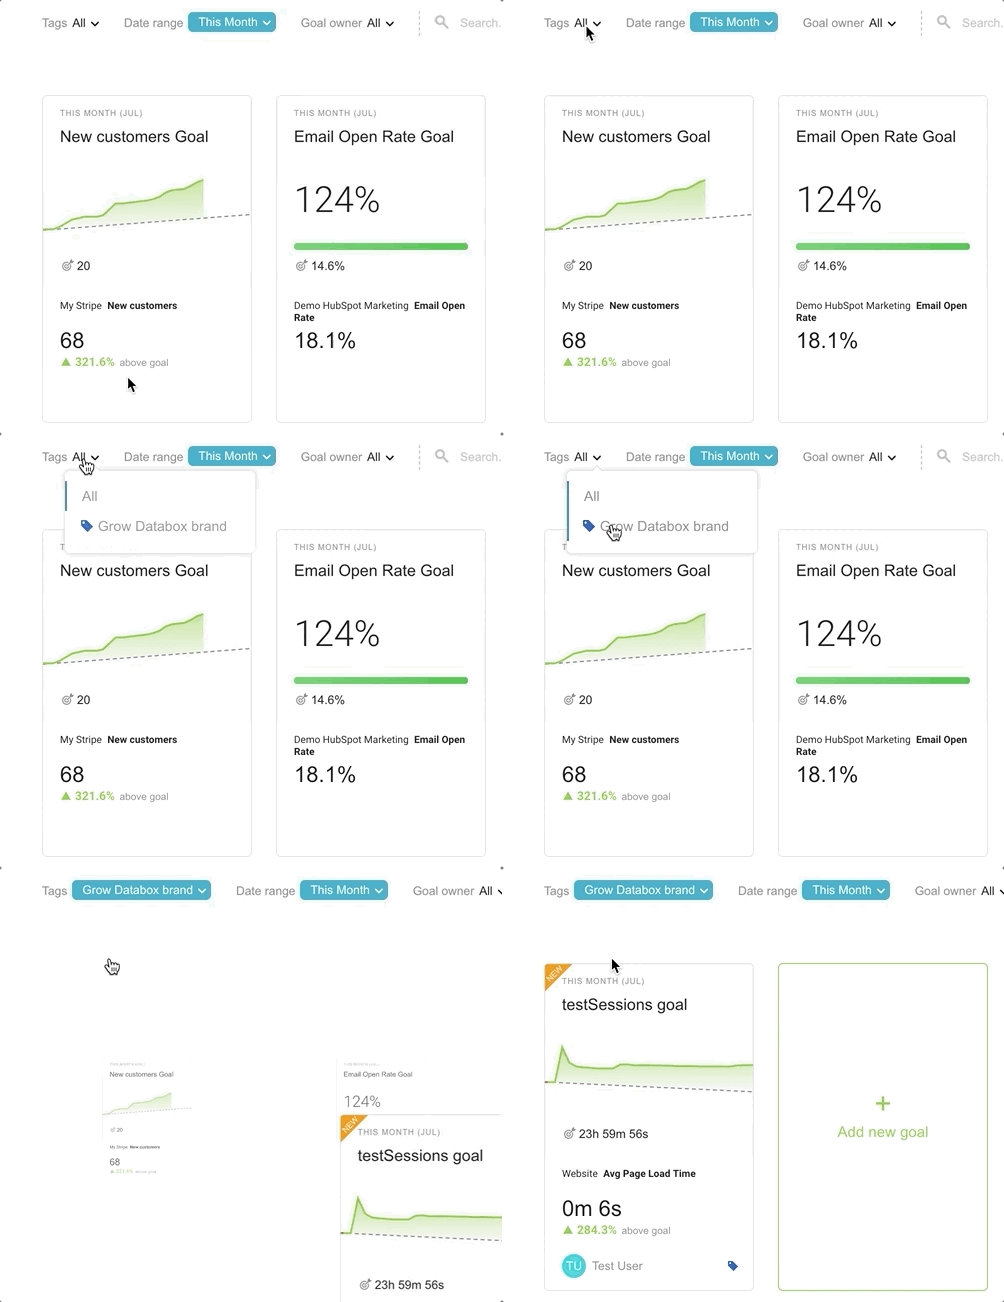
Now, any employee will be able to quickly see the Objectives of other teams, and their progress towards those Objectives.
Set Up OKRs Today
You can start tracking your OKRs with the Databox Goals tool after setting up your free account. Once you set them up, your progress towards Key Results will automatically update daily.


