


Table of contents
If you were to sit in on any of our meetings at Databox, you’d notice a common theme around “ease-of-use” in pretty much all of them.
We know that accessing your performance metrics from all the different tools your business is using has become increasingly more difficult.
Yet the expectations for answers in real time–from your team, bosses, or clients–has only risen.
“How many deals did each salesperson close?”
“Are we seeing a return on our Facebook Ad spend?”
“Is our support team keeping up with help requests?”
Any of these variations of, ‘what happened today?’, have become the hardest questions for any business to answer.
On average, companies track performance across 12 different channels. The need for tracking all of this data in one place–in a way that’s accessible to everyone–has never been more important.
(Perhaps no one struggles with this challenge as much as marketing agencies and other professional services organizations–trying to keep track of dozens of channels for dozens of clients.)
Unfortunately, the solutions range from the static and outdated (copy and paste, screenshots, spreadsheets, and slides) to tools that are far too technical for the average person who doesn’t know how to pull data from APIs, write SQL code, or spend their day doing VLookups and pivot tables in spreadsheets.
So how are people expected to generate the insights needed to make adjustments, answer tough questions, and make the right decision in real time?
At Databox, we’re making it easier for anyone to access performance insights. (We’re the highest rated, and “easiest to use” data visualization tool on G2 Crowd.)
We’ve made continuous improvement of our user interface a core focus area.
Now we’re making it even easier for you to get set up, so you can monitor, improve, and report performance as quickly and easily as possible.
You don’t need an advanced mathematics degree to monitor your performance, nor do you need to hire us to help you set it up.
We’ve developed a tiered certification program that walks you through key features of our tool–connecting your data, customizing your views, setting goals and performance alerts, and more–and most importantly, serves tips and video tutorials for shifting to a real-time performance business.
Accessing performance insights shouldn’t be hard.
We’re making it easy. For everyone.
A big part of that hinges upon making set up as easy as possible. Let me walk you through what we’ve built.
First, here’s how to view your current progress
Whether you’re a new or existing user, tracking your progress is easy.
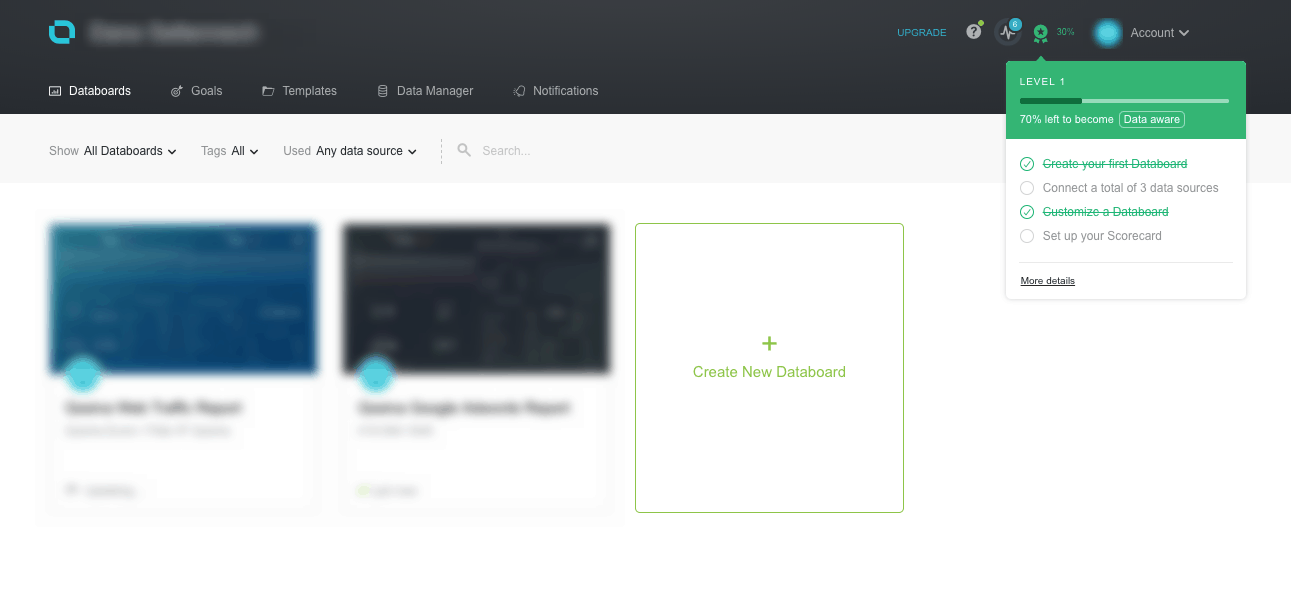
Click the badge icon in the top right navigation of Databox. Here you’ll find the list of tasks needed to complete your current level, as well as the overall percentage you’ve completed.
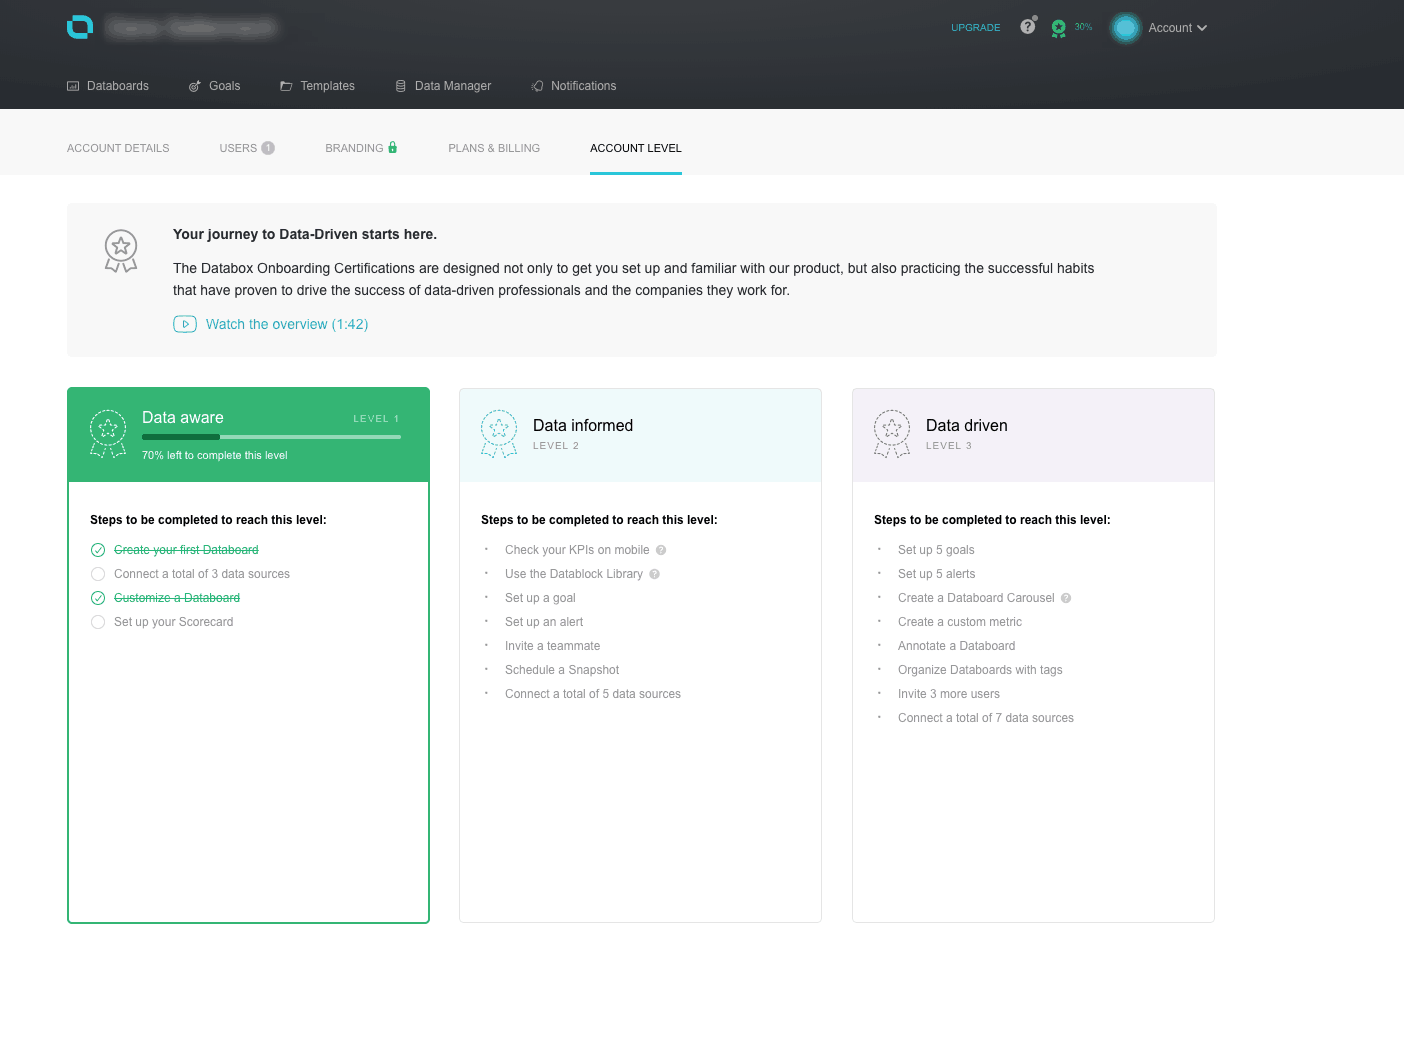
Want a full view of all levels? Click “More details” in the navigation dropdown, and you’ll find the full details for each certification level.
There are two certification programs–one for businesses, and one for partners.
Here’s how each program is structured.
For Businesses
We want anyone within a company, regardless of their technical capabilities, to have the ability to access the performance insights they need to do great work.
No spreadsheet functions.
No design or code.
Just simple, intuitive functionality.
We’ve taken the essentials for actually being data-driven, and productized it into a three-tiered program for transitioning to real-time performance insights.
The Data-Driven Tiers
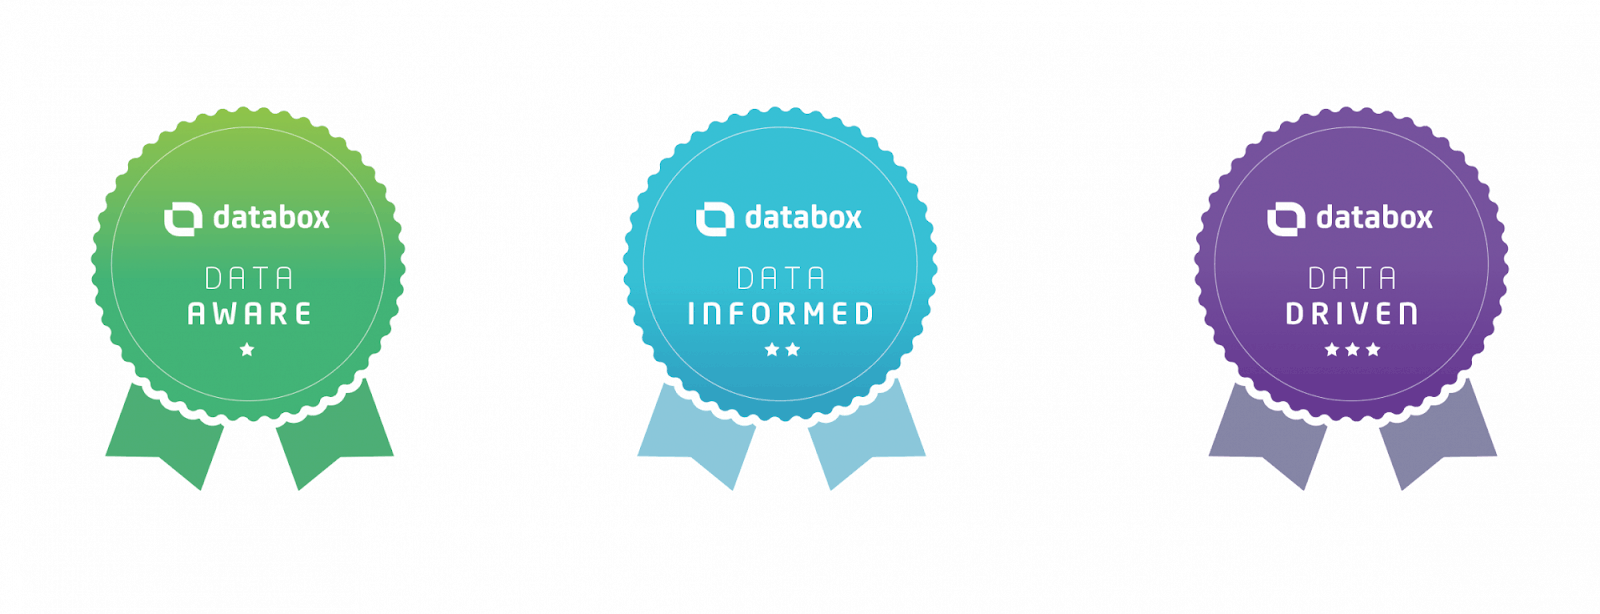
Data-Aware
Professionals that are data-aware have covered the basics of setup.
They’ve connected a few data sources, have built several dashboards tracking different performance insights, and are on the right track for making sense of all of their performance insights.
Data-Informed
Data-informed professionals are enabling others in their organization.
They’re tracking more data sources, building even more views of performance, and are tracking goals and setting performance alerts in order for their team to stay agile and make adjustments in real time.
Data-Driven
Data-driven pros have mastered the product. On top of everything else, they’re also building their own custom metrics in order to manipulate data to pull even greater insights from performance.
For Partners
We’ve made set up even easier by building a self-service program that helps agencies monitor, improve, and report on performance insights in real time.
The program features automated tiers that advance users once they’ve mastered certain tools in the product. (You don’t need to sell things to become a premier partner. You just need to master the tool.)
As you advance through the tiers, you’ll find you’re spending less time reacting to performance, and more time directing it.
Note: Potential prospects can filter agencies by tier, as well as view your certification badge on your partner page in Databox’s Partner Directory. Getting listed in the partner directory is part of achieving Registered Partner status.
The Partner Tiers
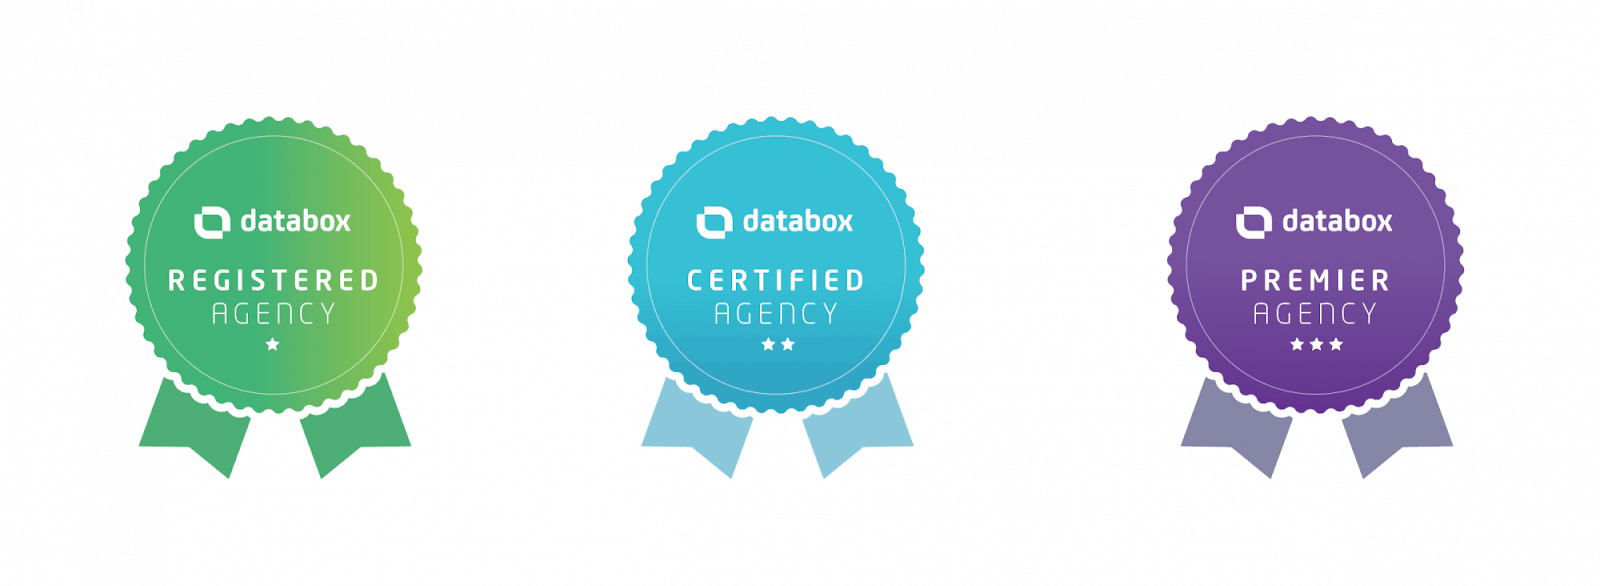
Registered Partners
Registered Partners have covered all the basics.
They’ve connected data, built multiple views of performance, and are generally well-positioned to track the real-time performance insights necessary for understanding, and most importantly, improving client performance.
Getting registered can be done in less than an hour.
Certified Partners
Certified Partners have taken things a step further.
They’ve created dashboards for a bunch of their clients. They’ve set and are actively monitoring goals in Databox. They’re receiving performance alerts when things are on or off track.
These agencies are more typically proactive and agile when it comes to making adjustments based off of the performance insights they’re monitoring.
Premier Partners
Premier Partners are doing all of the above, are using a few of our more advanced features, and they’ve also mastered the art of internal and external communication.
They’ve learned better, and more efficient ways for sharing and presenting their reports to clients, and are even building custom metrics and views of performance that take their client reporting to the next level.
Your journey to data-driven starts here
The expectations for performance insights have changed, yet the tools and processes many businesses use to report on them have not.
With our new certification program, you now have the ability to easily make sense of all of your performance data quicker than ever before.
Whether you’re on the Free Forever plan or a custom business plan, it doesn’t matter. We’re making performance insights more accessible to everyone.
If you’re already a user, view your progress here.
If not, create your free account and get started.
We look forward to following you along on your journey. Have fun, and good luck.


