


Table of contents
Launching Databox’s long awaited new feature – the Datawall
The limitations of a dashboard
For as long as the dashboards have been around, there haven’t been any significant shifts in the philosophy of what they represent and how they are used. The information a dashboard provides is of great value, still, in the end the user is the one who needs to take appropriate action to move the needle.
If we could divide the current user experience associated with dashboards within the typical real-life decision-making process, it consists of: (1) observing data, (2) getting meaningful information out of the data and (3) taking action based on the information. So why have dashboards up to this day failed to go after (2) and (3)?
One of the reasons might be because the latter two require a broadened approach. Trying to take the user through a complete cycle by utilizing only the overhead display is close to impossible. People interact with devices daily, but will not likely want to engage and solve problems on a display that’s bigger in size than their front door. So, a broadened approach might mean that a part of the experience is utilized on a different platform, one that is more personal.
New part to our suite
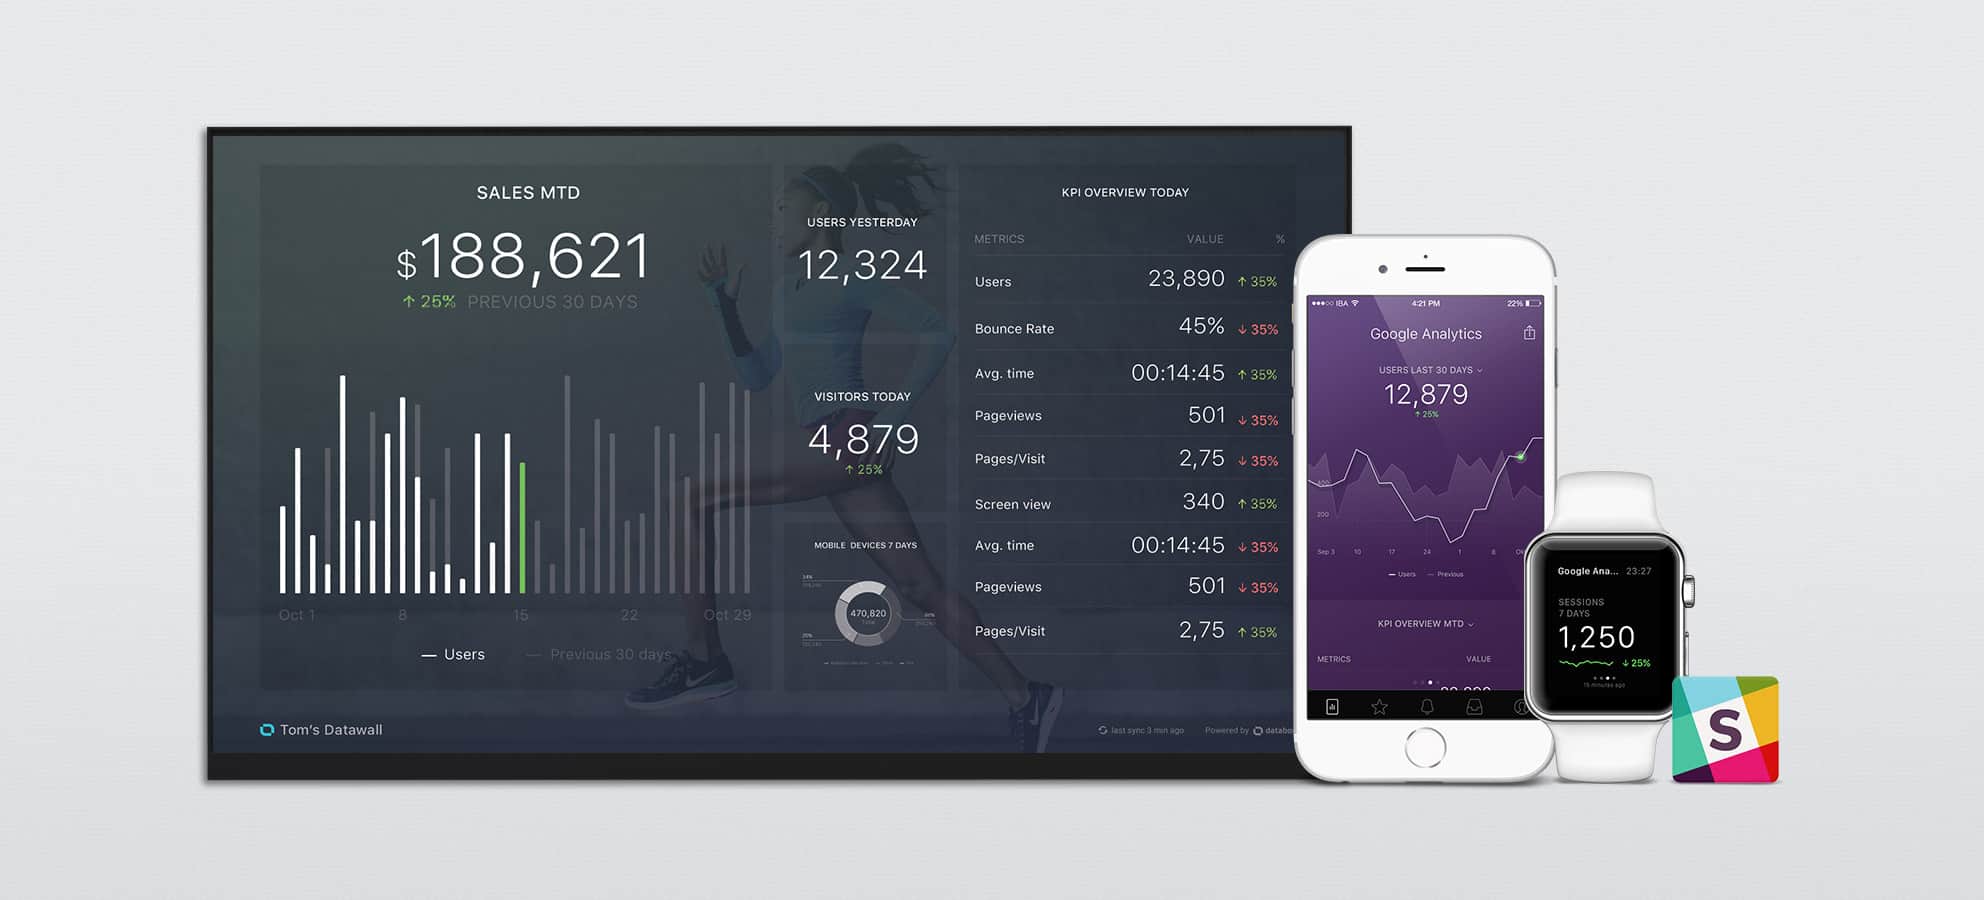
The basic idea behind the Datawall is to provide real-time information to the user on a big screen, but the real value is hidden in how Datawall is a part of a larger suite. While Datawall can display data with ease, it can also pass the baton to other Databox products to do the rest. Alerts in the mobile app will automatically notify you when something needs your attention. Then immediately after that, you can share a data snapshot with your team to tackle the problem right away. Plus, with our latest project, Databox for Slack, you’ll also be able to do all this right from a Slack channel.
There are two use cases that emerge very naturally from this. The first one is going from a big screen to a smaller screen. If, for example, you have a Datawall set up in your office that tracks sales and you start noticing the number of closed sales going down, this might spark your curiosity. Understandably, not all sales metrics are available on your Datawall so you’d want to check out what’s going on in a bit more detail. Having the Databox mobile app on your smartphone will allow you to look at other metrics and try to find a meaningful explanation. At the same time, you can annotate this event and share this particular metric with the person that is responsible for it — right from the app.
The second example is the other way around, going from small screen to big screen. Receiving an alert in the mobile app or Apple Watch might prompt you to take a quick look at the Datawall in your office to see how your KPIs have changed recently. With a bit more information, you’re now able to start a live discussion with your colleagues and take appropriate action right away.
The same great experience and full customization with ease
As with the Databox mobile app, a core component of the Datawall is empowering the user to create his own data visualizations in a snap. Literally, it takes you just minutes to build your personal Datawall. Once you hook up your data, you can use our drag and drop editor to easily create a beautiful KPI dashboard.
Just like with the mobile app, every Datawall comes with a set of self-service tools that allow seamless customization. You can add new blocks, change the layout, or customize your colors, etc. — right from the Databox Designer. This way every user can have a different, personalized view, but all the metrics are still available inside a single, unified platform. Plus, a Datawall can also be branded by adding your logo and background image.
It’s super easy to start
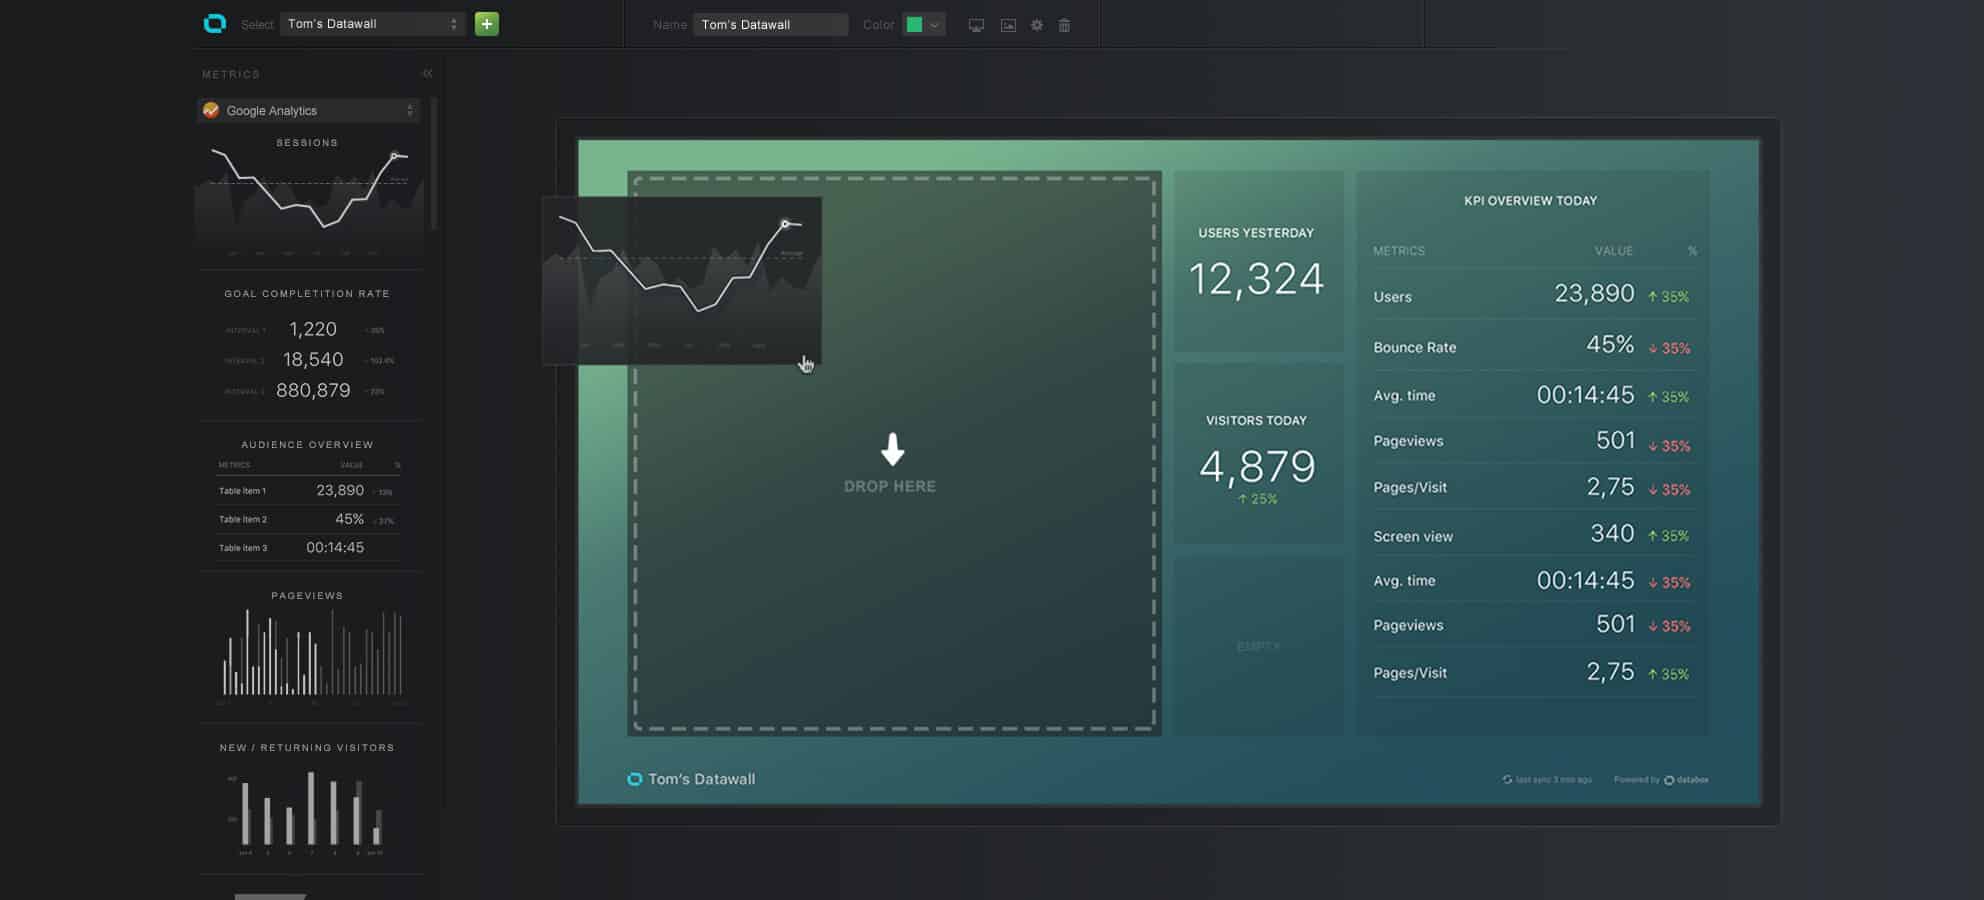
To create a new Datawall, just log into your account, select the new “Datawalls” item on the top menu, and then “Create New Datawall.” This will take you to the layout designer, where you can start building it from scratch.
Just like with datacards, adding a datablock to your view is very easy — simply drag and drop. Just pick a visualization from the Datablocks section on the left-hand side and add it to your view (read more about adding and modifying Datablocks).
Besides the same familiar flow and experience you’re used to from building mobile datacards, we’ve also added some new functionalities specific for the Datawall. Because not all visualizations are of equal importance, we give you the full flexibility to rearrange and resize all the blocks.
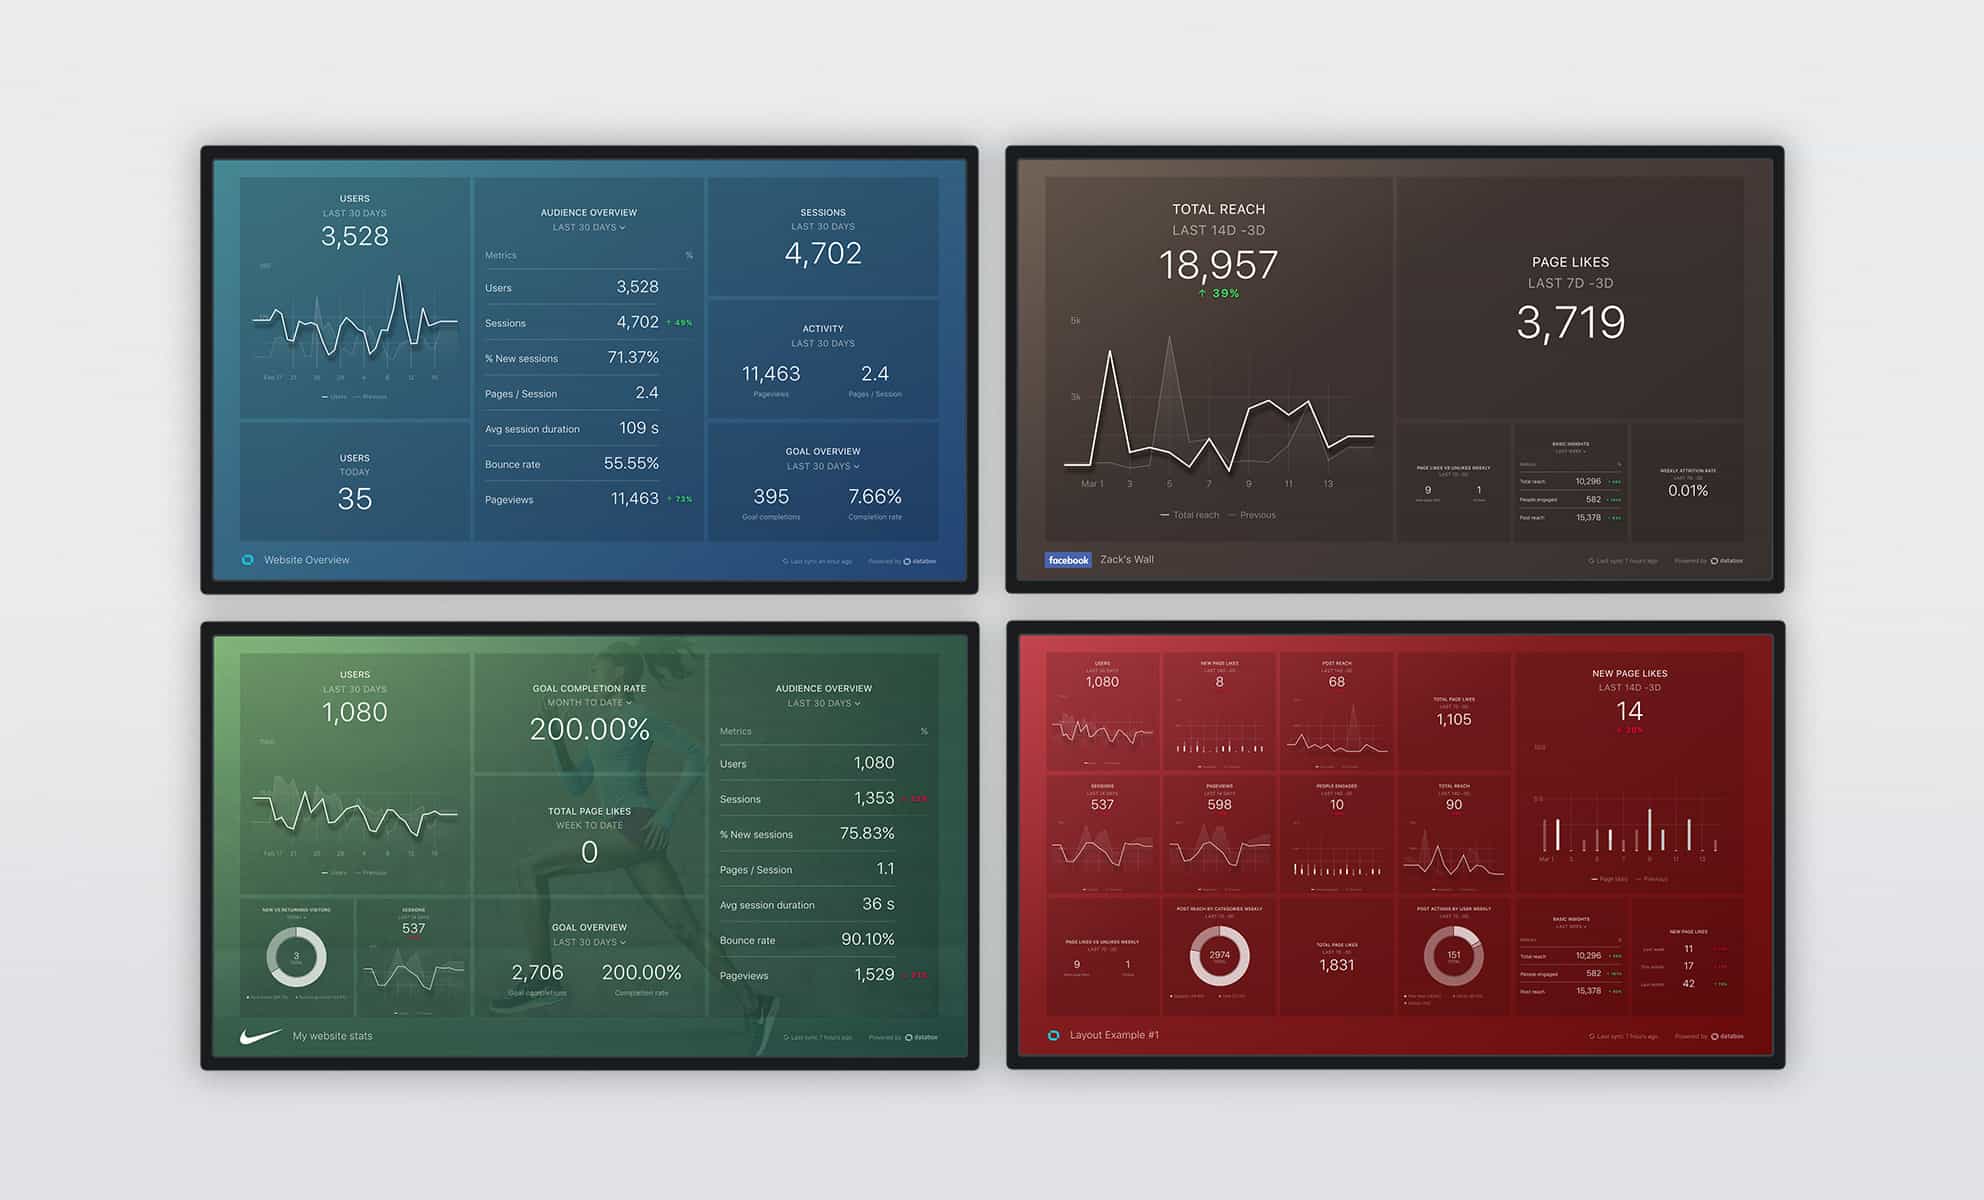
Here are few examples of how your datawalls could look like:
Requirements
Datawalls are built to run in browsers. Among the most popular options are Google Chrome and Firefox, and they will do the trick as long as you have access to the internet (read more about using Datawall in the office).
But don’t worry, if you don’t have the ability to use a wall-mounted screen and would just like to have your KPI dashboard accessible on your computer, you can do that too. It works just fine by triggering the browser’s full screen mode and it will act as your personal office dashboard.

Another great use of Datawall is when you’re preparing for a meeting. With all your data in one place, it’s super easy to create amazing visualizations that will show the latest or historical data. To include your Datawall in your presentation, just use the provided URL in your browser.
Here is a short video tutorial on how to create a Datawall:
To read more about Datawall, check out some of these other helpful articles:
· How to create a Datawall
· Using Datawall in Your Office
Ready to get started?
Sign up for a Databox account and build your own Datawall


