


Table of contents
How many website visitors added an item to their cart but didn’t buy?
Or, how many people initiated a live-chat but didn’t purchase?
And, what percentage of people are clicking on out of stock products?
These are all questions you can answer in Google Analytics with the help of custom dimensions.
In this post, we’re going to walk you through how to set up custom dimensions along with 16 specific use cases.
- What are custom dimensions?
- How do you create a custom dimension in Google Analytics?
- 16 Google Analytics Custom Dimensions for Tracking Your Online Store

What are custom dimensions?
Whenever you are dealing with an abstract concept, like custom dimensions, it can be helpful to use a real-world analogy. In this case, creating custom dimensions in Google Analytics is similar to the process of building an ice cream sundae.
The ice cream – whether it is Rocky Road, Mint Chocolate Chip, or your flavor du jour, etc. – is your Google Analytics account.
And, custom dimensions are the equivalent of all of the delicious toppings like rainbow sprinkles, whipped cream, and chocolate fudge, that you put on your sundae to make it uniquely yours.
Simply put, custom dimensions allow you to collect and analyze additional layers of data on top of the standard dimensions inside Google Analytics.
Shiv Gupta of Incrementors Web Solutions adds, “Google Analytics Enhanced eCommerce enables the measurement of user interactions with products on eCommerce websites across the user’s shopping experience. It measures product page views, adding and removing products from shopping carts, initiated, abandoned, and completed transactions.
Custom dimensions allow you to attach useful, additional information to hit, session, user, and product data that you can send to Google Analytics. There are endless ways you can use custom dimensions to add more context to your Google Analytics data.”
For example, if you own an eCommerce business that sells home workout equipment, you might want to create custom dimensions to track things like out of stock products, shipping weight, or customer lifetime value. This will give you a better pulse of consumer demand, repeat customers, and help lower shipping costs.
In addition, if you have a standard Google Analytics account, you can have up to 20 custom dimensions. Google Analytics 360 customers can create up to 200 custom dimensions.
How do you create a custom dimension in Google Analytics?
Creating custom dimensions can get pretty technical. If you are not familiar with Javascript or Google Tag Manager, you may want to have your developer set this up.
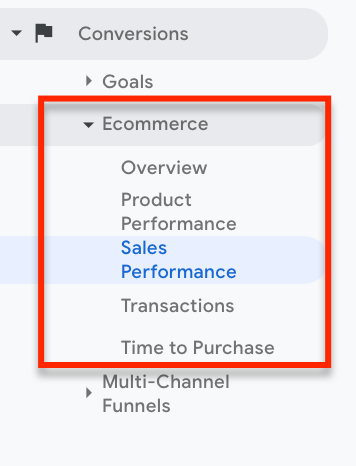
To get started, make sure you have Google Analytics Enhanced eCommerce enabled. This will give you access to several eCommerce specific reports such as Overview, Product Performance, Sales Performance, Transactions, and Time to Purchase.
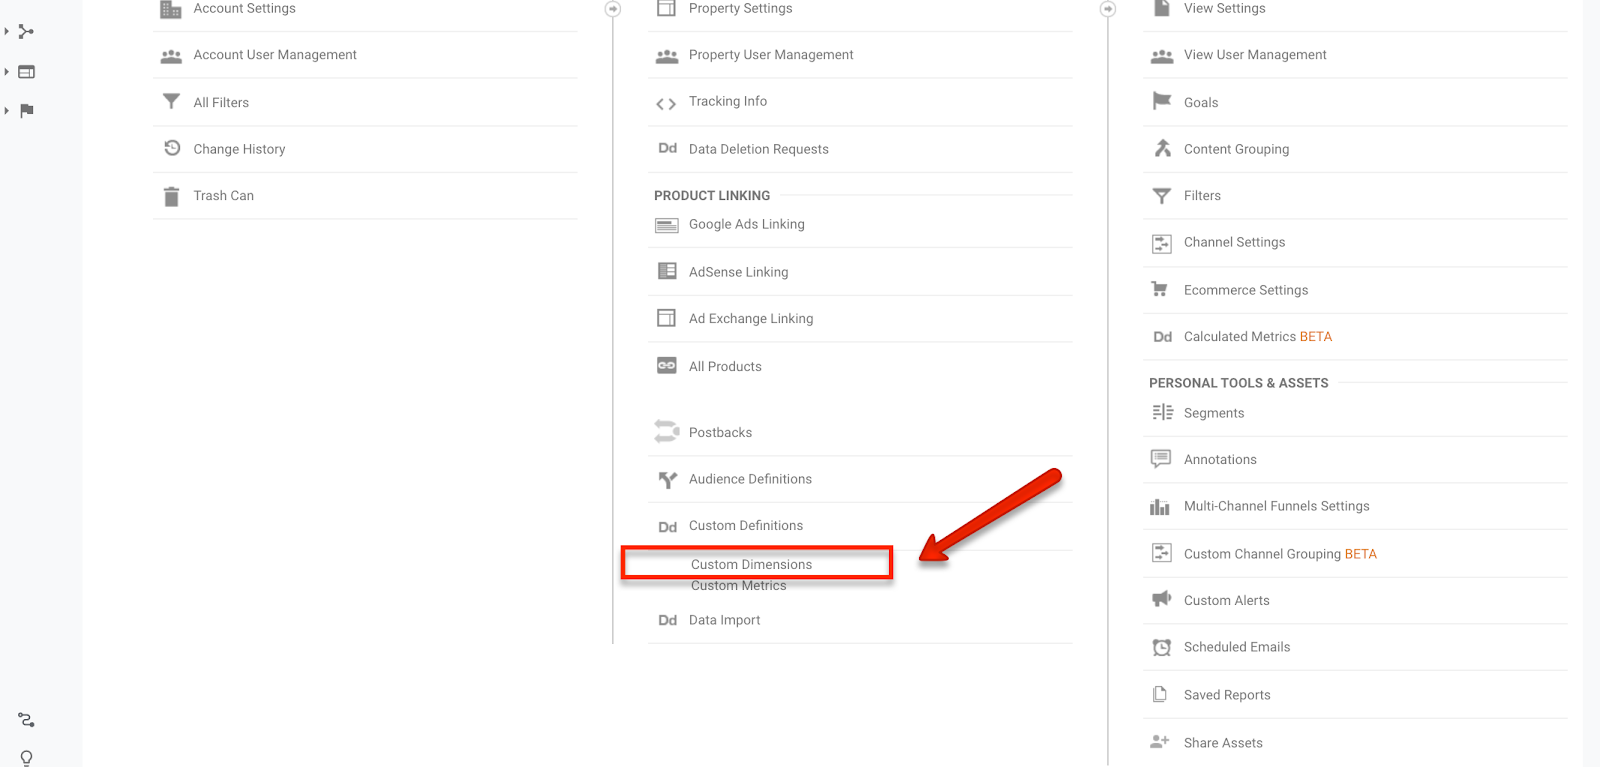
Then, go to Admin → Custom Definitions → Custom Dimensions.
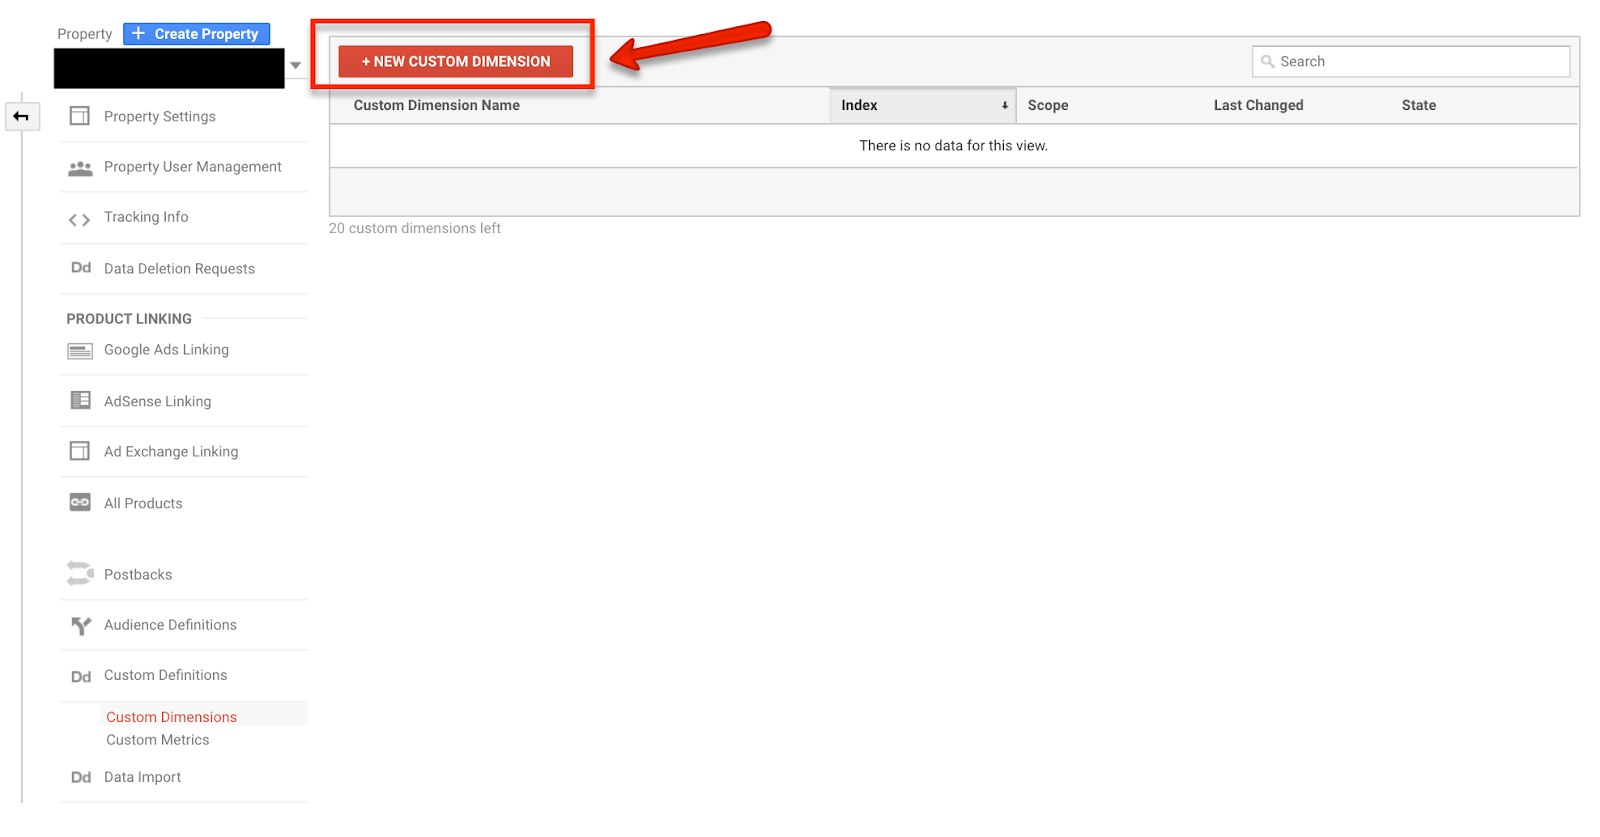
Next, select→ New Custom Dimension.
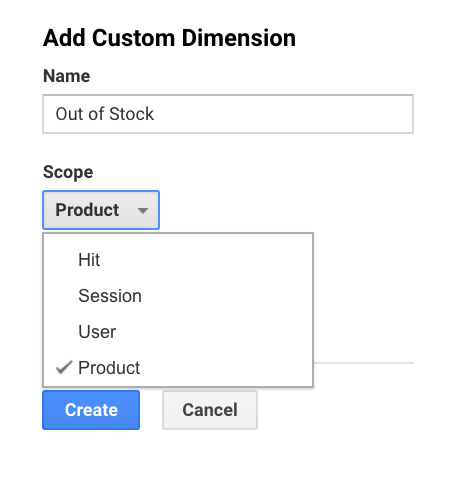
Now, you can add your custom dimension, such as out of stock products, and choose the scope.
There are 4 scope options to choose from:
- Hit – this is the broadest option and applies to any pageview or event that takes place
- Product – this applies to a single eCommerce hit for a product
- Session – this applies to all hits during a session duration
- User – this measures all hits across the duration of a user
Finally, if you are setting up a custom dimension for the first time, you’ll see this screen. This is will where you will either need to add a tracking code directly on your site or in your Google Tag Manager account.
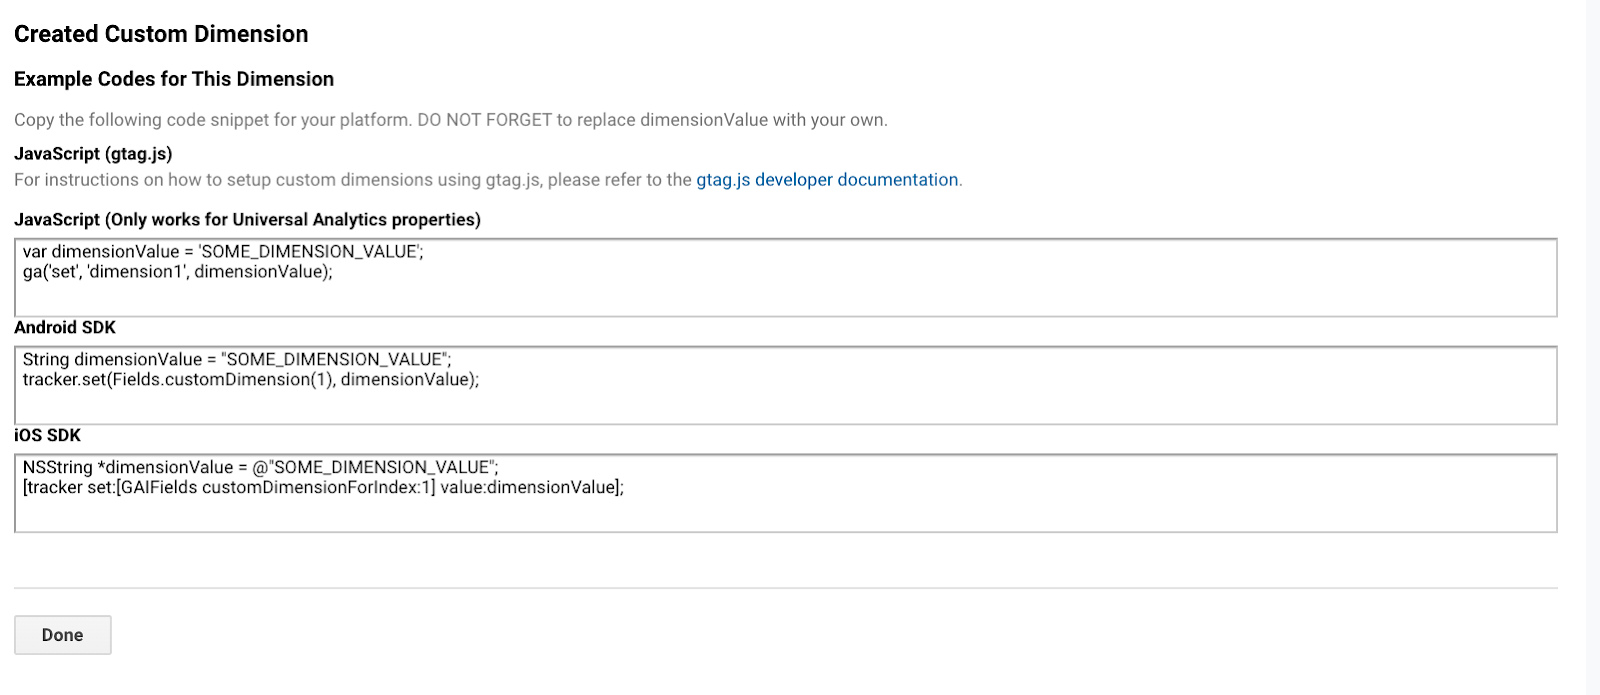
Prefer a video tutorial instead? Check out this tutorial from Google Analytics that walks through the setup process.
16 Google Analytics Custom Dimensions for Tracking Your Online Store
Now that you know how to create custom dimensions, here are 16 use cases.
- Collection Filter Hits
- User ID
- Discount Value
- Product Sizes
- Product Color
- Product Brand
- Add to Cart
- Cart Abandonment
- Customer Lifetime Value
- PR Placements
- Full Referrer
- Hit Type
- Article Categories and Tags
- Form Abandonment
- Chats Initiated
- IP Address
PRO TIP: Get Useful, Actionable Data on Your Ecommerce Store’s Performance
To improve the performance of your online store, it’s vital to have access to useful and actionable data. But, with so many metrics available to track, it may be hard to determine which ones will actually help you move the needle.
That’s why we have created a concise dashboard template that only tracks the most important metrics for analyzing the core elements of your ecommerce businesses, such as:
- Transactions and orders. How many transactions does your online store process in a day, a week, or a month? How many orders, and how many were placed on the same day of the previous month?
- Sales volume and trends. See how much money has been generated from sales in the current month. Analyze daily trends to compare with your sales goals and take action to reach them.
- Website traffic trends. Track the number of new and returning visitors to your website and the number of individual sessions initiated by these users.
- Conversion to customers. See what percentage of your website visitors convert to customers.
- Revenue per customer. See how much revenue you get from each unique visitor that interacts with your store during a given time period.
- Amount per transaction. Track the average dollar amount each customer spends on a sale.
- Best-selling products. See your most popular products in terms of volume and revenue in a given period.
And more…
Now you can benefit from the experience of our Google Analytics 4 experts, who have put together a plug-and-play Databox template showing the most important KPIs for monitoring your online store’s performance. It’s simple to implement and start using as a standalone dashboard or in ecommerce reports!

You can easily set it up in just a few clicks – no coding required.
To set up the dashboard, follow these 3 simple steps:
Step 1: Get the template
Step 2: Connect your Google Analytics 4 account with Databox.
Step 3: Watch your dashboard populate in seconds.
1. Collection Filter Hits
“One custom dimension that we’ve set up to drill deeper into our customer data is tracking Collection Filter hits,” says Brian Lim of iHeartRaves. “We are always trying to optimize our site for the best customer experience. Tracking this data allows us to measure what filters customers are using to sort our products by and how that affects the conversion rate. With this insight, we are also able to test different filters that may help a customer find what they are looking for.”
2. User ID
Erico Franco of Gravity says, “With User ID, you will be able to track recurring transactions properly across the customer’s lifetime.”
3. Discount Value
“Understanding the conversion rate of products and brands when they are on sale and not on sale is helpful for planning and forecasting,” says Jesse Teske of JCTGrowth. “It also helps give your merchandise and buying teams data to negotiate future deals if they have concrete data for planning. In addition, if you can capture different price points and understand the difference between 10% and 20% discount you can find the right sale price without sacrificing profit.”
4. Product Sizes
“For a clothing eCommerce site, tracking sizes along with transactions is valuable to uncover trends of which sizes are most popular for which styles,” says Jackie Jeffers of Portent Digital Marketing Agency. “We could use that size data to plan ahead and forecast how many of each size we’d need to order for different products.”
Dan Serbanescu of Leather Depot adds, “Among the products listed on my store, there are also some that present themselves in different sizes, like jackets and shoes. I usually end up having different sizes for them, like 4 jackets size “M”, 3 “XL”, 0 “S”, etc. When a customer clicks on “S” size, for example, he will see “Out of stock” and then leave, but by default, I have no way of knowing he clicked “S”, so here is where this dimension comes in. It will track all clicks on each individual size, no matter if it is added to cart, or just says Out of stock.
By using this dimension I can now tell what sizes my customers desire. So when I see 10 clicks on size S which is out of stock, I will know that the demand is there and I will stock up.”
5. Product Color
“It’s surprising that an image color can make a difference in the rate at which it is purchased, but it matters,” says Melanie Musson of BroadFormInsurance.org. “If one color outperforms others, we always make sure to include that color in other product options.”
6. Product Brand
“I use the Product Brand custom dimension a lot,” says Will Ward of Assistive Listening HQ. “I figure out which brands are more popular with certain sections of my audience. For example, certain products are more popular with customers via mobile phone traffic. This information is invaluable as I can market that particular brand on my homepage for mobile users. Similarly, I can customize the related product section in product pages depending on the device used by the customer. All these help a lot in increasing conversions.
7. Add to Cart
“Add to Cart is a metric we track closely as it is a strong indicator of purchase intent,” says Jeremy Cross of Online Team Building. “In particular, we try to review Add to Cart by traffic source or referrer. For example, we recently had a large media feature that brought thousands of people to our site. Unfortunately, this traffic seemed to be window shoppers as we saw a drop-off in the Add to Cart metrics. This information is useful because we will be less likely to pursue traffic from that source in the future.”
8. Cart Abandonment
“Customer Acquisition Drop-off,” says Zac Johnson of Blogging.org. “By tracking when and where users are leaving your site, you can quickly see where and how to increase conversions. Shopping carts will always have a good drop-off rate, but see where and why the drop off can allow you to tweak and continually optimize your site and checkout to improve these numbers over time.”
Joseph Pineiro of 360training adds, “At 360training, we use Google Tag Manager to track shopping cart abandonment.
By setting up a trigger in the GTM dashboard to track shopping cart abandonment, we’re able to see what point along the shopping cart journey is most problematic for users. Based on this information, we’re able to adjust poorly performing pages to improve both user experience and reduce cart abandonment.”
9. Customer Lifetime Value
“With the Customer Lifetime Value custom dimension. you can track and measure the worth of a specific customer and indirectly work out the average CLV,” says Djordje Milicevic of StableWP. “eCommerce businesses need to understand their CLV and also how it relates to each acquisition channel. It’s especially important to compare the CLV with CAC (customer acquisition cost) and identify the true value of a customer. This helps estimate to what extent you can invest in acquiring a customer as well as which customers and channels are worth their investment.”
Ken Christensen of Christensen Recycling says, “If you have the necessary tools and tracking in place to see what customers are most active on your site and their lifetime sales/revenue, this is a huge metric to have. A huge benefit of this is being able to track where your best repeat customers are coming from. If one traffic source delivers a lot more customers that are spending more money, you can then focus more time and money on those traffic sources.”
Cayley Vos of Netpaths Design adds, “The Custom Dimension “Customer Lifetime Value” is an underrated but extremely sneaky way to get more users to take action on your site. We track users’ purchases of products and offer better deals and more coupons to big spenders.
Here is an example:
When a user buys a product for the first time, we save product revenue as a custom dimension and use it for their subsequent purchases. Then we group the LTV into absolute dollar buckets.
So If a person has a current LTV of $7500, we add them to the $5000-$10000 bucket.”
Editor’s note: If you are running a profitable business, you should also keep a healthy ratio between CAC and CLV. Track both metrics in your ecommerce reporting software, so that you will be able to spot any deviations from targeted values, as soon as they occur.
10. PR Placements
Bogdan Marinescu of Digital Trails says, “As part of our agency’s online visibility services for eCommerce, we’re often asked to support clients with Digital PR, or, as we like to call it, Performance PR. Performance because we don’t just track the brand mention or the backlink to clients’ sites, but we also set up custom dimensions in Google Analytics to help us understand referral traffic from PR placements, sessions, and user behavior more in detail.
We set up the dimension (e.g. Performance PR placements) by segmenting users based on:
“Source” (in Advanced Settings) + “matches regex“ + the list of sites we’ve secured placements on.
This creates a custom dimension we can then use across the account to check product performance, ABV, conversion rates and much more, which in turns feeds into our Performance PR strategy, especially when it comes to product placement or promotion.
When our PR efforts generate hundreds of placements and considerable referral traffic, being able to filter a GA view based on these parameters allows you to refine your strategy and increase efficiencies across the board.”
11. Full Referrer
“Full referrer dimension,” says Dan Bailey of WikiLawn. “It allows us to analyze not only where users are starting their session from, but how they’re progressing through the site. We’ve used this data to focus our link-building and to improve our UX so users are taken exactly where they need to go without the middle steps that were there previously. This data has helped us determine where we should place our focus to bring in traffic and improve the experience of those users once they’re brought to our site. Obviously it took some time to collect the amount of data we needed, but to this day it’s still our most-tracked stat.”
12. Hit Type
“When incorporating Hit Type to your Google Analytics dashboard, it identifies the type of hit that your site received,” says Sumitra Senapaty of WOW Club. “This can be instrumental when attempting to target specific hit types, such as Events or Timing.”
13. Article Categories & Tags
Isaac Hammelburger of Search Pros says, “Article category shows us what articles customers are more likely to engage with.”
14. Form Abandonment
“I have uncovered that many many who click on Contact Us do not finish the process of getting in touch with us,” says Chayim Kessler of Miami Beach CPA. “We are yet to venture what compelling factors there are out there that hinders them from completing the process of contacting us. But we now have an idea of how our page can become more effective.
15. Chats Initiated
“By tracking initiated chat sessions we can see trends in problems we may be having in our customer experience,” says James Green of Build a Head. “For example, if we start a new promotion on our home page and see that initiated chats increase on the home page, we can dig deeper to uncover what led to the increased inquiries, fix the problem, and measure further.”
16. IP Address
“We like to drill deeper into IP address location of web traffic for eCommerce clients,” says Matt Bentley of CanIRank. “Obviously it’s easy to see that a large portion of your traffic comes from North America, but by honing in on the region and state of user IP address, you can dig much deeper into the profile of a prospective customer.
Figuring out localized trends can be valuable for targeting the right audiences at the right time. Often the geographic trends aren’t what you might expect. For example, in the midst of a New York City snowstorm, you might see an uptick in Manhattan women searching for swimsuits. Without digging deeper into location, you might focus your marketing efforts primarily on Florida, California, and Hawaii when snowy NYC should actually be your focal point.”
In sum, adding custom dimensions to your Google Analytics account is a great way to uncover new insights into who is visiting and buying from your site.


