


Table of contents
To start off, here’s what Amazon is saying about Redshift:
Amazon Redshift is a fast, fully managed, petabyte-scale data warehouse solution that makes it simple and cost-effective to efficiently analyze all your data using your existing business intelligence tools.
If you’d like to learn more about the tool itself, please read this. Amazon Redshift takes its roots from a very popular open source database, PostgreSQL 8.0.2. It has a strong focus on scalability. Common setup is a clustered environment with a leader node. It follows a MPP (Massively Parallel Processing) architecture, which means that all operations are executed with as much parallelism as possible.
At the moment, MySQL, PostgreSQL, Microsoft Azure SQL and Amazon Redshift are supported out of the box on Databox. You have the data ready in your database, now it just needs to get visualized in an easy and concise manner so everyone – even your boss – can use.
Let’s get started!
What Will We Accomplish in This Tutorial?
Firstly, we’ll setup a new AWS Redshift cluster from scratch, then we’ll connect it to Databox and confirm that the connection is working. Lastly, we will create a Datacard visualizing the data from the cluster. All this without a single line of code, except for the SQL query.
1. Prepare Your Redshift Cluster
In this section, we will create a new AWS Redshift cluster step-by-step, add a user and setup network rules to allow access from our IP (52.4.198.118).
Login to AWS Console, then visit Services / Redshift and click on ‘Launch Cluster’ and fill-in the cluster details:

Fill the form as needed; defaults are fine in this example. Pick a secure password.
Now choose the Node Type; for this example, we’ll use the weakest one: dc1.large and Single Node Cluster Type.

On the next page, your screen settings will also depend on your network setup; most of the defaults are fine for this example.
Review your settings and click on ‘Launch Cluster.’ Your cluster will take some time to build. When it’s ready, click on ‘Cluster Name’ and the cluster overview will be shown. Hostname to connect to will also be visible from Endpoint string:
In our example, hostname is redshift1.cssy86qcwxay.eu-central-1.redshift.amazonaws.com.
Your server should now be successfully set up to accept requests from our IP (52.4.198.118) to your Amazon Redshift cluster database, using your chosen user name and password. Go ahead and load some sample data and it’s ready for connecting to Databox.
2. Connect Your Database Cluster to Databox
The database cluster is now ready! The next step is to connect it and test it’s returning the data we need for our visualizations:
- Log in to the Databox web application and click on the ‘Data Manager’ tab,
- Go to Available data sources option and find the AWS Redshift tile. At the time of this writing, Redshift is still in beta. You will need to check the Beta checkbox on the bottom right to see it,

- Hover over it with your mouse and click the ‘Connect’ button that slides up into view
- Enter your connection data in the popup and click the ‘Activate’ button. Default port 5439 is fine in most cases.

- If all went well, the popup will close shortly and you’ll get a “connected!” message.
Great! You have just successfully connected your database to Databox. In the next step, we’ll write a custom query that will regularly fetch data from your database and make it available for use in any Datacard.
Troubleshooting: If you get a “wrong credentials” message, double-check your user data. If you’re stuck on ‘Activate’ for a minute or so, it’s probably having issues connecting to your database host due to firewall / server / networking issues.
3. Visualize Your Data with Databox Designer
Now that the database is connected, we will use the Designer to query, shape and display the data in a format that’s most appropriate and useful for our needs:
- Choose an existing Datacard or create a new one (how?)
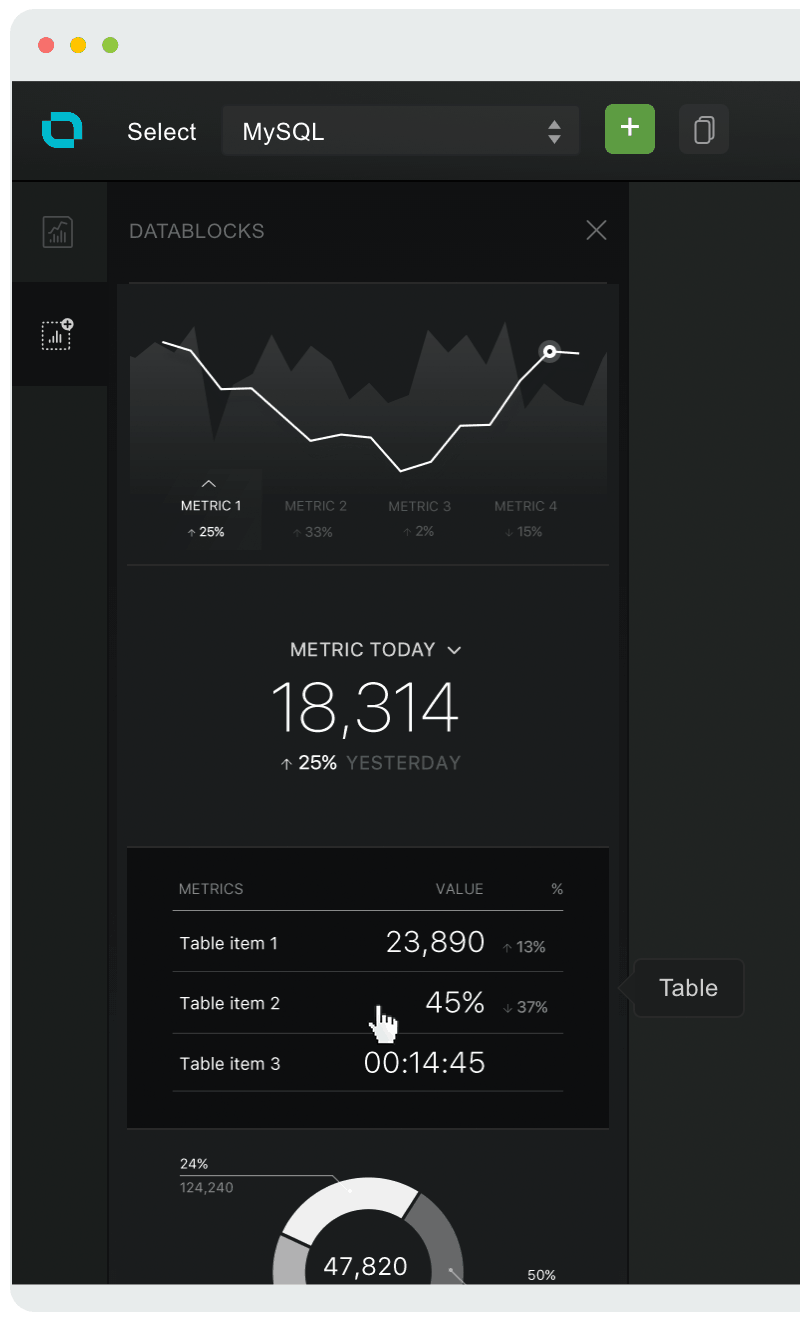
- Choose Datablocks icon on the left
- Drag & drop the Table block onto your Datacard
- For our example, where we will have a dynamic table (the pushed metric key has attributes/lines), we will switch to gather data from ‘Single metric’ in the properties panel on the right
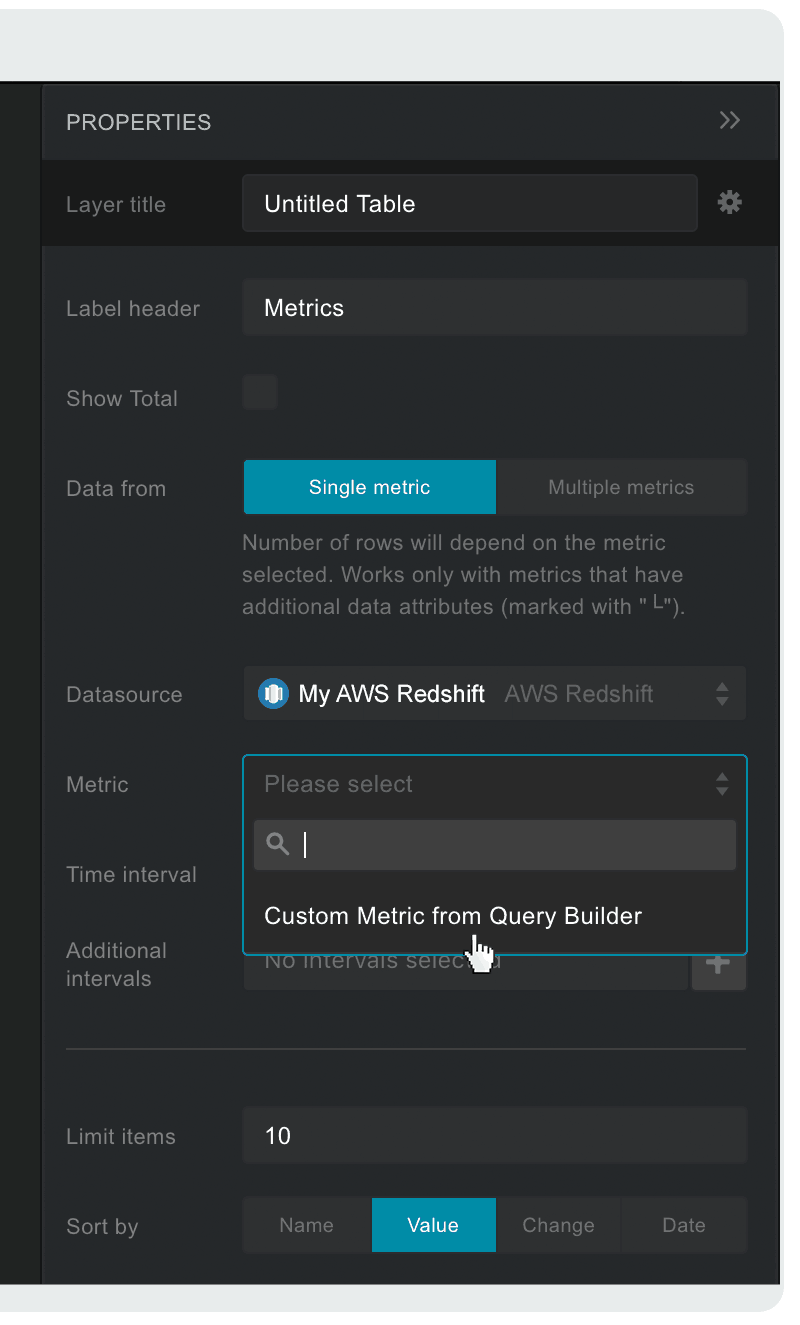
- Select your newly created My AWS Redshift data source from the Datasource dropdown on the right
- Click on the Metric dropdown below Datasource and choose ‘Custom Metric from ‘Metric Builder’
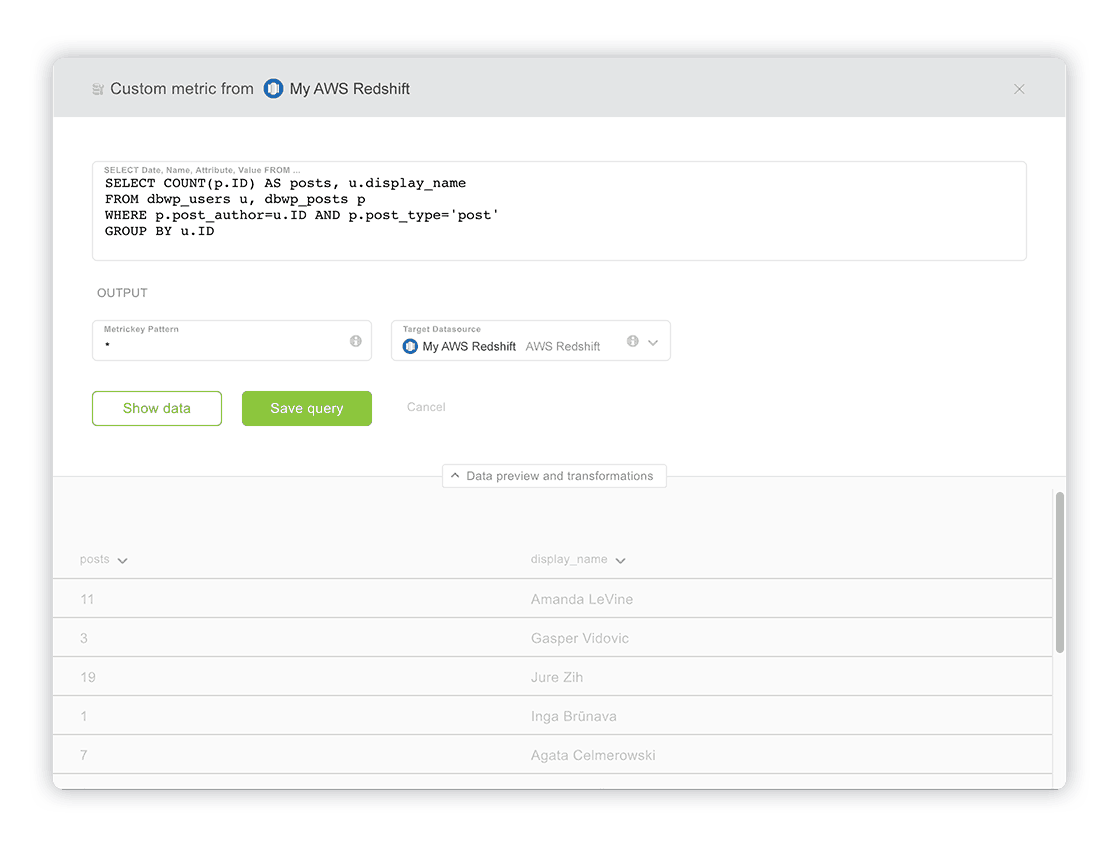
- Write your SQL query in a popup window that appears. For this example, we will write a basic query that returns the number of posts by authors in our database:
SELECT COUNT(p.ID) AS posts, u.display_name, p.date AS date
FROM dbwp_users u, dbwp_posts p
WHERE p.post_author = u.ID AND p.post_type = 'post'
GROUP BY u.ID
- Now click on ‘Show Data,’ below. Your query result should now be displayed at the bottom, similar to this, depending on your data, of course:
- (optional) You can rename each column (which will become a metric key in Databox), by clicking on the arrow beside it and typing in a new name.
- (optional) You can enter a different metric key name pattern or just leaving the asterisk (*), which will create a metric key with the same name as pushed. By default the output (target datasource, where the data gets pushed to), is already selected and is the same as your source data connection. You can use other tokens if needed.
- Once you are satisfied with the data you see, just click ‘Save Query.’
- Tada! After you saved your custom query, you should see the data on the table. If not, check if the right data source and metric are selected. In our example it’s the ‘My AWS Redshift’ data source and ‘└ posts|name’ metric, because we’re pushing posts by names. The time interval should be set to ‘Today,’ to see the latest data.
We have just written a custom SQL query and displayed its results. Databox will continuously, each hour, fetch data from this resource and store it in the selected target data source (in our example ‘My AWS Redshift’).
Writing Queries Basics
Each query must contain a date column containing a valid date, named date. Let’s take a following SQL query for example:
SELECT salary_date AS date, salary FROM employees
In table employees we have a date column named salary_date. As Databox expects column with a name date, we select our salary_date column as date.
Salary is another column, containing a number, column name will be pushed as metric key named salary. This query is valid and can be pushed to Databox.
Troubleshooting: If you don’t see any data, double-check your SQL query, try it directly on your database. If it’s not displaying results there, you have an error somewhere in your query. Also check that the AWS Redshift user has necessary permissions to access the database from Databox IP.
Well done! Your AWS Redshift database is now connected to Databox, queries can be executed and then displayed on your mobile / big screen / computer.

Go ahead and explore further. Add more queries, add blocks, explore different types of visualizations. Make that perfect Datacard (or Datawall of course) you always needed but didn’t know how to get. Now you can! Clean and professional, right at your fingertips. Only data that matters, without clutter. The possibilities are truly endless.
Ready to try it for yourself? Signup for free today and let us know how it went for you.
Remember: we’re always glad to help if you run into any obstacles!


