Table of contents
Although the Datawall, as part of the Databox platform, was primarily designed to be used for big screens hanging on your office walls, we realized many users are using it to follow the KPIs on their desktop computers as well. That’s great!
Databox now offers a simple and effective solution for that, too.
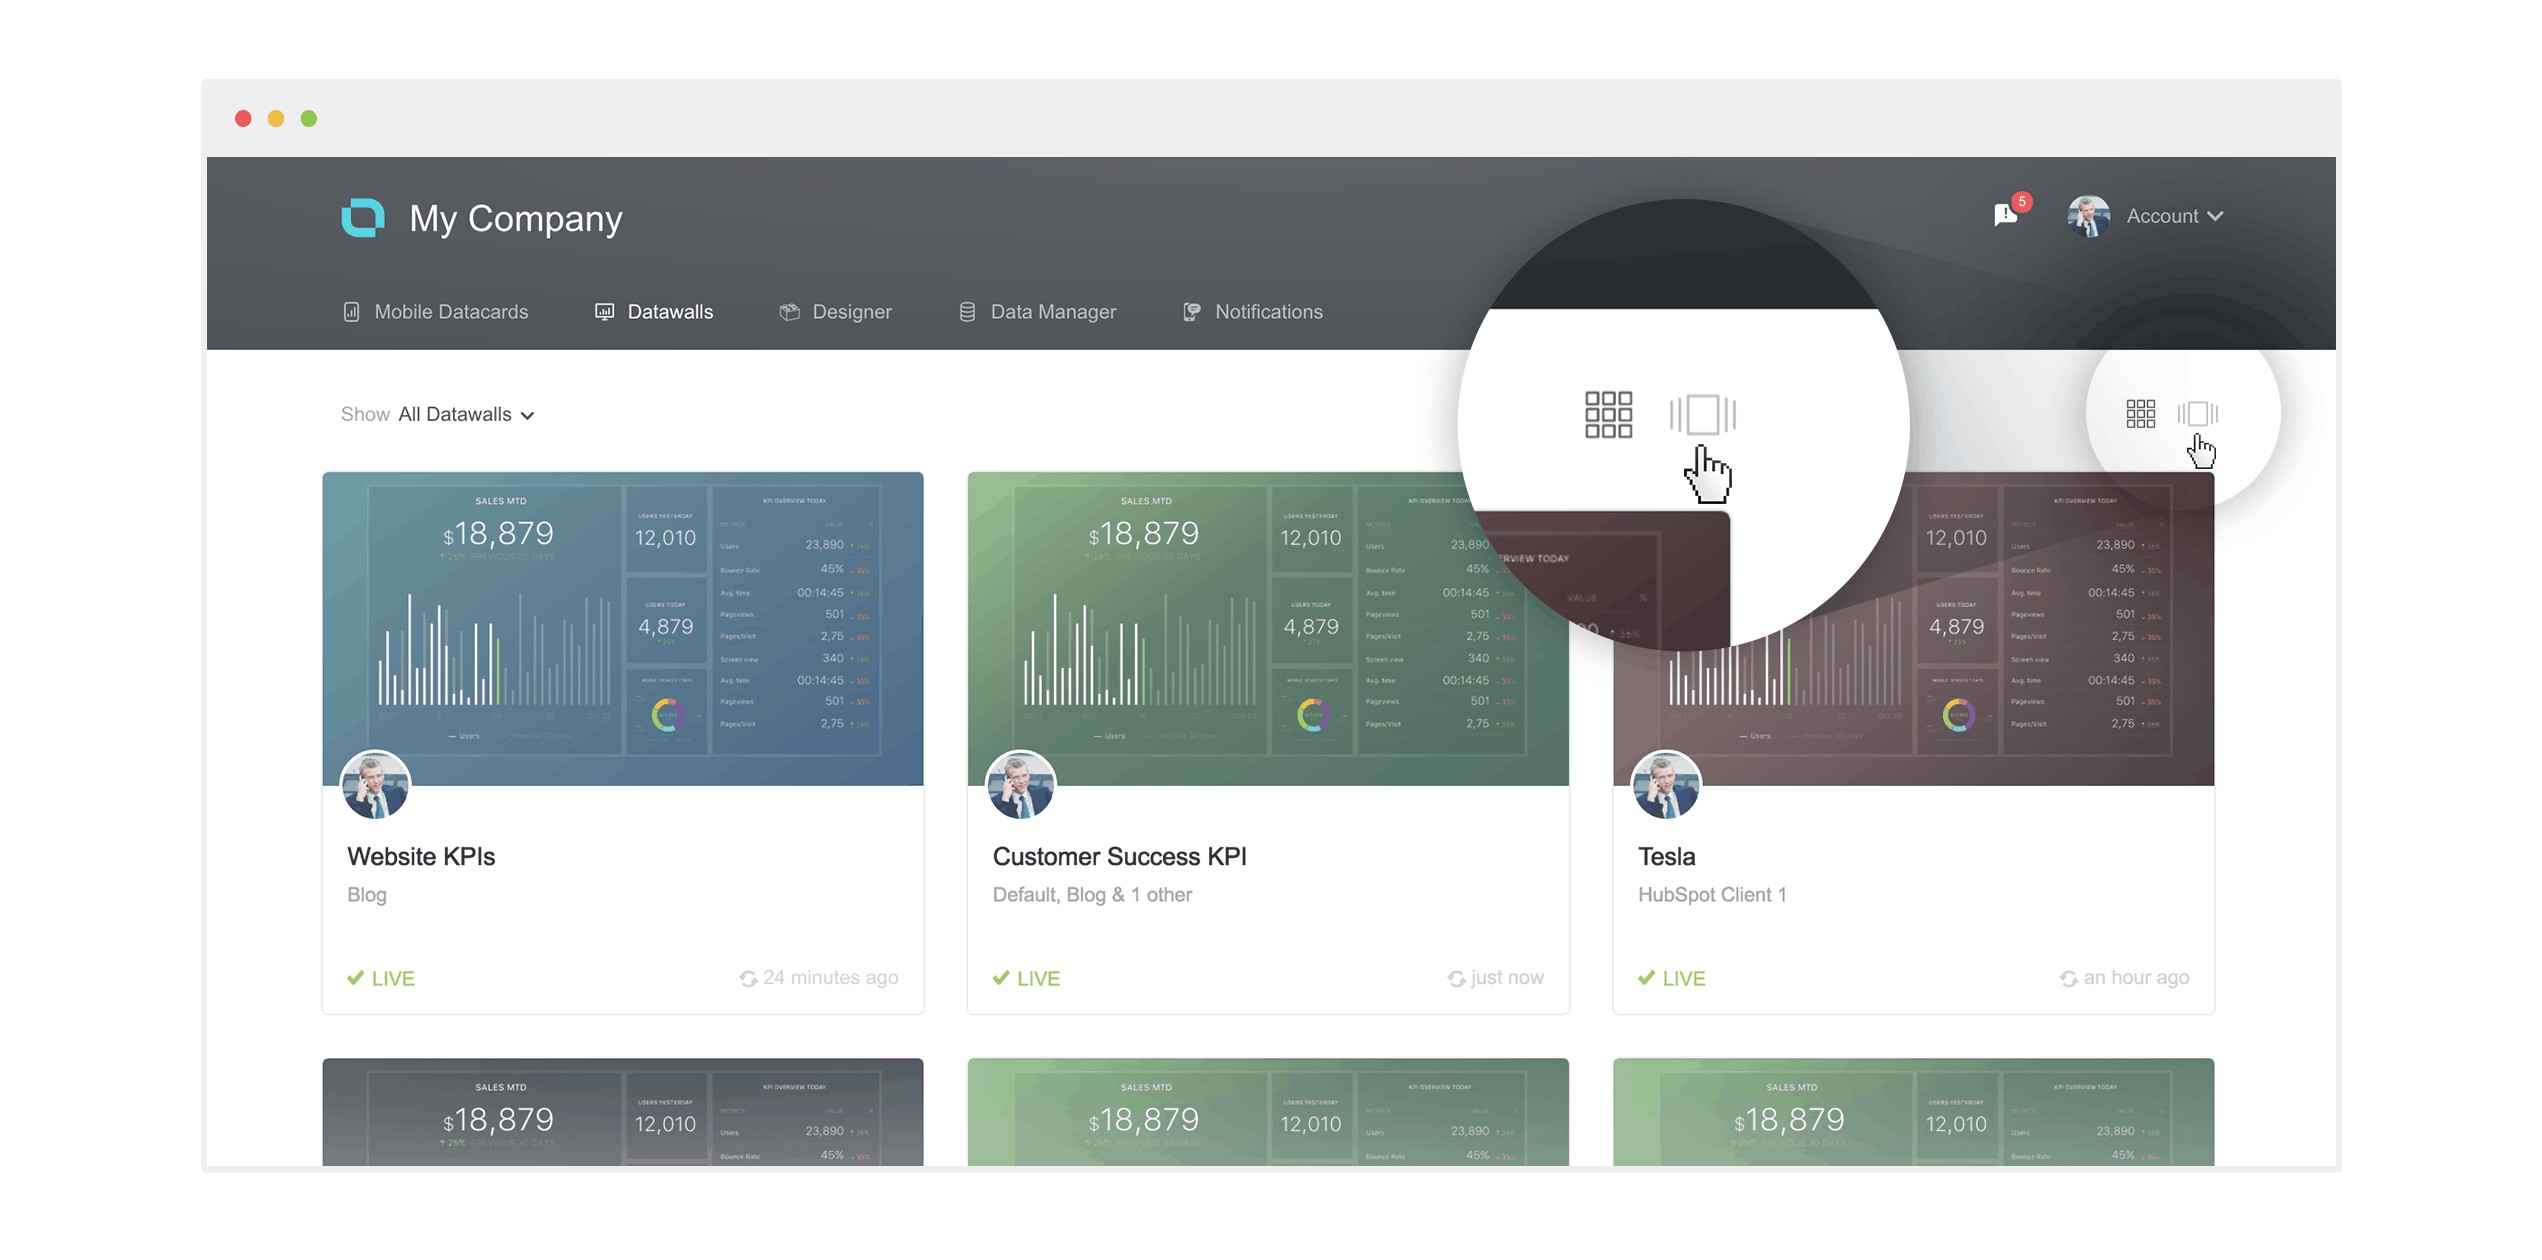
We have built a special desktop view for your browser, where you can easily switch between all your Datawalls. Navigate to the Datawalls tab in the Databox web app and switch from the default basic grid view to the new full-screen view (new icon on the top right corner – see the image below). You can always switch back by closing that view in the top right corner.
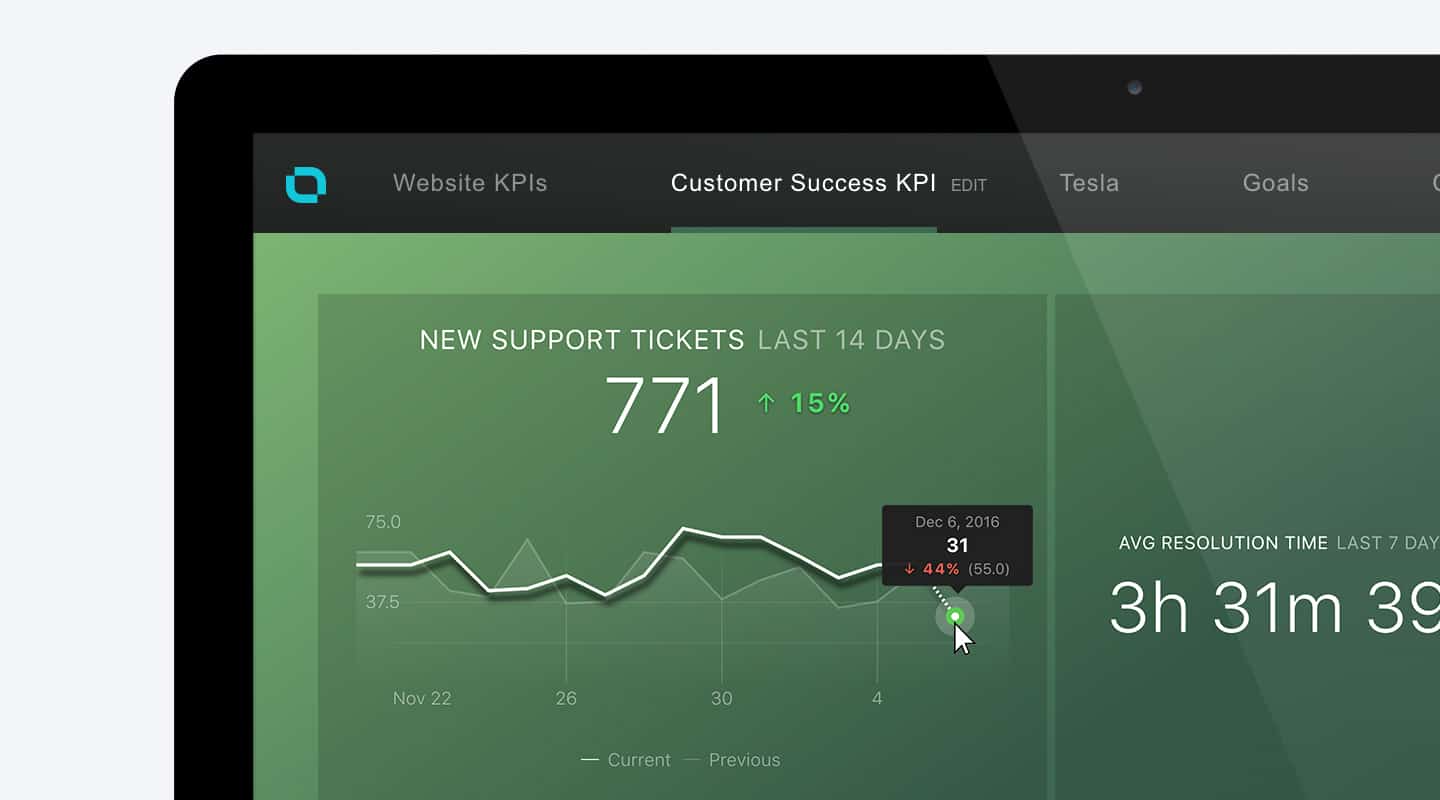
Interactive Datawalls
To make the Datawalls even more useful, we allowed switching between intervals and added a support for tooltips on the charts. With the new tooltips, you can now explore your data outside the mobile app. The tooltips show you the exact value and the comparison to the previous period or goal (depends on your compare settings).
Sharing Datawalls (coming in 2017)
In 2017, you can expect many more cool features for sharing your Datawalls with your co-workers, clients or anyone else not in Databox yet. Stay tuned!