


Table of contents
Scenario: It’s the first Monday of the month, and you are presenting last month’s marketing results to your client.
You feel pretty good about your work from last month. You created some new ads on AdWords that have shown immediate results. Your published blog posts had excellent reach on social media and generated a handful of online orders already.
So, you queue up your big marketing KPI spreadsheet, and excitedly get ready to reveal your progress. Unfortunately, the client does not share your enthusiasm. In fact, they can’t wait for you to finish. They have already seen 3 spreadsheets today, and they didn’t care for those either.
Whether you are pitching C-level executives for your new initiative or an existing client, you need a cognitively fluent way to tell your story. That means you can help your audience understand your metrics with minimal stress.
The Human Brain Does Not Process Raw Numbers Effectively
Here’s the issue– Regardless of whether your audience knows it or not, their brains are quickly becoming overwhelmed by the wall of numbers on the screen. It is cognitively exhausting for them to try and understand all the different trends. They cannot decide if they should be lukewarm or impressed. Instead of spending the mental energy, they are more likely to:
- Blindly trust that you are doing a generally good job, then…
- Push this out of their brain and focus on their other pressing needs
If you want them to stay engaged with your progress, you need to make it simpler for them to understand your achievements.
Perhaps surprisingly, the human brain has little ability to understand absolute numbers, like 10 or 1,000,000. According to cognitive psychology expert Elizabet Spaepen, without the assistance of language to formalize a numerical system, humans cannot naturally count up beyond 3!
For the vast majority of human existence, brains did not need to understand absolute numbers. But, they have always needed to understand relative numbers. We more naturally understand a statement like “20% higher than last month”. Bartering, the dominant form of trade throughout human history, focuses on relative value; the value of one thing is relative to the other. Currency, based on absolute numbers, is actually a recent invention!
The brain also has an evolutionary ability to process visual information in fractions of a second. If a person encountered a threat in a hunter-gatherer society, he or she would need to quickly classify it and react. But, cavemen never needed to process numbers quickly.
Daniel Kahneman famously explores this with his two system theory. System 1, which processes information nearly instantly, allows the brain to quickly comprehend visual information. System 2 is used for more complex calculations. The brain constantly conserves processing power from System 2 because it is so taxing.
Your Audience Cannot Quickly Process Your Columns of Data
Back to your presentation: As soon as your audience sees a KPI spreadsheet, their brains must decide whether it is worth the cognitive energy. And keep in mind, it is competing with motivations like taking care of kids or eating. The marketing spreadsheet is going to lose!
That power from System 2 will be conserved for other uses.
You may be excited to report the tens of thousands of people that have seen your blogging efforts in the past month. But, your client will struggle to put those numbers in context and perceive their difference from the tens of thousands of views you generated the previous month.
However, if you are able to focus on trends rather than raw numbers, they can process it more easily since trends display relative values.
Close the Gap Between You and Your Audience
Here is how to design a data presentation that clients and executives will love. The biggest focus should be simplicity. Do not trivialize or ignore KPIs that you feel are important. Do the opposite. Highlight them by showing the data in context of your goals or historical performance using a marketing dashboard.
Not convinced you should go to the extra effort? You should. Including data that is hard to interpret will actually make you appear less intelligent. The audience will subconsciously assume you are incapable of explaining the data.
And data that is presented in a complex manner will make you appear less trustworthy. Your audience wants to see how you came to your conclusions, not scramble for explanations.
Data that is presented without context takes your audience out of its comfort zone and forces them to consider your data as a completely new set of facts.
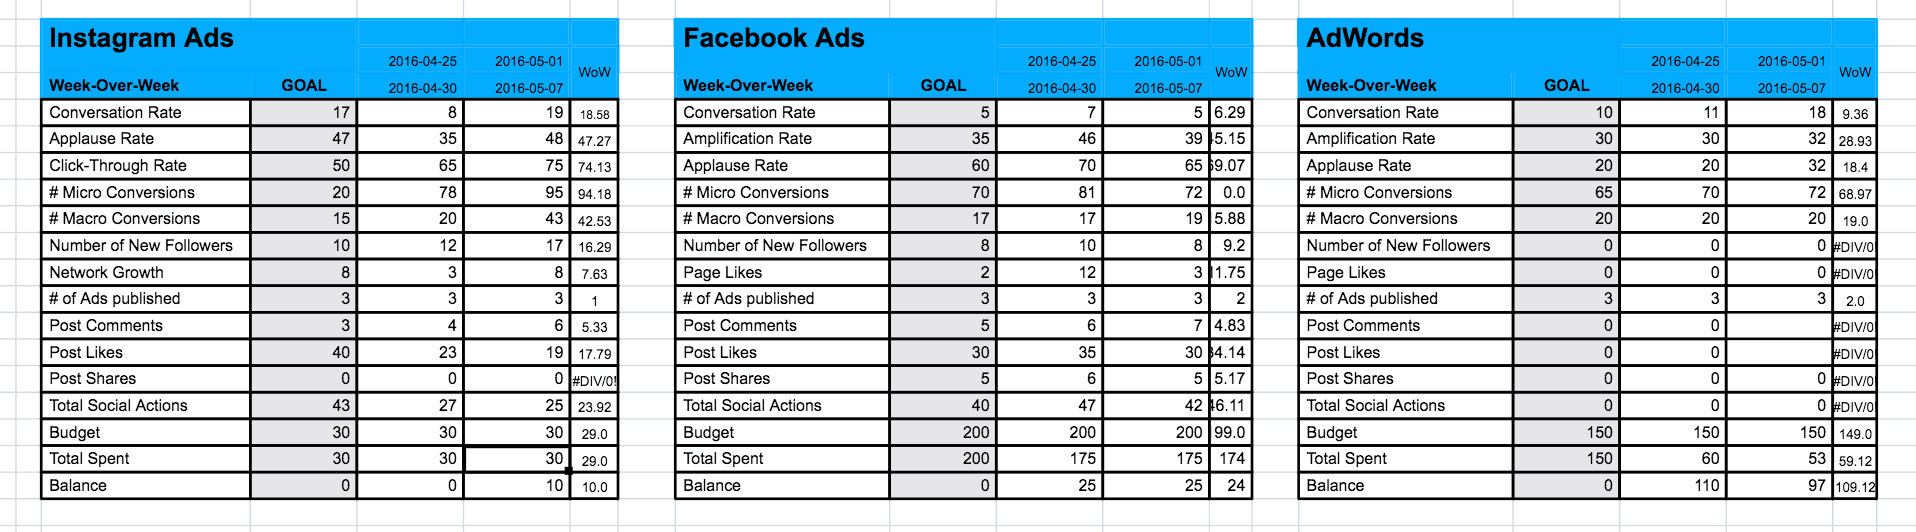
A typical KPI spreadsheet. Source:Facitvate
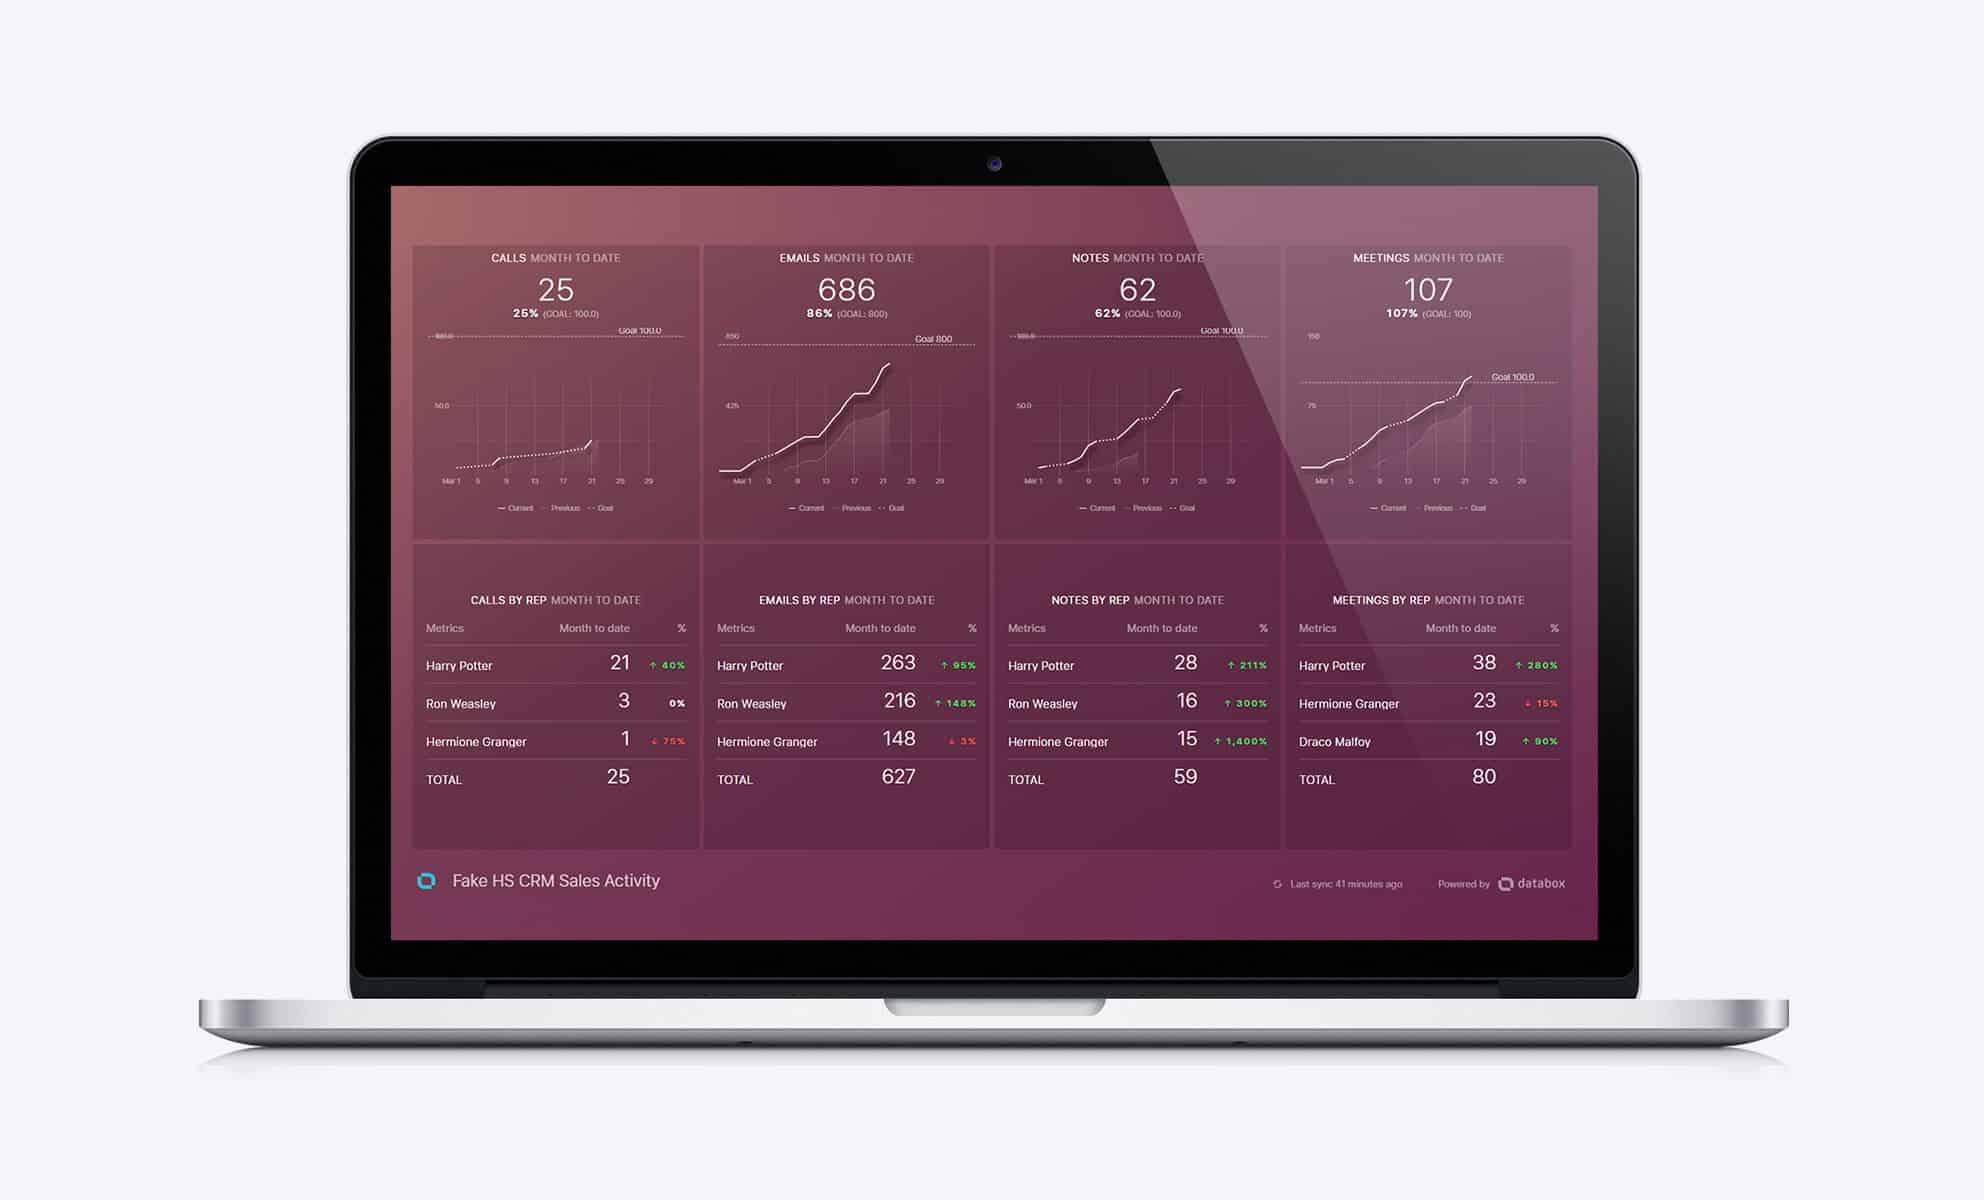
Data visualization showing activity of a sales team versus historical performance and each other.
Turn Raw Numbers into Visualizations So They’re Easier To Comprehend
Data visualization uses a mix of visual information and relative values to make marketing data palatable. In your typical bar graph, line chart or gauge chart, the story is told through the relationships between data points, not the absolute numbers. You are giving your audience a shortcut to understanding the data, so their brain doesn’t need to try and calculate these comparisons from rows of numbers in a spreadsheet. Using relative information reduces cognitive stress.
You allow your story to be processed by System 1 when you use graphs. Leading with visuals allows the audience’s brain to immediately engage. This amplifies the chances that your audience will understand your narrative.
When you can clearly present data using a marketing automation dashboard for example, your audience automatically assumes that you are more intelligent and trustworthy. They’ll relax and be more comfortable around you. They can’t help it!
“If your communications are clear, people will evaluate the communications and the person who created those communications more positively,” advises Daniel Oppenheimer, cognitive psychology professor at UCLA.
Further, when clients are engaged with their KPIs on a weekly basis, they will be able to share the victorious feeling when your strategy works well, even before great outcomes start happening. They track the KPIs consistently with a marketing dashboard software and maximize the ROI of every dollar they spend. And, most importantly, they will trust your judgement on prioritizing their money.
Whatever you do, don’t use a spreadsheet!


