Table of contents
No two clients are ever the same.
Maybe their needs call for a similar strategy—say, content that will help grow their businesses—but that doesn’t mean it should always be served up the same way.
Inbound marketing strategies vary by client, by year, and by month, depending on:
- The company’s focus at the time
- The goals they’re trying to achieve
- How well their current strategies are performing.
So, we need to be able to turn on a dime.
We also need a way to keep our fingers on the pulse, and that means continual monitoring of our efforts using meaningful inbound marketing metrics.
“Meaningful” being the operative word.
HubSpot is the most popular inbound marketing software available and tracks a wide array of metrics, but its priorities don’t always align with those of our clients. Nor do one client’s priority metrics align with another’s at any point in time.
Depending on a client’s current marketing initiatives and the goals they’re trying to reach, we might focus on:
- The performance of a specific blog post,
- The ranking of a particular keyword,
- Website visits from a particular buyer persona, and more.
At Nectafy, when we first started doing reporting, we used the same thing most other marketers were using: spreadsheets.
But spreadsheets had to be altered every time a new metric was needed, and on top of that, bouncing from one data source to another and then pulling it all into a central location was a headache.
Our new method of reporting is both simpler and more powerful: Databox dashboards that reflect the most meaningful data for any given client, collected and compiled on a daily basis.
(Not to mention that Databox is a much more impressive presentation than a spreadsheet!)
Having the ability to pull in data from multiple sources automatically lets us become more flexible in our strategy execution and change up our metrics quickly and easily to match our clients’ needs.
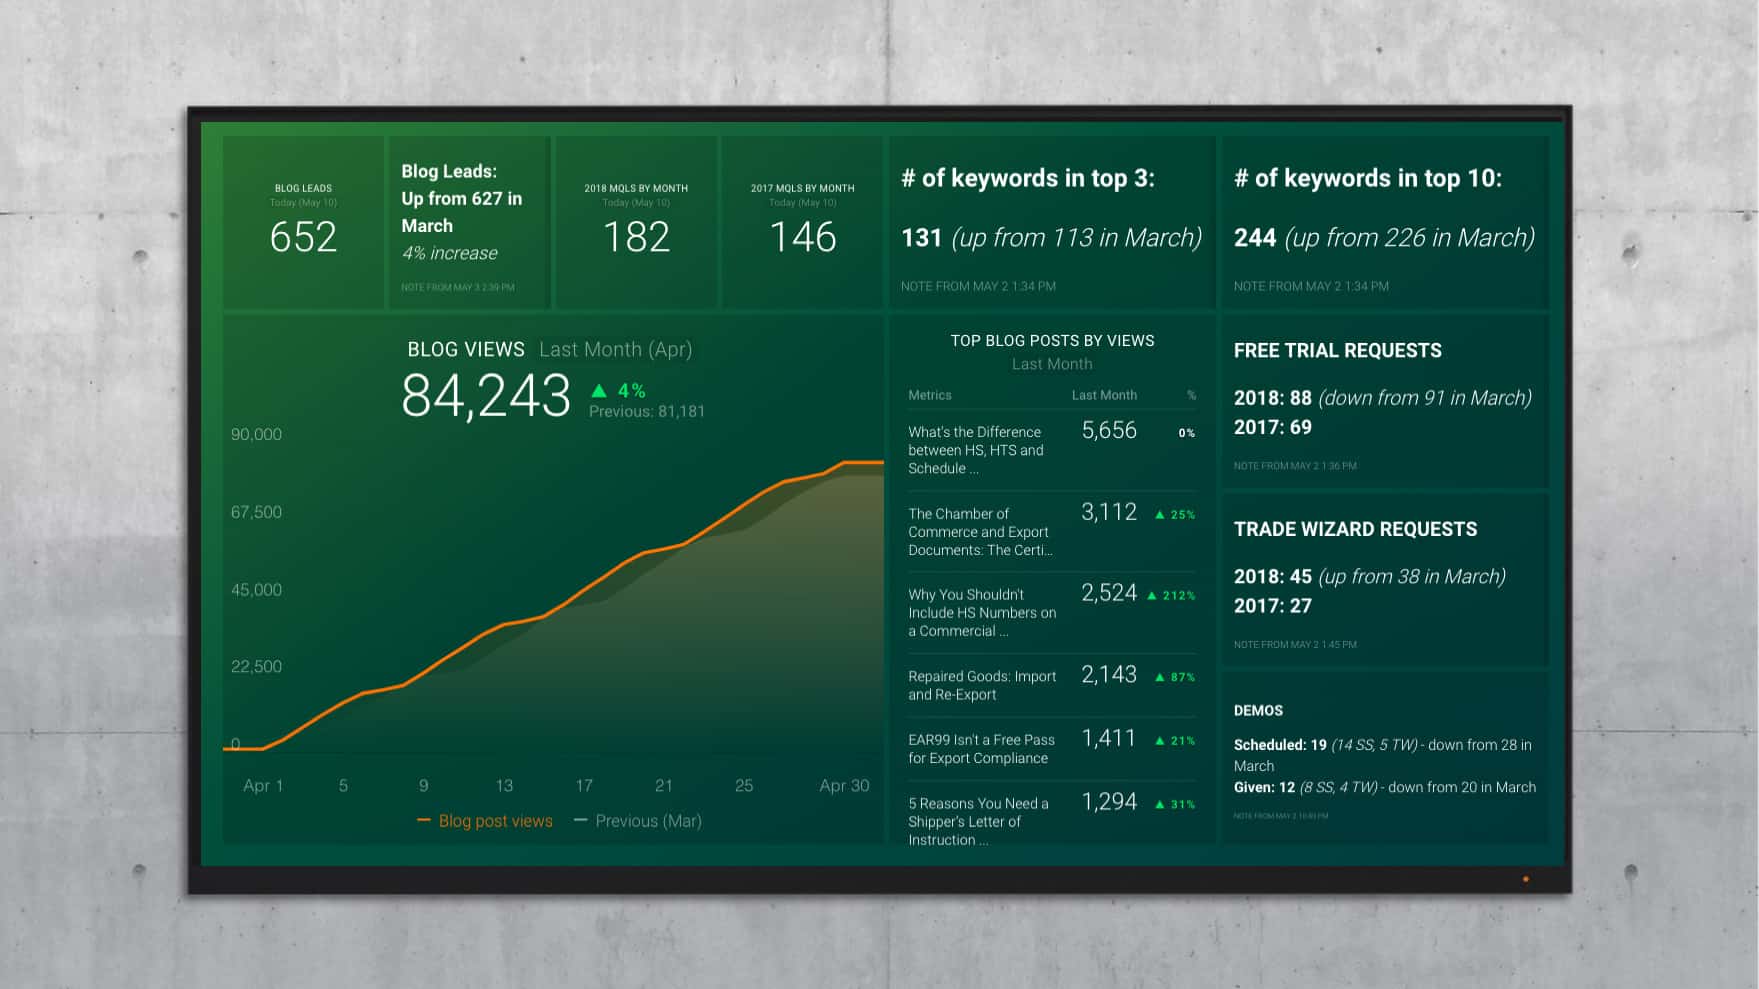
By now, we’ve figured out the best ways to dig up and present the exact data in Databox that our clients want, many of which involve HubSpot’s “smart lists” feature.
Below are five lists we’ve created for clients that truly reflect whether we’re hitting, or missing, the mark.
1: Blog leads based on first website visit
A critical inbound marketing metric for all agencies should be one that tracks how well you’re doing your job, which is to bring in leads organically through blog posts and other types of content.
That means we need to know how often the blog served as the entry point for first-time visitors who then converted into a lead; in other words, visitors who did an internet search for keywords that led them directly to the company’s blog, then downloaded content that converted them into a lead.
Unfortunately, there’s no way for Databox to get that information, because, surprisingly, there’s no easy way to see that information in HubSpot. Not to mention that some of our clients also use Google Analytics, a totally separate platform that we need to pull data from. Those two services make it nearly impossible to get an accurate read on blog leads.
To solve that problem, we created a HubSpot “hack” that allows us to see those visitors who landed on a blog post as their first visit and took some action to convert, whether it was to download an offer, sign up for a demo, etc.
To do that, we created a list in HubSpot and gave it these parameters:
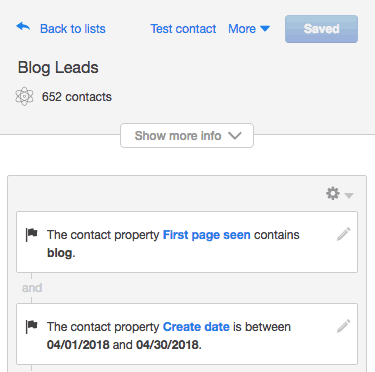
Note that this contact property will only work if your blog posts include “blog” in the URL. (And if not “blog” then some other common slug among all blog posts.)
https://databox-3.wistia.com/medias/487qvbwf6e?embedType=async&videoFoam=true&videoWidth=640
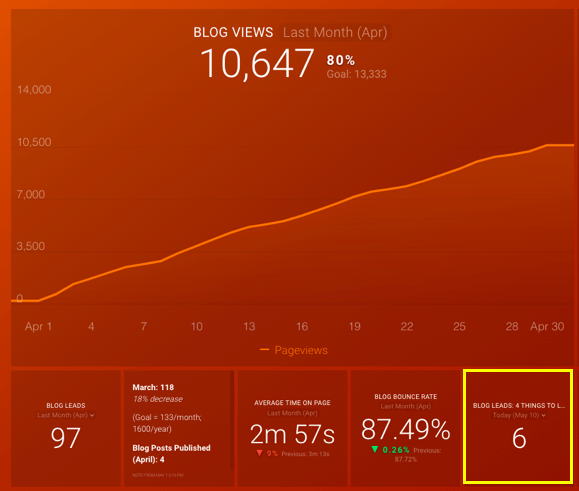
You might notice that the date filter on the Databoard above has a specific date (“today”) instead of “last month.”
That’s because as we pulled a Smart List into Databox, we noticed that when selecting the “last month” filter (which is typically the timeframe we’re reporting on for our clients), the correct number from the Smart List doesn’t appear on the Databoard. By leaving the date filter on “today” – assuming the Smart List is set up properly in HubSpot—then the correct data will always be pulled into Databox.
2. Blog leads by blog post (first visit)
While the above metric is useful for all clients, here’s where some customization comes in. We sometimes craft specific types of content if the strategy calls for it, like massive long-form posts to boost authority on a topic or “combination” posts to refresh keyword rankings.
As a result, clients may want to track the performance of those specific blog posts, which tells us if we’re on the right track or if we need to try a new tactic to reach our goal.
To create a list determining the number of leads generated by a specific blog post, set up a Smart List that says the first page seen equals the URL of the blog post you want to track and the proper reporting timeframe:

Then tell Databox to pull in the data associated with that smart list.
3. Leads from other domains
According to HubSpot, a lead is someone who has indicated interest in a company’s product or service by having been converted on a form or added to the contact database. But all our clients don’t define leads this way. For some, identifying a lead is a little trickier.
One of our clients runs two companies, both of which are set up in the same HubSpot portal. There’s a fair amount of cross-site traffic–visitors who come in on one website may click on a link taking them to the other site, and then download something there, and vice versa. That prospect would then be considered a lead on the site they downloaded from, not the site where they entered.
To make sure we’re funneling in the right numbers for what our client deems a lead, we need to create lists with that specific criteria.
So in this example of our client that has two companies in the same HubSpot portal, we have to make sure both lists are explicit with the criteria:
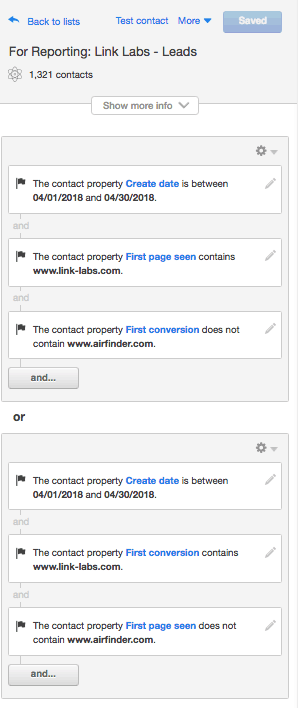
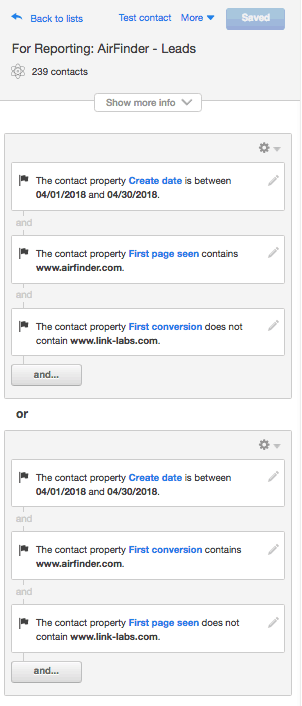
If your company defines a lead differently from HubSpot, creating a smart list that pulls in your unique lead parameters will give you an accurate way of reporting on leads.
4. Form submissions
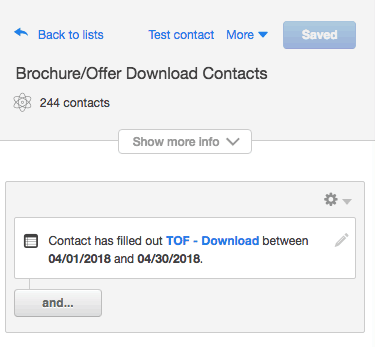
Sometimes a client wants to know, “How many downloads did we have last month on all our offers combined?”
If you use the same form for all offers, all you have to do is go to the Forms page in HubSpot, select the date range you’re reporting on, type in the form you want to report on, and voila—you see the total number of form views and the number of submissions across all pages, right in one spot.

To find everyone who has submitted forms that you or your client are interested in, set up a list in HubSpot and pull that data into Databox. Here’s an example where the client uses the same form on all offer landing pages:
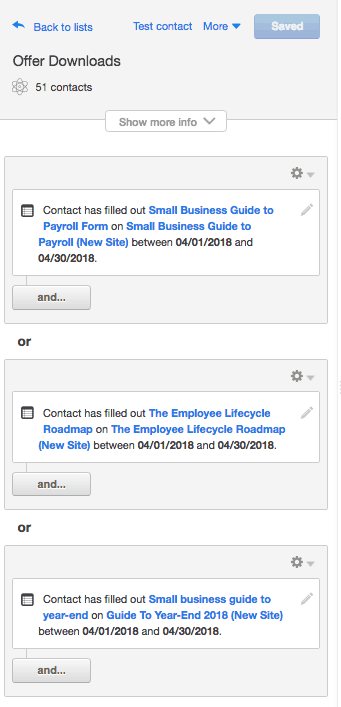
Some clients prefer a separate form for every download. In that case, you would add all the forms you want to track in the list, refine the reporting dates, and then pull this smart list into Databox:
5. Buyer personas
Some clients have numerous buyer personas—five or more.
They like to see how many visitors and leads are attributed to each persona periodically. Knowing this information, we can tweak our content to nurture one persona over another at any given time, depending on the company’s current focus.
Before you can create this buyer persona list, you have to add your personas in HubSpot. Once those have been added, you can then define the criteria for each persona in HubSpot—what makes someone fit into each of these categories in the first place?
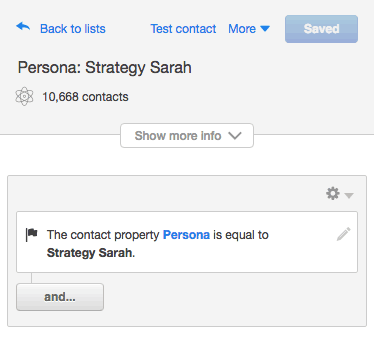
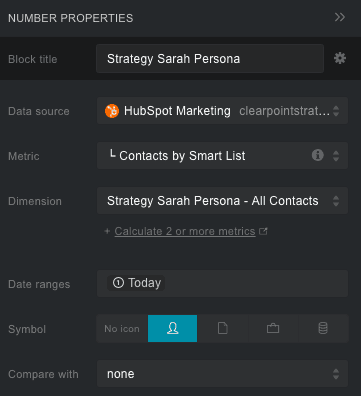
For example, you may determine that your Strategy Sarah persona applies to anyone who first converted on your site by downloading your Strategy ebook and describes themselves on one of your forms as a “Chief Strategy Officer.”
Then, set up a workflow directing anyone who fits the specified criteria to be labeled as a certain persona.
Finally, you can create a list to pull specific persona contacts:
And then pull the list into Databox using the following properties:
Why you should pull smart lists into Databox
This method of data presentation makes the most of both HubSpot and Databox.
Not only does it easily bring the most valuable data front and center, but it also offers the flexibility to change focus quickly. We frequently alter our Databox views to accommodate client requests, which sometimes means making new HubSpot lists on the fly. We also utilize Databox’s Scheduled Snapshot tool so we can compare today’s numbers against those of last week or last month.
Use these ideas as a jumping-off point for gathering your own most valuable metrics, and see the difference it makes in your strategy planning going forward.


