


![Want More Signups? Track & Optimize Your Sales Funnel Like This Instead [Data Snacks]](https://cdnwebsite.databox.com/wp-content/uploads/2018/03/29141704/datasnacks_video_opener.jpg "Want More Signups? Track & Optimize Your Sales Funnel Like This Instead [Data Snacks]")
Table of contents
The traditional view of your sales funnel is broken.
When your marketing team is making bets on where to focus growth and optimization efforts, you want their starting point for ideation to be as close to the problem as possible.
But when you’re looking at your sales funnel in broad terms like visits, leads, and sales, where do you even begin?
“Sure, we need more leads. Where do we start?”
There’s a more effective way of visualizing your sales funnel. Watch as I walk you through it in this episode of Data Snacks.
Tracking the customer journey
/div>
Audio transcription
The term “sales funnel” has become so institutionalized that very few marketers actually understand how it can provide meaningful direction for improving conversion rates.
When most people think about their sales funnel, they think about visitors, leads, and customers.
The problem with thinking about your funnel in such broad terms like this is that it lacks the clarity to really give you and your team a direction in terms of which areas have high-leverage, high-probability opportunities for improvement.
What ends up happening is your team focuses on something broad, like increasing leads, and because there’s little substance as to where the real opportunities are for moving these numbers, your team ends up executing a bunch of low-probability projects in areas of the funnel that, in reality, aren’t the issue.
The customer journey
Now if we look at this dashboard here, what I’ve created is a more focused funnel around the customer journey.
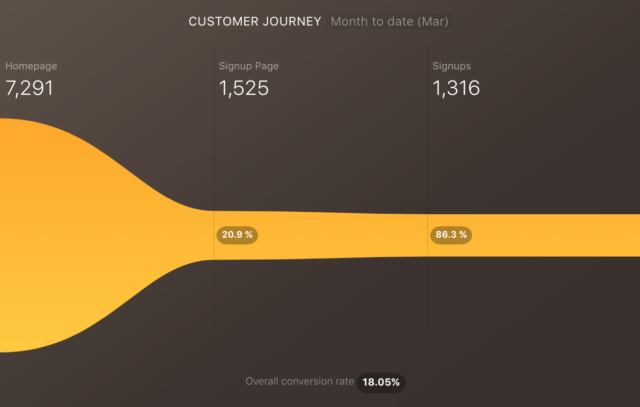
What I’m tracking here are specific entry points and inputs that lead to signups, leads, or customers.
In this case, I’m tracking the number of people that come to the homepage, which is one entry point of our customer journey. (Others could be specific blog posts people find organically, etc.)
Next, I’m tracking the overall number of people that move from the homepage to our signup page, and from there, the number of people who actually sign up.
So what I’ve done is I’ve shrunk my area of focus significantly to track one entry point, the homepage, and how that customer journey converts.
As you can see from the image above, instead of 35,000 sessions, I’m dealing with 7,000 unique homepage users, and I see that 20% of those people have made it to the signup page. So now this gives me a more precise area of focus in terms of optimization.
Now instead of, “how do we generate more leads?”, our challenge becomes, “how do we drive more people from the homepage to the signup page?” This gives our team a really solid area of focus.
We can use heatmapping software to study how people engage with the homepage, how far they scroll, where they click, etc.
Is our copy on point? Are there things we can test here in terms of headlines or button copy?
Are people not even scrolling to where the call-to-action is?
Is there a competing CTA that’s driving visitors to a lower intent page?
How long are people even staying on the page?
These are the right questions to be asking because when I look at the conversion rate of the signup page at 85%, that’s incredible. Sure, there might be some tweaks there that we can make, but we’ll very quickly see diminishing returns because it’s already such a high conversion rate.
The opportunity here is driving more people from the homepage to the signup page, something that would’ve been much harder to uncover if we were only looking at overall traffic, leads, and signups.
Journey over funnel
The idea behind the sales funnel is self-serving.
How many sessions did we generate? How many leads did we acquire? How many converted to paying customers?
Don’t get me wrong, these are important questions, but when you’re looking to make bets on the projects that will move numbers, there aren’t many insights you can take from those answers.
But when I look at the journey the customer is taking through various entry points, in this case, the homepage, I can identify where the sticking points are and make smarter bets on how to help.
I want to show you quickly how I used a tool in Databox, called Query Builder, to build the custom metrics I shared above.
I built my own custom metric tracking:
- Metric: Users
- Dimension: Page Title
- Filter: Where Page Title equals [insert your homepage page title here]
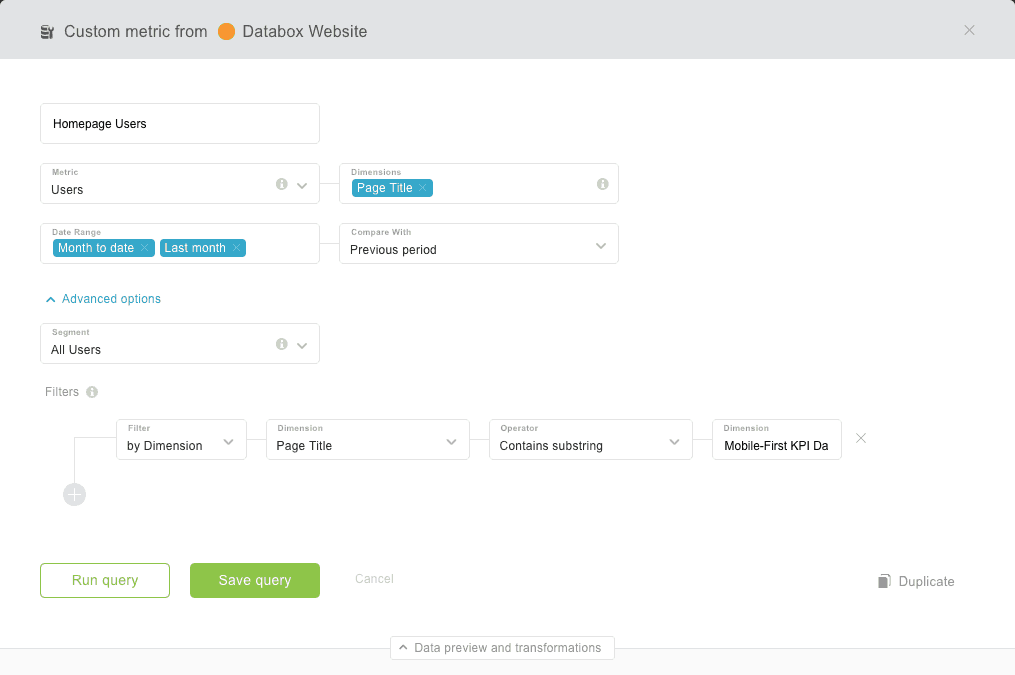
Now I’ve built a custom metric tracking users to our homepage, providing the foundation for the funnel I’m building around the customer journey. Next, I did the same thing for the signup page, and since I’m already tracking actual signups in Google Analytics, I simply pulled “Goal Completions” for the bottom of my funnel.
Now I can track homepage visits>signup page>signup.
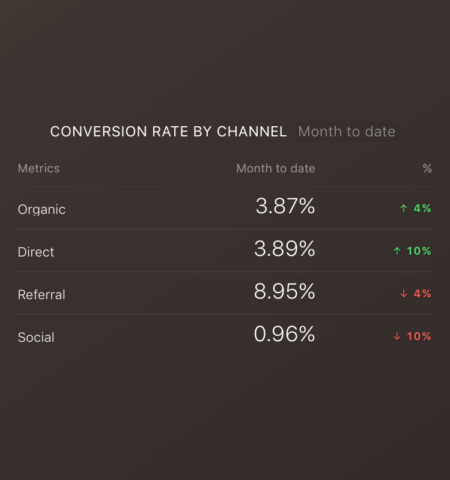
You can get even more specific, and the table that you see here shows additional ways that I can filter my entry point. As you can see, the conversion rates vary depending on the channel in which a website visitor originates from, therefore I can eventually filter my customer journey funnel to show only organic homepage visitors>signup page>signup, and so on.
This type of analysis would only be helpful if you’re already doing significant volume in terms of website traffic, so don’t go crazy splitting hairs. Start by mapping out your different entry points and how you’re attempting to drive people toward a signup.
Break down your funnel accordingly to track those different inputs and you’ll have a much clearer picture of where the opportunities are. Additionally, use this sales funnel dashboard to monitor your prospects as they move through each stage of the buyer’s journey.
P.S. Query Builder, the tool used to build these custom metrics, is available on our Plus and Business plans. However, if you want to try it out temporarily so you can build this view, send an email here and say, “I want to try Query Builder.”


