Table of contents
Databox has always been focused on simplifying the task of monitoring the metrics that matter.
Improving that experience across the board is a constant among our product, marketing, and customer support strategy. A few months ago, our team set out to simplify the setup experience for new users even further.
What started as another project on the roadmap turned into something bigger–a mission.
Our mission.
By making it possible to quickly and easily track and report key metrics, we make it possible for our users to spend more time improving those numbers.
Our team had plenty of ideas on how we could achieve this mission for more of our users, but before we started, we needed feedback. So we asked users. And not just customers, but website visitors and freemium users, too.
Through two weeks of full-funnel research, we received (and answered) lots of questions and gathered feedback. After we reviewed all of the conversations we had, we identified three central themes in the questions people asked:
- What metrics should I track?
- How can I track ‘X’ metric?
- How do I visualize ‘Y’ metric?
If you add up all the time you spend trying to answer those questions for yourself, how much time is left to actually do the work that will improve performance?
Not enough.
Today we’re announcing two updates that make it easier for our users to find, track, and visualize the metrics that matter most:
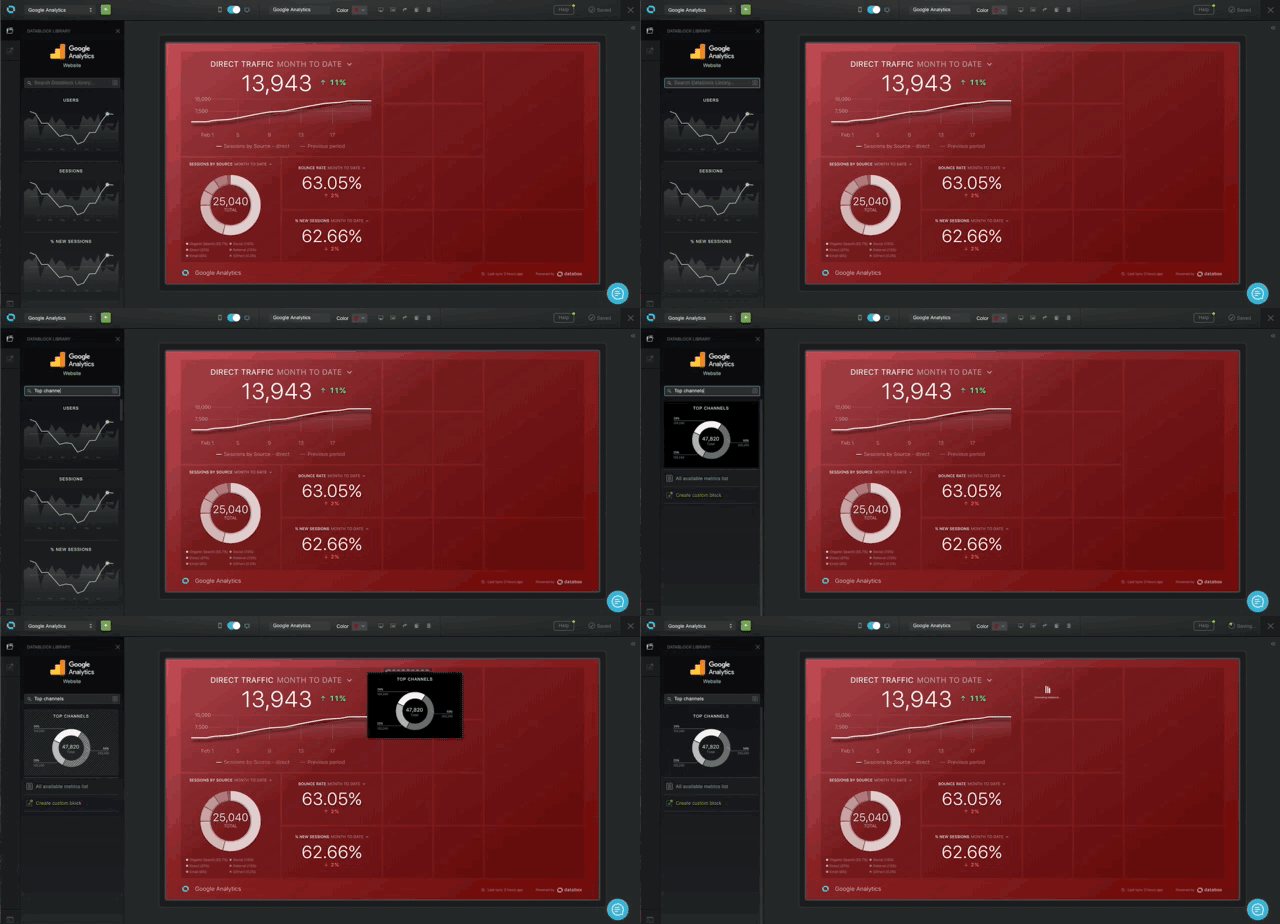
- New search functionality within the Datablock Library, allowing you to find and pull data quicker.
- An “All Available Metrics” menu that allows you to see every single metric, for any data source, that Databox can track out-of-the-box. (You can also create custom metrics using Query Builder.)
Want to see this new functionality in action? Watch this two-minute video I recorded…
Search the Datablock Library
Databox features pre-configured Datablocks for the most popular metrics across 130+ data sources.
While this makes it easy for you to pull in important metrics from a specific source, we recognized that scrolling through 45 Datablocks for Google Analytics, for example, isn’t necessarily quick.
We changed that by adding a search function to the Datablock Library, where you can now search all of the available Datablocks and quickly find the ones you need.

Browse all available metrics
The biggest question we hear from new users is, “do you track ‘X’ metric?”
Now it’s easy for all users to quickly browse a list of all of the available out-of-the-box metrics for any of our 130+ integrations. (You can also create custom metrics for 21 of those integrations using Query Builder.)
By clicking the list icon in the search bar, you’ll open a menu of all of the available out-of-the-box metrics for the data source you’re currently viewing.
Join us on our mission
At Databox, we’re making key performance insights more accessible for marketers and the companies they work for, so everyone can quickly get the information they need to track, iterate, and improve their work.
If you’re already a user, please tell us how we’re doing. If you’re not, start with our free plan and get back to us with your thoughts.


