


Table of contents
If there is a source of data out there that is meaningful to you, our mission is to make it as easy as possible to integrate it with Databox.
We’ve always nurtured an open culture at Databox, where all knowledge, experience and different points of view are encouraged to spread freely. And we think the same when it comes to our product. Not only do we want to build a platform with many connectors available out-of-the-box, but we also want to enable connecting to other systems that already integrate with hundreds of services.
Zapier came to our attention a while ago when we started to automate some of the tasks we were doing on a regular basis. It provides a simple service that allows you to connect with 650+ products and with minimal technical skills required.
We have several zaps live that help us synchronize our user data between Intercom, Mailchimp and some other services. In its own definition, Zapier connects the web apps you use to easily move your data and automate tedious tasks. So why not move your data into Databox as well?
Zapier acts as a universal data connector that will bridge the gap between Databox and other products. You can send various metrics and events to Databox via Zapier and register them as datapoints that will show up on any visualization you choose.
OK, let’s show it off with an example.
1. Create a new token
To get started, you’ll first need to get your token in Databox. You can do that bycreating a new Zapier connection in our web application. This will generate a unique push token that will allow Zapier to send data to your Databox account.

2. Create a new Zap
Now switching over to Zapier, where you start by creating a new Zap. For a demo trigger, we’ll be using Test Email by Zapier, a built-in service from Zapier that will trigger every time an email is sent to a custom @zapiermail.com address.
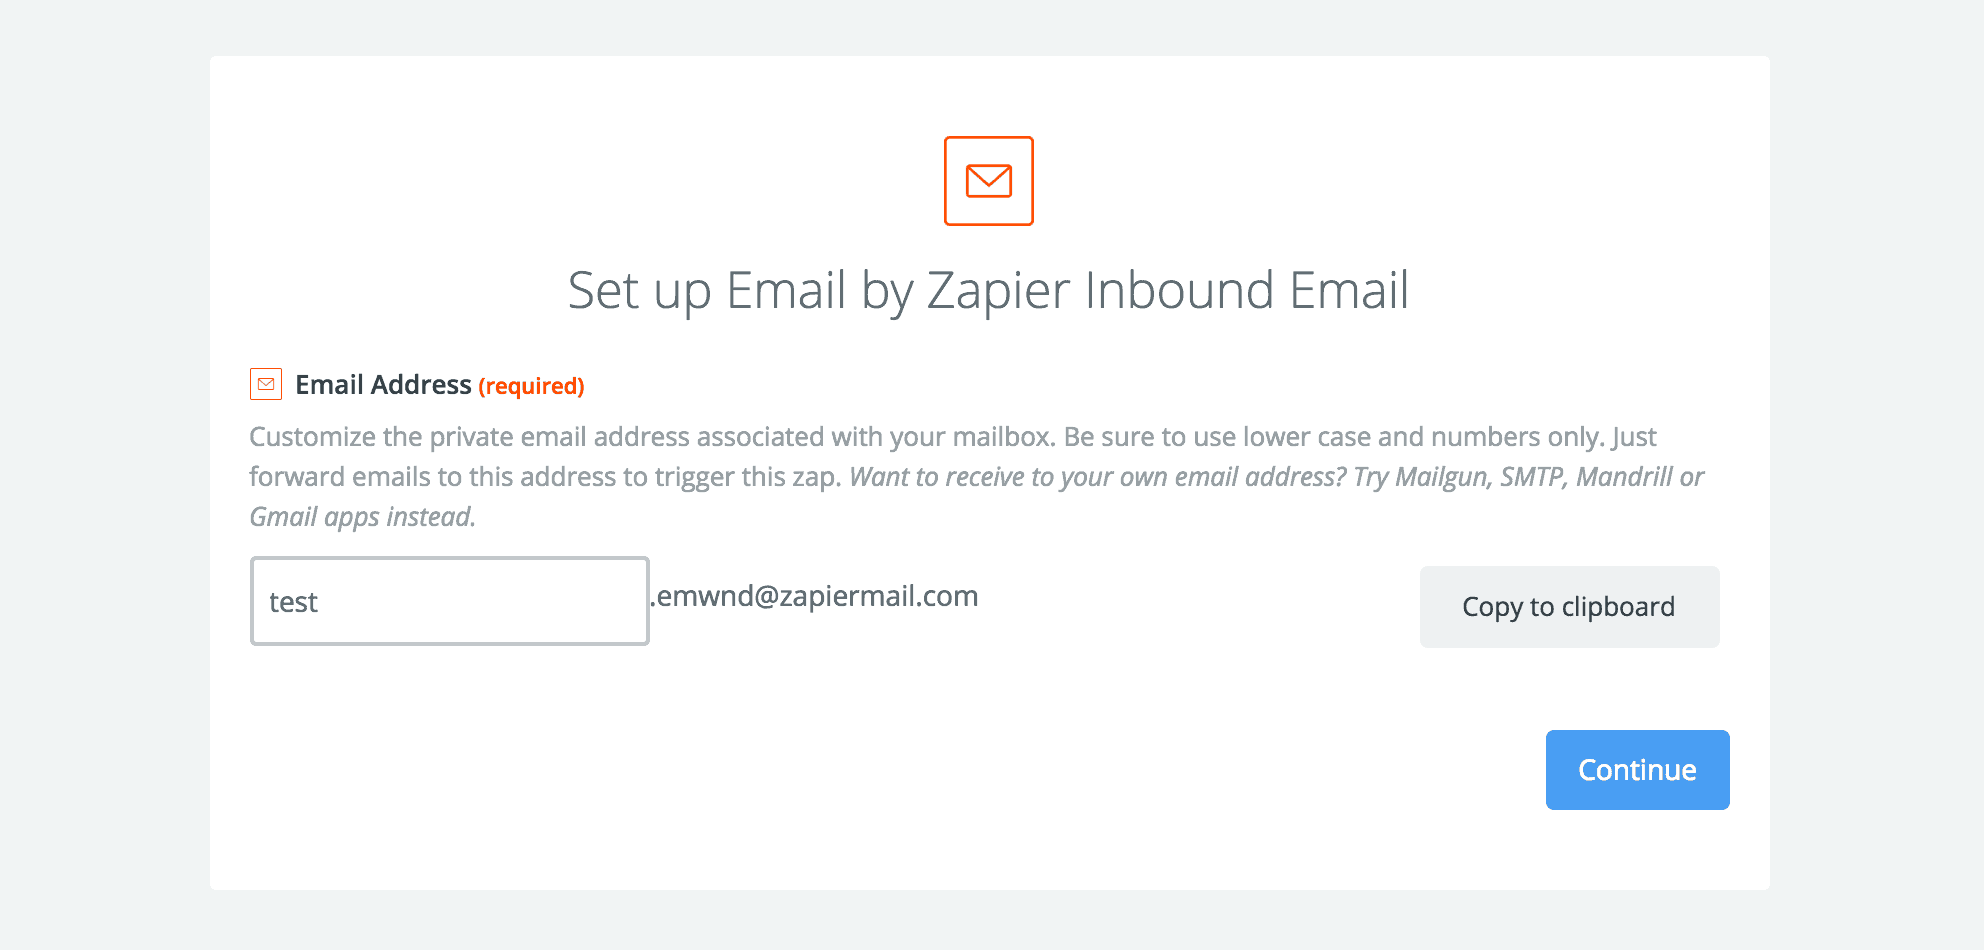
In a real-life scenario, your trigger can be any event you want to observe and keep track of in Databox. For example: every time you get a new user in Intercom, a new email subscriber in Campaign Monitor, or maybe a new transaction in Stripe.
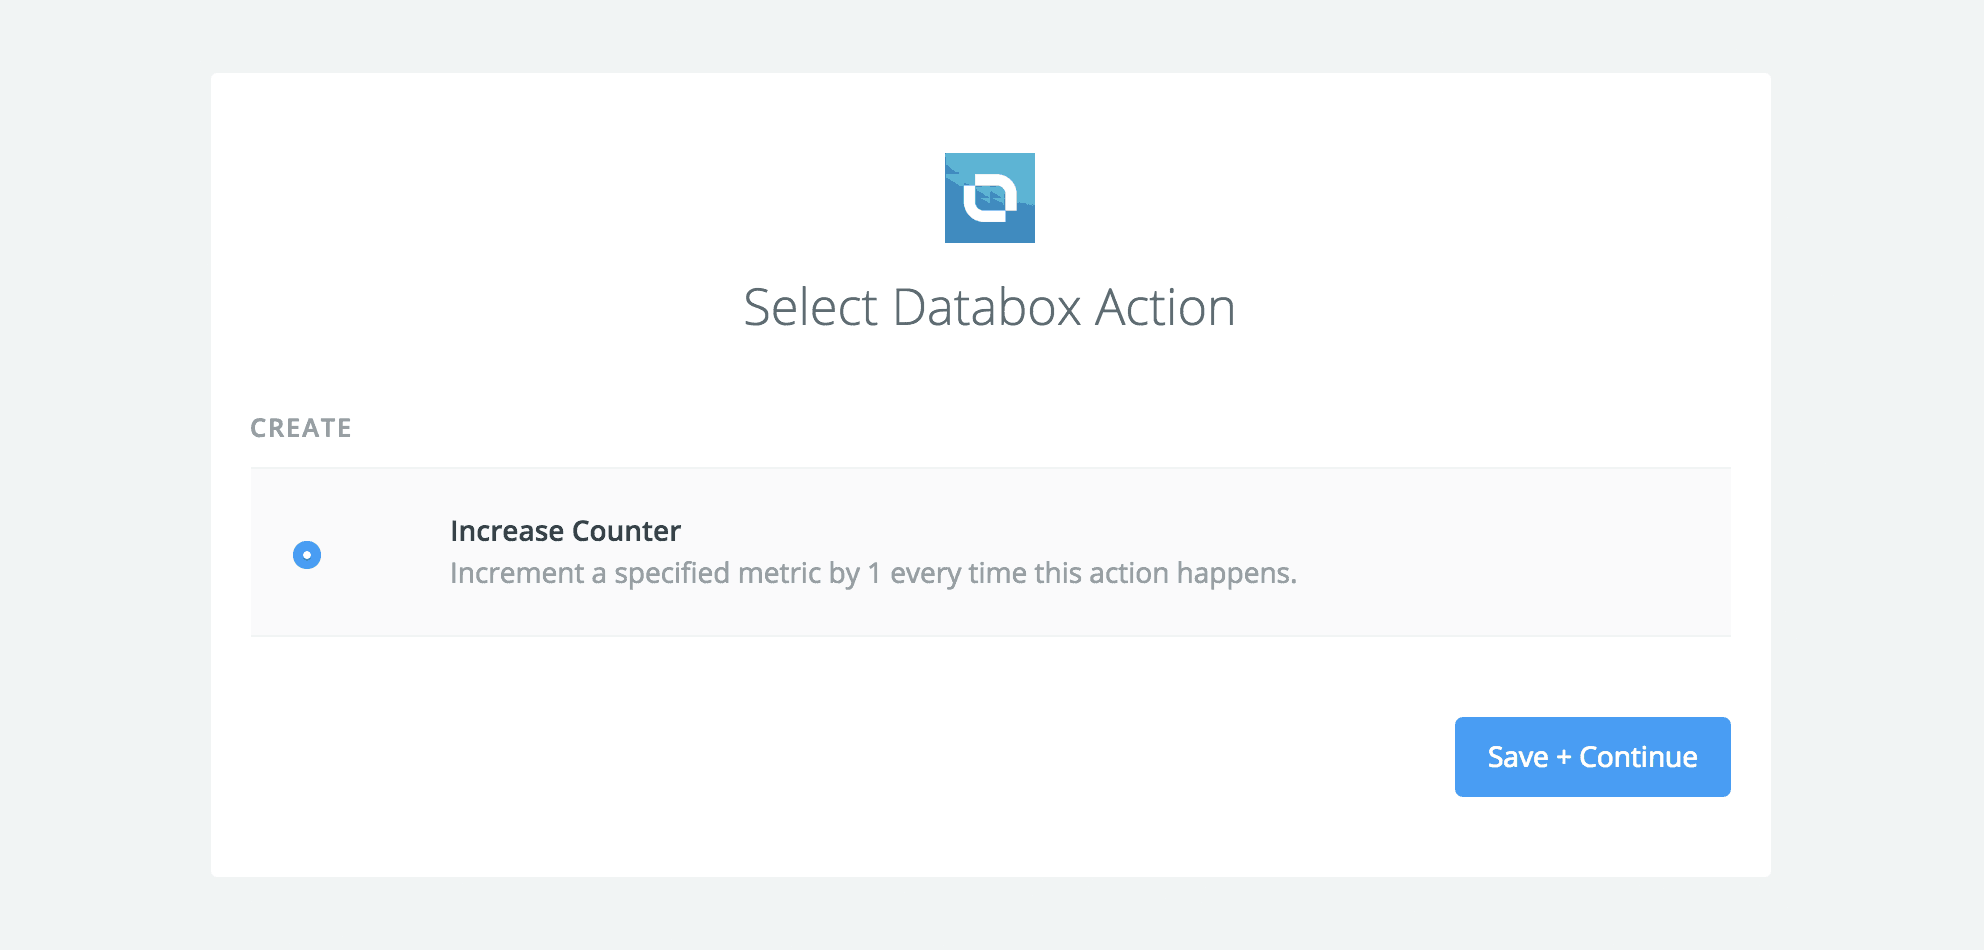
The next step is to define the action that follows that trigger. Databox has a pretty straightforward logic with Zapier. Every action that is triggered in a Zap will count as one event and will increment the current daily value, stored under that key in Databox.
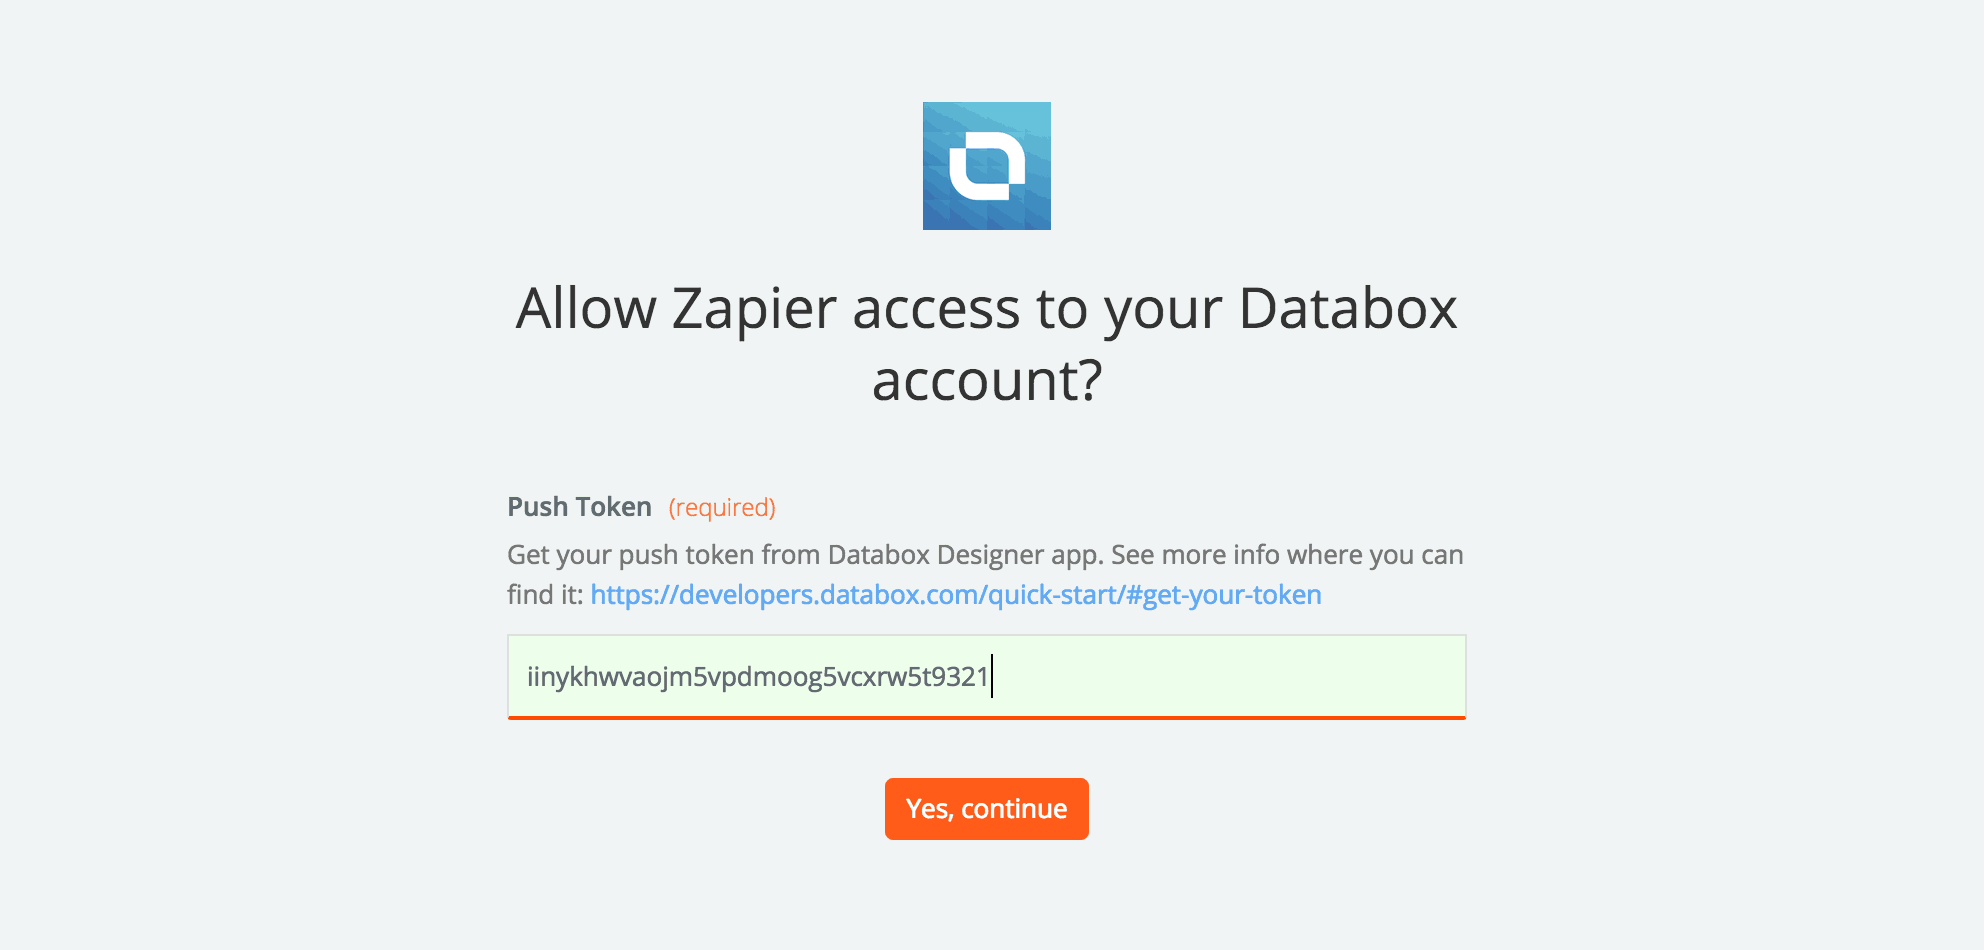
On the next step you’ll be required to select an existing Databox account in Zapier or create a new one. To create a new one just use the push token that you generated earlier in the Databox platform.
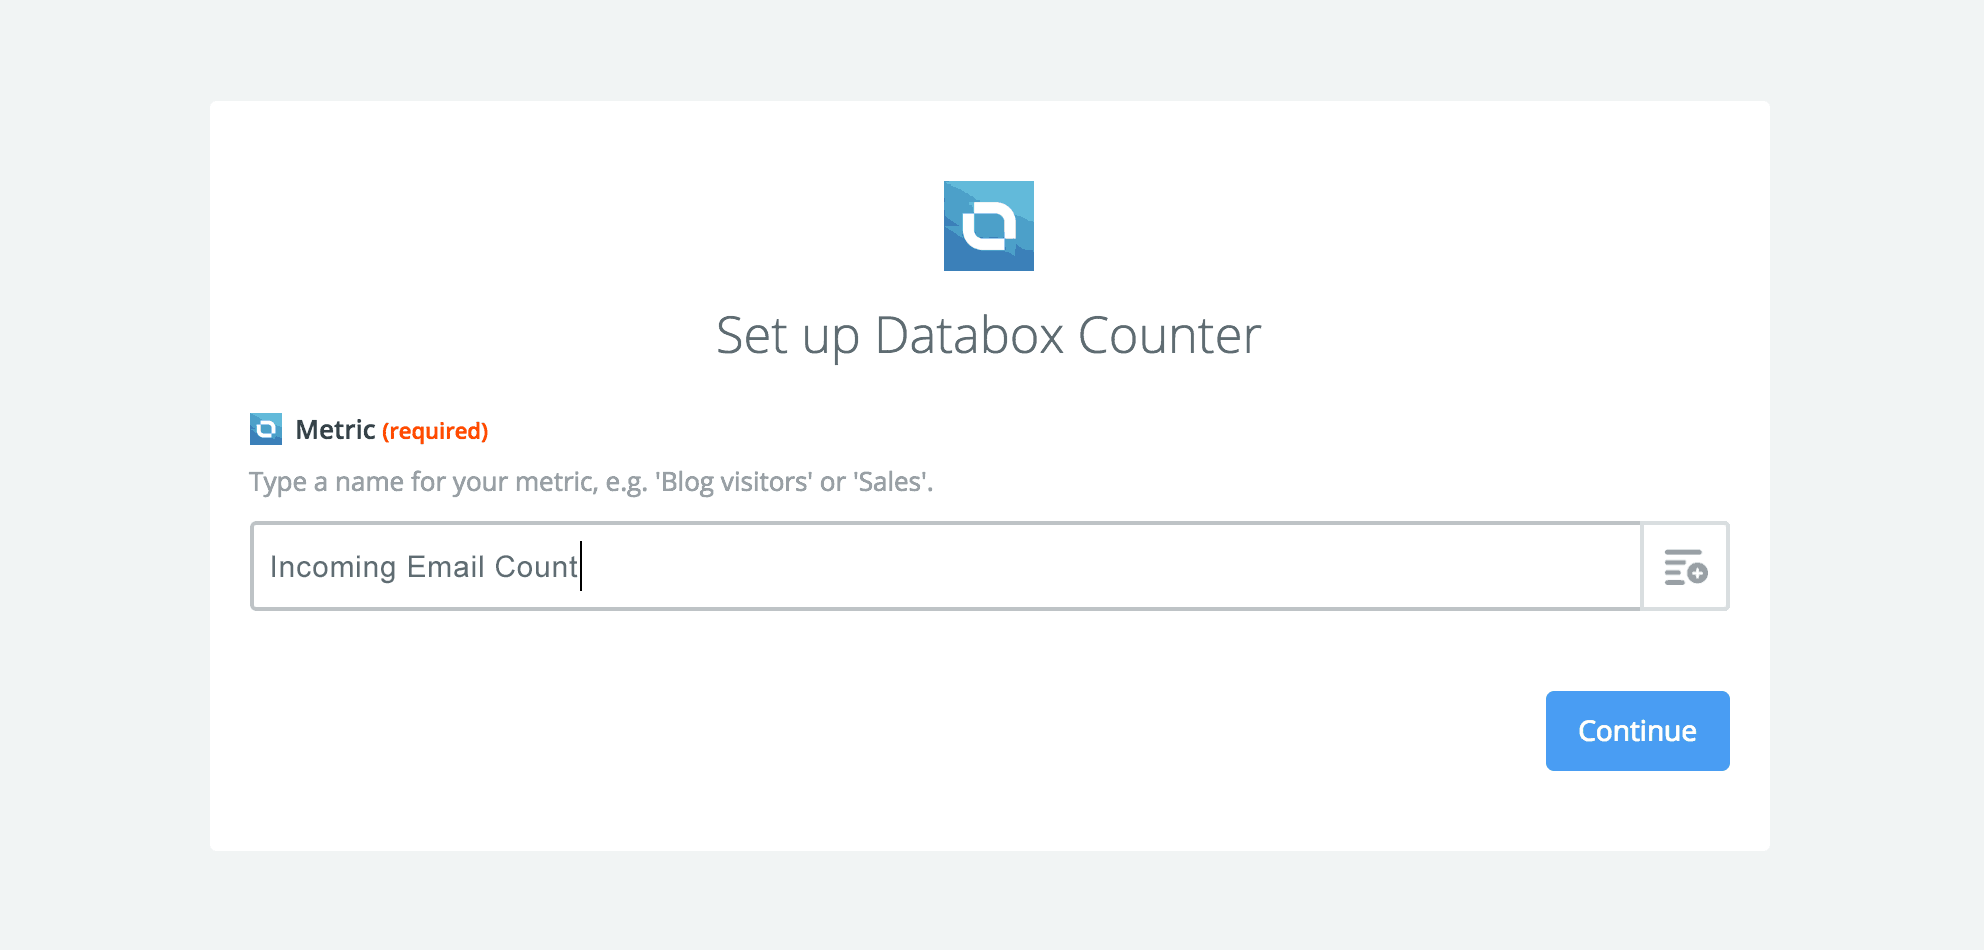
On the last step, you’ll need to choose a name for your metric, e.g. ‘Incoming email count’ and test the action you’ve just set up.
Turn your Zap on and the data will be pushed to Databox!
3. Visualize data pushed from Zapier
Going back to Databox. To display the data that will be pushed from Zapier you’ll need to create a visualization (called ‘Datablock’ – click here to read more about adding and modifying Datablocks).
Here are the steps to do so:
- log in to the Databox web application,
- create a new Mobile datacard or Datawall (or just use an existing one),
- in the left panel select the second tab (‘Datablocks’),
- choose the visualization that will fit best and drag & drop it to the canvas (e.g. Number),
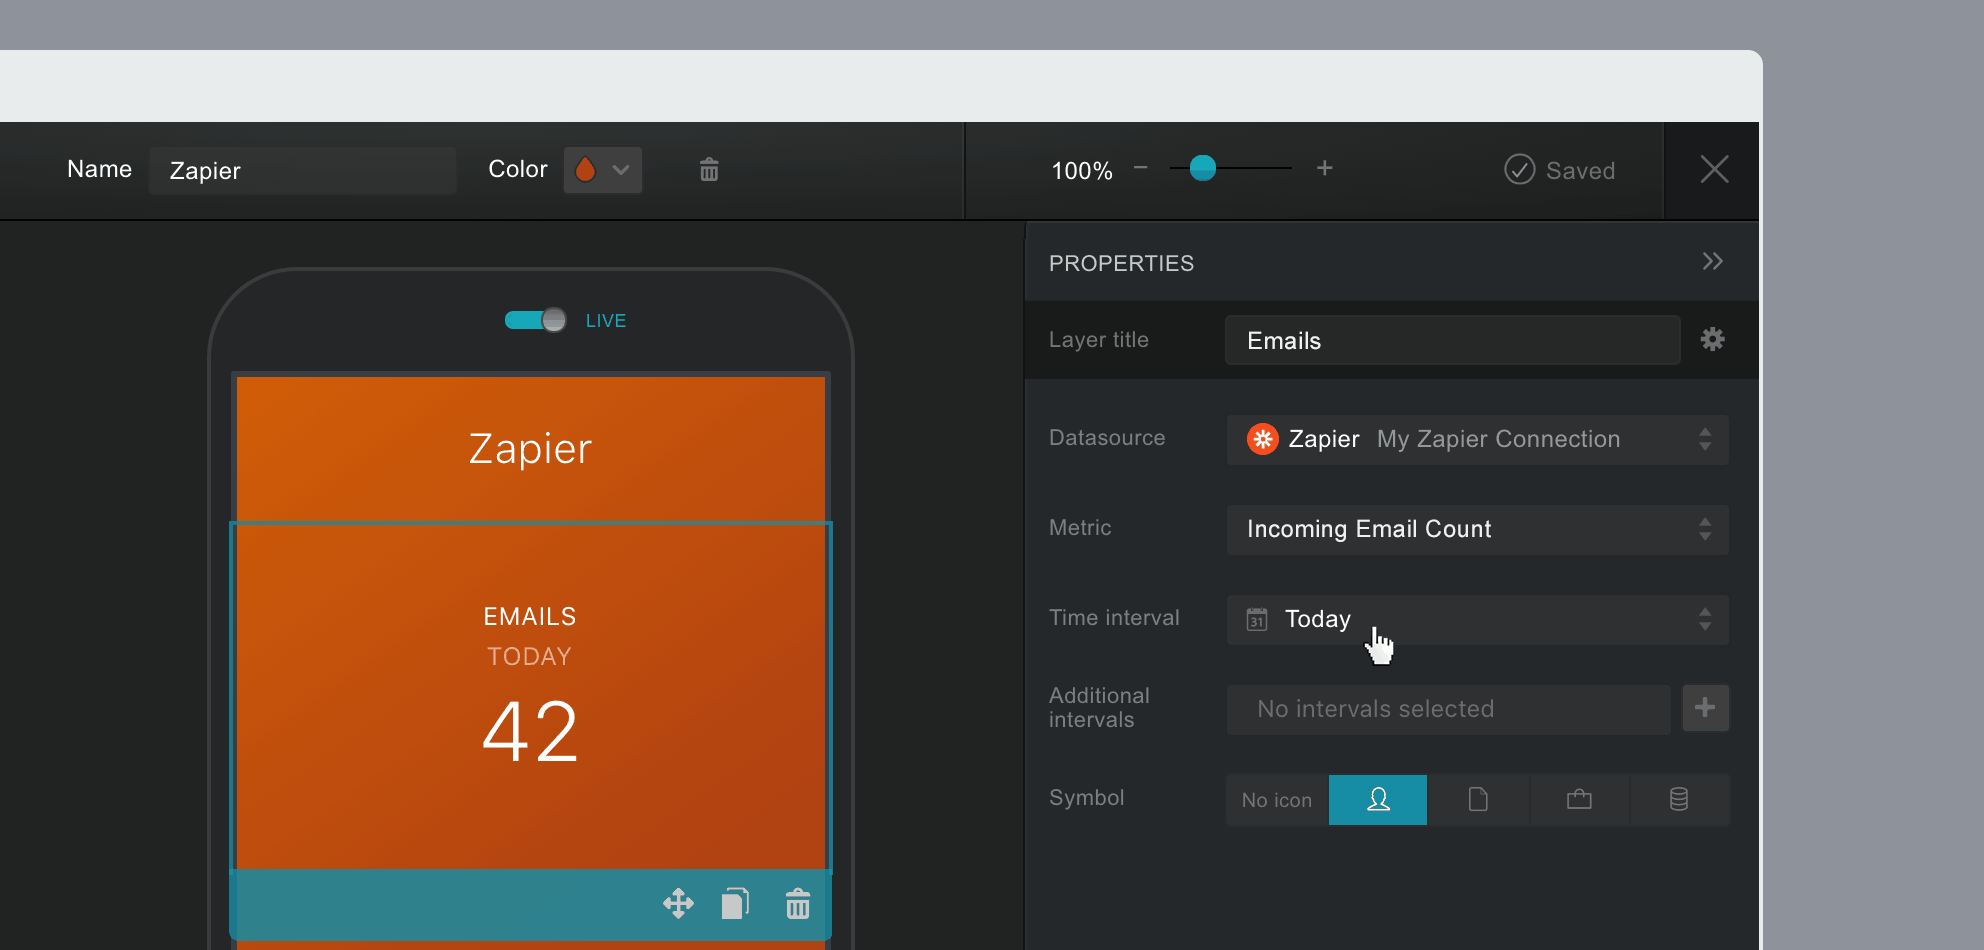
- in the right panel select the Data source (Name of the created push token) where Zapier data is being pushed to (e.g. ‘My Zapier Connection’),
- choose the Metric you would like to display (e.g. ‘Incoming Email Count’),
- choose the Time interval for which you would like to display the data. But remember: if you just created your Zap, time intervals ‘Last 7 days’, ‘Last 14 days’, etc. don’t include data for today. To test drive your Zap with just pushed data try the interval ‘Today’. After few days historical data will be gathered and your Weekly and Monthly charts will look awesome.
And that’s it! To play more with the data gathered from Zapier, just check out the Advanced settings popup where you’ll have all the options you need (changing the granulation, aggregation, format, scaling, etc.). Click here to read more about that.


