


Table of contents
Hello everyone. Welcome to another episode of Data Snacks. My name is Monja, and I’m the product marketer at Databox.
Today we will help you get to know your customers’ purchase habits by tracking and visualizing Google Analytics data. There is a difference between one customer buying 15 products and 15 customers buying one product. The Unique Purchase metric helps you discover that difference.

So, in this Data Snack, we are going to show you::
- Which metrics you should track in order to identify your customers’ purchase habits
- How to determine the popularity of your products
- How to use this data to adjust your strategy to increase sales
Below, you can view the full episode, or, keep reading for a fully transcribed version of the episode complete with relevant screenshots.
Let’s start.
Time to Get to Know our Customers
We are starting in Databox, and using Google Analytics as our main data source.
First, we will navigate to the Databox Designer. Adding metrics is easy to do. Simply choose the data source from the Metrics Library here on the left and drag-and-drop some of the available pre-built metrics.
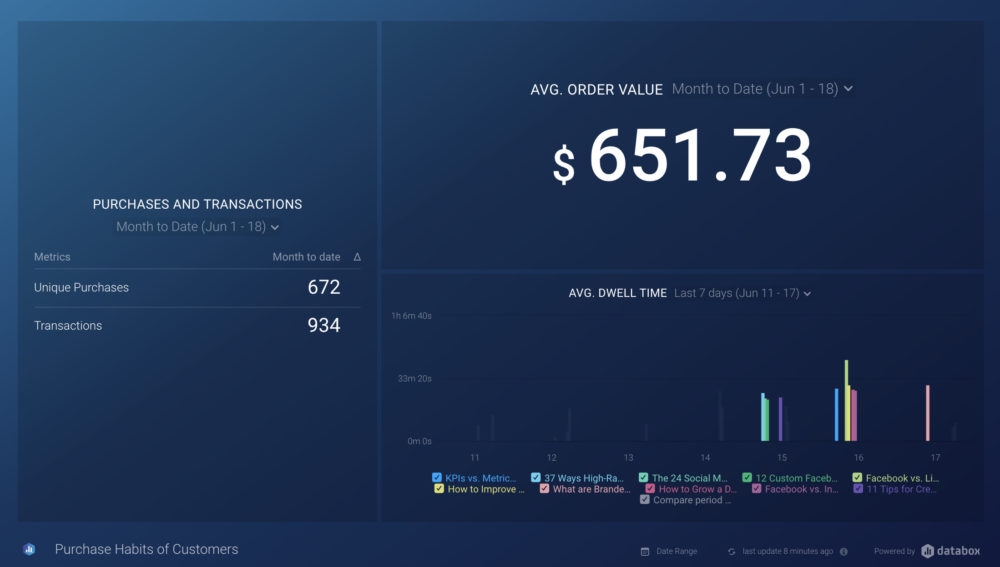
In this case, we will visualize – Unique Purchases, Transactions, Average Dwell Time, and Average Order Value. By tracking these four metrics, we can find out how products are being sold, individually or in bulk, and compare that to the number of transactions, how much time they spend on our product pages, as well as the average values of your transactions. This provides us with insights into our customers’ purchase habits and helps us improve our offer and service.
So let’s choose the visualizations for our metrics. For Unique Purchases and Transactions, we are going with a table so that we can compare the numbers more easily later on. For Average Dwell Time, a custom metric that you can build in Databox, we’ll choose a bar chart, and for Average Order Value, we will go with a number visualization.
Now that we have our dashboard layout let’s see some of the results. First, let’s focus on Unique Purchases, keeping in mind that what makes this metric different from Transactions is that this metric counts the types of items included in each checkout as separate purchases. So, for example, you can have 3 unique purchases within one transaction. Comparing the two metrics can show us a buying pattern, like “our buyers typically purchase three items per transaction”, thus helping us understand our customers’ buying preferences. You can also calculate the average number of unique purchases per transaction or have our team create a Custom Metric for you, offering that exact calculation.
PRO TIP: How Are Users Engaging on My Site? Which Content Drives the Most Online Activity?
If you want to discover how visitors engage with your website, and which content drives the most engagement and conversions, there are several on-page events and metrics you can track from Google Analytics 4 that will get you started:
- Sessions by channel. Which channels are driving the most traffic to your website?
- Average session duration. How long do visitors spend on your website on average?
- Pageviews and pageviews by page. Which pages on your website are viewed the most?
- Total number of users. How many users engaged with your website?
- Engagement rate. Which percentage of your website visitors have interacted with a piece of content and spent a significant amount of time on the site?
- Sessions conversion rate. How many of your website visitors have completed the desired or expected action(s) and what percentage of them completed the goals you’ve set in Google Analytics 4?
And more…
Now you can benefit from the experience of our Google Analytics 4 experts, who have put together a plug-and-play Databox template showing the most important KPIs for monitoring visitor engagement on your website. It’s simple to implement and start using as a standalone dashboard or in marketing reports!

You can easily set it up in just a few clicks – no coding required.
To set up the dashboard, follow these 3 simple steps:
Step 1: Get the template
Step 2: Connect your Google Analytics account with Databox.
Step 3: Watch your dashboard populate in seconds.
So What Can We See Based on The Data
The data we see helps us get a better idea of what our customers buy and how we can improve their experience. For example, if your customers buy product A in bulk rather than make a single unique purchase, rewarding them with a volume discount might stimulate even more purchases in the future.
When it comes to Average Value, keep in mind that this metric does not show the number of products sold, only the price of the products sold. What makes it important is that Average Value can help you determine the price of products most sold on your site. That can help you adjust your offer if desired. It is important to compare this metric with Transactions metrics since, if you have a high Average Value, you can still see a decrease in overall revenue if the number of transactions is low. A possible takeaway might be that you stand to earn more with a medium-range Average Value combined with a high Transaction number.
How does Dwell Time fit into this relationship? Well, the longer a customer stays on your product page, the more likely they are to buy something. According to Semrush, you should be aiming for two to four minutes to secure a purchase decision. If your Dwell Time is substantially less than that, you might want to take steps to improve your page and product presentation.
You Are Now Ready to Tailor Your Strategy to Increase Your ROI
Smart marketers try to figure out their customers’ buying habits and monetize their findings. By tracking the right metrics and drilling deep into the numbers, you can gain insights that can significantly improve your sales.
Understanding sales patterns, which visitors are most likely to buy, in which amount, and at what price, can help tailor your strategy and increase your ROI significantly.
If you need help tracking and visualizing your Customers purchase habits, our Support team can actually help build your first dashboard for free.
Just create your free Databox account and reach out to our team either via chat or email.
See you next time.


![How to Leverage Your Website Analytics to Acquire New Customers? [Research Findings Based on 100+ Companies]](https://cdnwebsite.databox.com/wp-content/uploads/2022/10/10044001/google-analytics-4-metrics-and-dimensions-guide-1000x563.png)


