


Table of contents
What’s better than having data to compare your performance to and base your future marketing decisions on?
Having consolidated data from different sources—in one place.
If you’re looking for marketing benchmark data to give the final touch to your strategy for 2025, you’re in the right place. Although research is something marketers do daily, we decided to help you skip that step: you’ve just landed on a comprehensive collection of the best marketing benchmark reports you should read to know exactly where you stand compared to your competition and make informed decisions this year.
Let’s dive in: you can jump right to the category you’re most interested in.
- SEO Benchmark Reports
- Content Marketing Benchmark Reports
- Paid Ads Benchmark Reports
- Email Marketing Benchmark Reports
- Conversion Benchmark Reports
- Social Media Benchmark Reports
- Paid Social Benchmark Reports
- Web Analytics Benchmark Reports
- Video Marketing Benchmark Reports
- Marketing Automation Benchmark Reports
- Lead Generation Benchmark Reports

1. SEO Benchmark Reports
With multiple Google updates in 2024, SEO specialists didn’t have it easy. However, SEO can generally ensure a pretty good ROI if done right (data varies from 275% to 1,220%), so it’s worth its place in your marketing strategy for 2025. If you’re looking for some fresh data to compare your past performance to and get ready to chase the first position in SERPs, here are the 2 benchmark reports you should check out.
State of SEO by Search Engine Journal
SEJ is an authority in the world of SEO and you’ll surely find useful benchmarks in their latest report. It’s quite comprehensive, covering SEO market insights, salaries in the sector, campaign goals, metrics, challenges, and predictions for 2025. Note that the article only contains a few insights, while the full report is gated, so you’ll have to enter your personal information to download it.

SEO Benchmarks by Industry by FirstPageSage
If you’re tracking average session duration, bounce rate, conversion rate and other SEO-related metrics, you will find FirstPageSage’s report useful. It contains fresh data from the past two years divided by industry so you can compare your numbers to your peers and competitors.

PRO TIP: You may want to take a look at the examples of Google Analytics benchmarking reports.
2. Content Marketing Benchmark Reports
Long-form content or shorter articles? How often should you even publish on your blog? What metrics should your track to calculate your content marketing ROI? We’ve collected the best reports from the past two years to help you benchmark your content performance. Here are our top three.
- The State of Content Marketing by Semrush
- The 2025 Content Benchmarks Report by SproutSocial
- The 2025 B2B Content Marketing Report: Benchmarks, Budgets, and Trends by MarketingProfs
The State of Content Marketing by Semrush
Semrush is well-known for its comprehensive reports on the state of content marketing. This one features insights based on thorough research and data collected from 1.5k marketers. Learn if other companies have a documented content marketing strategy, whether they consider it successful, and what key metrics they use to measure their content performance.

The 2025 Content Benchmarks Report by SproutSocial
With algorithm changes and new platforms emerging every day, it’s challenging to maintain good performance throughout the year. SproutSocial’s report helps you benchmark your publishing and engagement metrics and make sure your social media content is building brand awareness among your audience in 2025. The report is gated and will be sent to you via email.

The 2025 B2B Content Marketing Report: Benchmarks, Budgets, and Trends by MarketingProfs
Created in a collaboration with Content Institute, this report provides you with amazing benchmarks from the content marketing sector: from team size and structure to the content formats created and distribution channels used, you’ll learn everything about how marketers approach content. The MarketingProfs’ report data covers the past two years.

3. Paid Ads Benchmark Reports
The total amount of money spent on advertising each year can be measured in billions. But, even if your budget is way lower, you still want to know if you’re on the right track—whether you’re reaching your target audience with your ads and successfully converting them. We’re sharing the top three reports from the past year so you can benchmark your most relevant metrics.
- 2025 Google Ads Benchmarks by Wordstream
- Search Advertising Benchmarks by LocaliQ
- Google Ads Benchmarks by Store Growers
2025 Google Ads Benchmarks by Wordstream
Wordstream published (and recently updated) a report with the most important benchmarks across all industries for Google Ads and Microsoft Ads. Other than data regarding metrics such as average cost per click, cost per lead, or average conversion rates, you’ll find valuable takeaways at the end of the report about how search space is evolving and what’s to be expected.
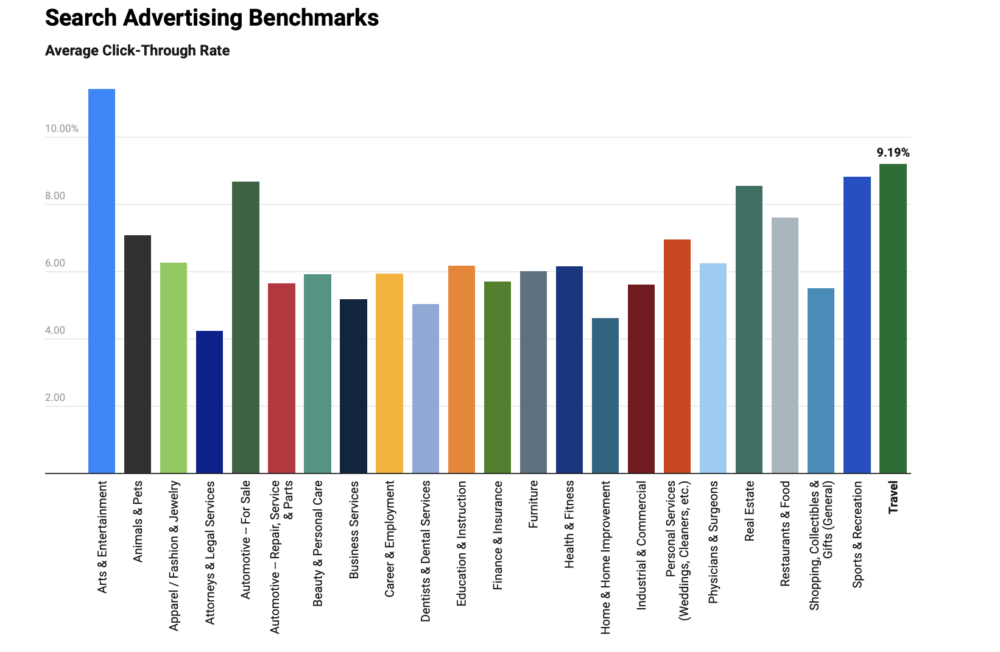
Search Advertising Benchmarks by LocaliQ
Another set of benchmarks you can use to measure how you stack up to your peers or competitors has been published by LocaliQ. In this benchmark report, you’ll also find useful numbers so you know what to expect from your next advertising campaign in terms of costs and conversions, along with some expert tips on how to improve.

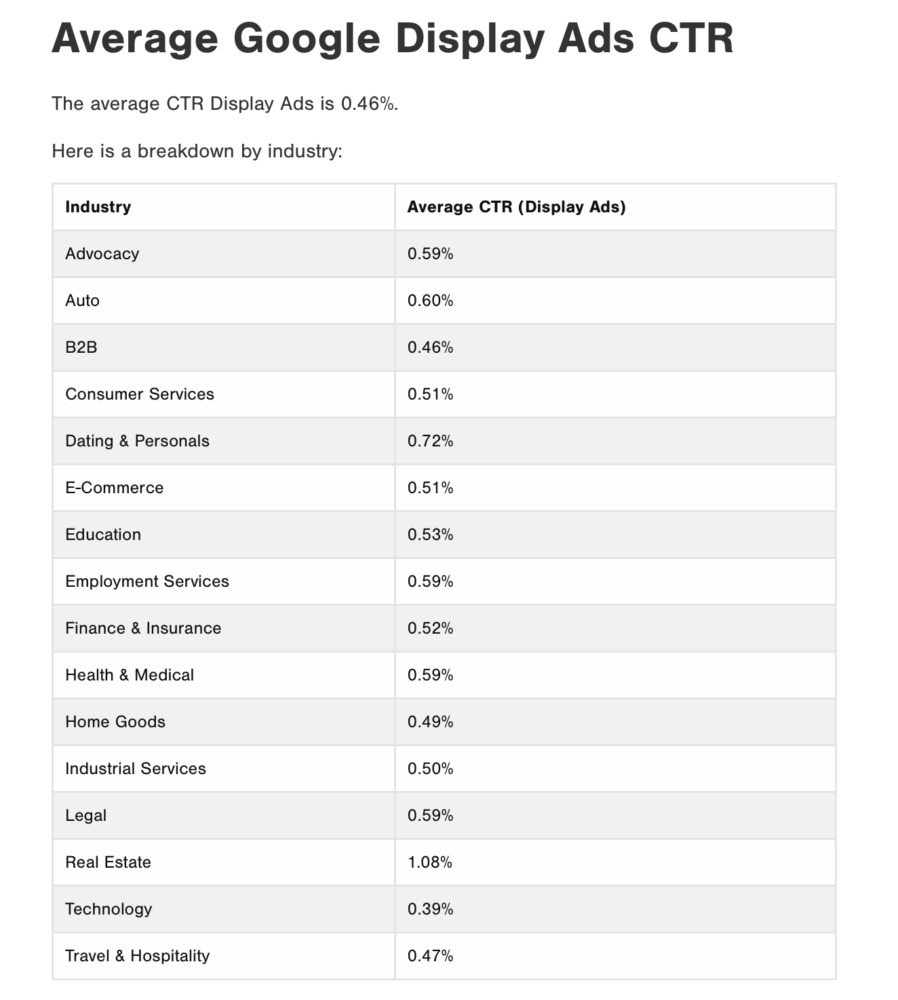
Google Ads Benchmarks by Store Growers
If you want to know whether your industry is among the ones with the highest CPC for Google ads, what CPA you should expect, or average values for different types of ads, check out this comprehensive report by Store Growers. There are 27 useful benchmarks to help you determine whether your performance should be better in 2025.
4. Email Marketing Benchmark Reports
Do you use emails to generate leads for your business or raise brand awareness? To track and evaluate your success, you need to know whether your open rate and CTR are considered good. These numbers vary largely by industry, so here are the best email marketing benchmark reports for you to compare your results.
- 2025 Email Marketing Benchmarks by Campaign Monitor
- Email Marketing Benchmarks by Get Response
- Email Marketing Benchmarks by MailChimp
2025 Email Marketing Benchmarks by Campaign Monitor
Campaign Monitor’s report with the 2025 email marketing benchmarks will reveal some important insights you can apply to improve your email performance. For example, you’ll learn what the worst days to send emails are, what regions have the best open rate, and how open rates vary by industry. The report is enhanced with a list of actionable tips to boost your email marketing efforts.

2025 Email Marketing Benchmarks by GetResponse
GetResponse conducted huge research that included around 7 billion messages sent by their clients and came up with various useful data and statistics to help you benchmark your email marketing performance. In this report, you’ll learn which months have the highest open rate, the best time for sending emails, optimal newsletter frequency, and more.

2025 Email Marketing Statistics and Benchmarks by Industry by MailChimp
If you’re looking to compare your average unique opens, clicks, bounce, and unsubscribe rates, this MailChimp’s report will come in handy. The company tracked a variety of their customers’ campaigns that went out to at least 1,000 subscribers, and came up with numerous valuable insights about email marketing.

- Klaviyo benchmarks for eCommerce and Marketplaces
- Mailchimp Benchmarks for All Companies
- B2B HubSpot Email Marketing Benchmarks
- B2C HubSpot Email Marketing Benchmarks
5. Conversion Benchmark Reports
How many conversions is “good enough”? This is a burning question for marketers, regardless of what channel they’re focused on: email or content marketing, paid ads or social media. To enhance the results of your campaigns, you first must know where you’re standing right now. These reports offer the insights you need.
- The Conversion Benchmark Report by Unbounce
- The Q2 2025 Ecommerce Quarterly Benchmarks Report by Kibo
The Conversion Benchmark Report by Unbounce
Unbounce created this report with the help of AI: after analyzing over 33 million conversions and 44,000 landing pages, they’ve come up with reliable benchmarks for average and median values for conversion rates across industries. To get access to the full report, you’ll need to enter your personal information, as it’s gated.

The Q2 2025 Ecommerce Quarterly Benchmarks report by Kibo
If you’re in the e-commerce industry, this Kibo benchmark report is for you. It summarizes conversion rates data from Q2 of 2025, divided by region, channel, and more, so you can get a pretty granular view of what you should expect your performance to look like. To get your hands on the full report, you’ll need to enter your personal data on the website.

6. Social Media Benchmark Reports
New social media platforms emerging every day make it difficult to stay on top of the latest trends. What should you be doing with your Instagram, TikTok, or LinkedIn company pages? We chose three reports with the most useful benchmark data to help you evaluate your performance and tweak your strategy for 2025.
- Social Media Benchmarks by Industry in 2025 by SproutSocial
- The Trends That Defined Social Media in Q3 2025 by Emplifi
- The State of Influencer Marketing 2025: Benchmark Report by Influencer Marketing Hub
Social Media Benchmarks by Industry in 2025 by SproutSocial
SocialSprout’s report answers many questions social media managers ask on a daily basis: What should be my engagement rate? How often should I publish on each platform? Should I post more frequently based on my industry? It’s difficult to answer these questions unless you have benchmark data relevant for your sector, since best practices depend largely on whether you’re running social media for a beauty brand or a fintech startup.

The Trends That Defined Social Media in Q3 2025 by Emplifi
Social interactions per post, fan growth, CTR, response rate, and more—that’s what’s waiting for you in Emplifi’s comprehensive report on the state of social media in Q3 of 2025. Did you know that CTR has seen a downward trend across all social media and industries? Read this report to learn more interesting insights.

The State of Influencer Marketing 2025: Benchmark Report
Influencer marketing on social media is on the rise for many industries, especially beauty and fitness. If you’ve started investing in influencer marketing or are thinking about doing it, this IMH’s report will help you benchmark your expectations. Learn how likely people are to trust influencers, how much brands spend on influencer marketing, and more.

- Social Media Benchmarks for B2B companies
- LinkedIn Company Page Benchmarks for All Companies
- Facebook Page Benchmarks for All Businesses
- Instagram Business Page Benchmarks for All Companies
- Twitter Benchmark Group for All Business Types
7. Paid Social Benchmark Reports
Many social media platforms have an excellent organic reach, and when you combine it with paid ads, social media turns into a powerful tool for raising brand awareness, building a community, and driving conversions. These three reports will provide you with data to benchmark your performance.
- The 2025 State of Facebook Ads Performance
- Social Advertising Benchmarks for 2025 by Brafton
- Linkedin Ad Benchmarks 2025 by B2B House
- 2025 B2B Paid Social Benchmarks by Metadata
The 2025 State of Facebook Ads Performance
Facebook advertising has changed a lot for marketers and advertisers in the past two years (targeting and iOS updates being the most impactful). But despite the changes, according to our research, more than 60% of companies increased ad budgets on Facebook and more than 50% of companies expect their Facebook ad budgets to increase again despite the fact that >40% of SMBs and >50% of agencies say performance from Facebook advertising either stayed the same or performed worse last year.
To bring Facebook advertising effectiveness into focus, Databox sought to explore the opportunities and the challenges agencies and SMBs are facing in the State of Facebook Ads Performance report – from setting and managing budget and choosing the right ad objective, to selecting the right ad format, setting proper targeting, analyzing and reporting on results, and much more.

Social Advertising Benchmarks for 2025 by Brafton
Whether you’re running social media ads for your own company or for your clients, you should be aware of how you stack up against competitors and industry averages. This data helps you manage your budget and optimize performance, so this report by Brafton will come in handy if you want to know average CTR, CPC, conversion rates, and more per platform and industry.

Linkedin Ad Benchmarks 2025 by B2B House
LinkedIn is a particularly useful platform for B2B companies, as it allows you to reach an incredible number of users quickly. If you’re investing in ads on this social media app, B2B House’s benchmark report will inform you of the most relevant stats to know when evaluating your past performance and optimizing your next campaigns.

2025 B2B Paid Social Benchmarks by Metadata
If your goal is to run more effective paid social campaigns this year, Metadata’s report will certainly help you set yourself up for success. Other than the average values for different relevant metrics for paid social, you’ll also learn which CTA buttons were the most successful on different social media platforms and other useful insights. If you’d like to know more about the state of Facebook advertising in 2025, check out our detailed report on Facebook ads performance.

8. Web Analytics Benchmark Reports
Driving traffic to your website is just the tip of the iceberg. To ensure a good ROI for your marketing efforts, the traffic your website attracts should also convert. Tracking user behavior is critical to identify potential bottlenecks in your funnel and seize opportunities, which is why marketers track a variety of web metrics to evaluate their performance. These are the benchmarks you should know about for the evaluation to be effective.
The 2024 Web Traffic & Analytics Report by HubSpot
HubSpot surveyed over 400 marketing professionals to compile a comprehensive report to help you monitor and optimize web analytics in 2024. You’ll get the latest data on bounce rates, mobile optimization, keyword rankings, and tools for site performance tracking. However, note that the data isn’t divided by industries, but presented as a whole, so use it to get a general understanding of web traffic and analytics in 2024.

2025 Digital Experience Benchmark Report
The website metrics you track tell you a story about what user experience looks like on your pages. A high bounce rate could signal that you should optimize your content or CTAs, but what exactly is considered a high bounce rate? You’ll need to enter your personal information to get Contentsquare’s report, but based on the key findings presented on the website, it’s surely worth it.

9. Video Marketing Benchmark Reports
Even before TikTok became one of the most popular platforms, video marketing saw an expansion. Several years ago, marketers worldwide claimed their budgets for video marketing would increase, but if you know what the state of video marketing is today, what metrics you should track, and what numbers you should expect, we suggest these benchmark reports.
Video Marketing Report by HubSpot
Do your video campaigns generate a high ROI? According to HubSpot, videos offer a higher ROI than textual posts and images, but to determine if your videos pay off, you need to know what metrics to track and what numbers you should expect to see in the dashboard. This report by HubSpot offers various useful insights from 500+ video marketers and can inform your future video marketing strategy.

Video Benchmarks for Business by Vidyard
Based on data collected from over 1.3 million videos, Vidyard’s report on video marketing benchmarks provides amazing facts and stats to help you boost your strategy for this year. From video creation trends to optimal video length and engagement rate, you’ll learn all you need to know to analyze your past performance and finetune future campaigns successfully.

10. Marketing Automation Benchmark Reports
Today, we can’t imagine executing a well-planned marketing strategy without relying on automation. Automation tools have helped marketers streamline and speed up their processes and reduce the possibility of error. Compare your use of marketing automation with benchmark data from these reports.
- The Ultimate Marketing Automation Statistics Overview by EmailMonday
- 75+ Latest Marketing Automation Statistics – 2025 Benchmarks by Startup Bonsai
The Ultimate Marketing Automation Statistics Overview by EmailMonday
EmailMonday’s detailed report on marketing automation delivers useful insights on a variety of subtopics, so you’ll learn what percentage of companies have already adopted different marketing automation tools and what they consider as the biggest benefit. If you’re in the process of choosing or adopting MarTech in your company, this report can serve as a great set of guidelines, so you know what to expect.

75+ Latest Marketing Automation Statistics – 2025 Benchmarks by Startup Bonsai
Over the past few years, businesses worldwide have been adopting automation technology faster than ever, including marketing automation tools. Startup Bonsai’s report offers insight into how marketers approach the implementation of marketing automation tools, whether they consider MarTech difficult to understand fully, and more, so you can see how you stack up against your competitors and peers in keeping up with MarTech trends.

Benchmark Your Performance Against Hundreds of Companies Just Like Yours
Viewing benchmark data can be enlightening, but seeing where your company’s efforts rank against those benchmarks can be game-changing.
Browse Databox’s open Benchmark Groups and join ones relevant to your business to get free and instant performance benchmarks.
11. Lead Generation Benchmark Reports
One of the essential tasks of marketing campaigns is to generate leads that sales teams can later on turn into paying customers. However, not all channels can generate the same amount of leads. Not all businesses in all industries can expect the same number of leads per month. How do you know if you’re doing well? We suggest checking out this report.
B2B Lead Generation Statistics, Facts, Trends, Benchmarks, And Market Size For 2025 by Passive Secrets
If you’re a B2B company, you’ll certainly find interesting data to compare with in this report by Passive Secrets. This report contains over 50 useful stats and numbers, covering many aspects of lead generation: how much more revenue you can generate if you invest time in building a solid lead generation process, how many qualified leads per month large companies generate, how long it takes for a B2B lead to convert, and more.

New Marketing Trends and Technologies Benchmark Reports
In the rapidly developing world of marketing, being at the forefront requires keeping track of emerging trends and new technologies. Integrated systems such as AI and Machine Learning as well as Augmented Reality (AR) and Virtual Reality (VR) often serve as immersive marketing innovations. Understanding how these factors affect marketing performance is critical. These are the most relevant benchmark reports which will assist you in these technologies in 2025.
AI-Driven Marketing Benchmark Reports
The State of AI in Marketing by Martech Today
Martech Today establishes how Artificial Intelligence (AI) is changing the landscape Of Marketing strategies. The report’s comprehensive objectives include adoption rates or which AI tool worked most effectively alongside ROI or the most key earnings, along with other future measures, all of which provide valuable benchmarks towards AI plans.
AI Marketing Benchmark Report by Gartner
Gartner’s benchmark report also gives details regarding AI utilization in marketing, which includes customer personalization, predictive analysis, automation, and much more. How AI is utilized by top companies to drive customer experience and revenue growth is discussed in detail.
Augmented and Virtual Reality Benchmark Reports
AR & VR in Marketing by DigiCert
DigiCert analyzed the application of AR and VR for marketing integration in their campaign. The report gives benchmarks such as engagement rates, conversion rates, and overall user experience with immersive marketing campaigns.
Immersive Marketing Benchmark Report by AR Insider
The benchmark report published by AR Insider gives insights into the trends revolving immersive marketing. It features information on industry-wide adoption rates, investments made, as well as the brand’s customer engagement levels.
Voice Search and Conversational Marketing Benchmark Reports
Voice Search Optimization Report by VoiceTech
VoiceTech’s latest report benchmarks the effectiveness of voice search optimization strategies. It covers metrics such as voice search adoption rates, conversion rates from voice queries, and best practices for optimizing content for voice assistants.
Conversational Marketing Benchmark Report by Drift
Drift provides reports that outline the benchmarks in utilizing chatbots and conversational AI in marketing. The report includes user engagement data, effectiveness in lead generation, and overall customer satisfaction and sales metrics.
Sustainability and Ethical Marketing Benchmark Reports
Sustainable Marketing Trends by Nielsen
As evident from Nielsen’s report, it is becoming increasingly vital to integrate sustainability into all marketing efforts and strategies. The report provides benchmarks regarding consumer’s attitude, appropriate sustainability marketing, and ROI of green friendly campaigns.
Ethical Marketing Benchmark Report by Edelman
Edelman’s benchmark report studies the use of ethics as a pillar in marketing practices. In addition, it covers consumer’s trust levels, the influence of ethical practices on brand loyalty, and basic indicators of how successful a marketing strategy is is using ethical practices.
PRO TIP:
To maintain industry innovation leadership, become a member of the Emerging Technologies Benchmark Group which provides the latest benchmarks on AI, AR/VR, voice search, etc. This will also enable you to compare your adoption and performance against other companies.


