Table of contents
Are you dealing with a cold feet pandemic in your online store? Too many customers initiating the checkout process only to drop out at the last second?
While this is a big issue that online stores have nowadays, the bigger question should be whether your checkout abandonment rate exceeds the industry standard.
After all, there’s no such thing as a 0% checkout abandonment rate and if all of your competitors are dealing with a similar percentage, it might be better to prioritize more pressing concerns.
On the other hand, if you’re dealing with exceptionally high abandonment rates like 80-90%, there’s usually some underlying issue with your checkout process (e.g. too many steps or hidden fees).
To help you get a clear understanding of what a good checkout abandonment rate is, we talked to 50+ industry experts and even got them to share some amazing tips on how you can improve it.
Our respondents are:
- B2C Services or Products – 36.36%
- Agency / Consultant: Marketing, Digital or Media – 29.09%
- eCommerce – 23.64%
- B2B Services or Products – 10.91%
Let’s dive in.
- What is Checkout Abandonment Rate?
- How to Calculate Checkout Abandonment Rate
- What is a Good Abandoned Checkout Rate?
- Causes of High Checkout Abandonment Rates
- How to Improve Checkout Abandonment Rate? 7 Expert Tips
- Benchmark Your Checkout Abandonment Rate Against Hundreds of Companies Like Yours
What is Checkout Abandonment Rate?
A checkout abandonment rate is the percentage of prospects that abandoned the checkout process after initiating it and sharing payment details.
In other words, they added some of your products to their cart, provided personal and credit card information, and then abandoned the purchase in the final stage.
If you have a high abandonment rate, it could mean that your checkout process is too complicated, has too many steps, or requires an abundance of customer information.
Overall, the customers aren’t enjoying the checkout for some reason and you need to find a way to optimize it.
Also, don’t mistake the checkout abandonment rate for a cart abandonment rate. While they sound similar, these two metrics represent abandonments in different stages in the buyer journey.
Cart abandonment can come at any stage before the checkout process, while checkout abandonment is when the prospect already provided their information and dropped out at the last step.
Related: High Shopping Cart Abandonment Rate: Causes and Potential Solutions
How to Calculate Checkout Abandonment Rate
We can calculate the checkout abandonment rate by dividing the number of completed transactions (i.e. the conversion rate) by the total number of initiated checkouts, subtracting it from 1, and then multiplying the value by 100.
Or, if you’re not exactly a math buff, by following this formula:
Checkout abandonment rate = 1 – (number of completed orders / number of initiated checkouts) x 100
Once you know the percentage of customers that are leaving your checkout process, you can use the data to squeeze some additional insights (like what’s the potential lost revenue due to abandonment).
What is a Good Abandoned Checkout Rate?
Before we start showcasing any precise numbers, it’s important to keep in mind that abandonment checkout rates can significantly vary depending on your industry.
Each industry comes with its own set of strategies and processes, which is why you’ll get the most insights if you benchmark data with companies that operate in the same niche industry as you.
The problem is that it’s extremely difficult to get your hands on some relevant benchmarks regarding checkout abandonment rates as most companies don’t tend to disclose this information.
That’s why we decided to build a product that can give you just that.
But first, let’s check out what we learned in our survey.
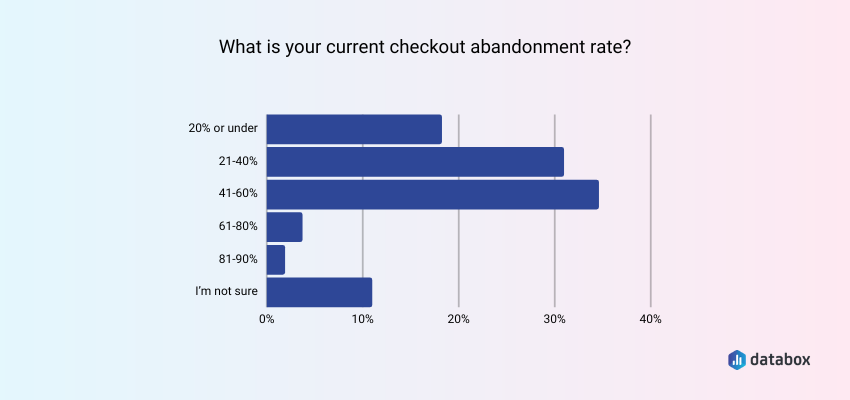
Most companies in our survey have checkout abandonment rates between 21% and 60%.
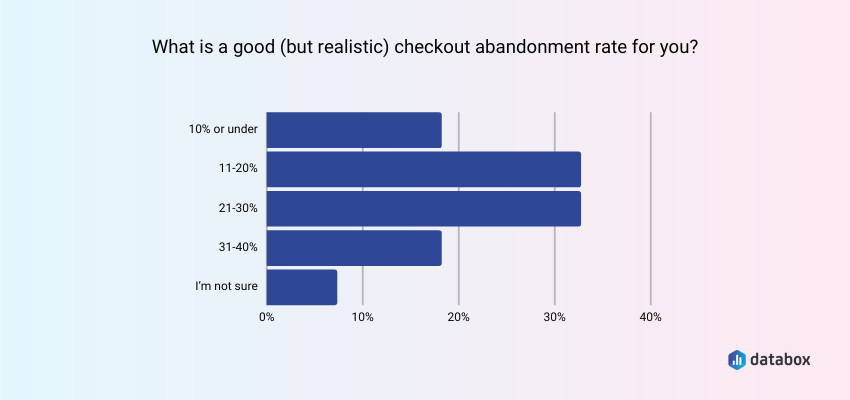
When it comes to what companies consider good but realistic checkout abandonment rates, most of our respondents think that it should be between 11% and 30%.
We decided to compare our survey data with data from our Benchmark Groups, and created a cohort specifically for Shopify users.
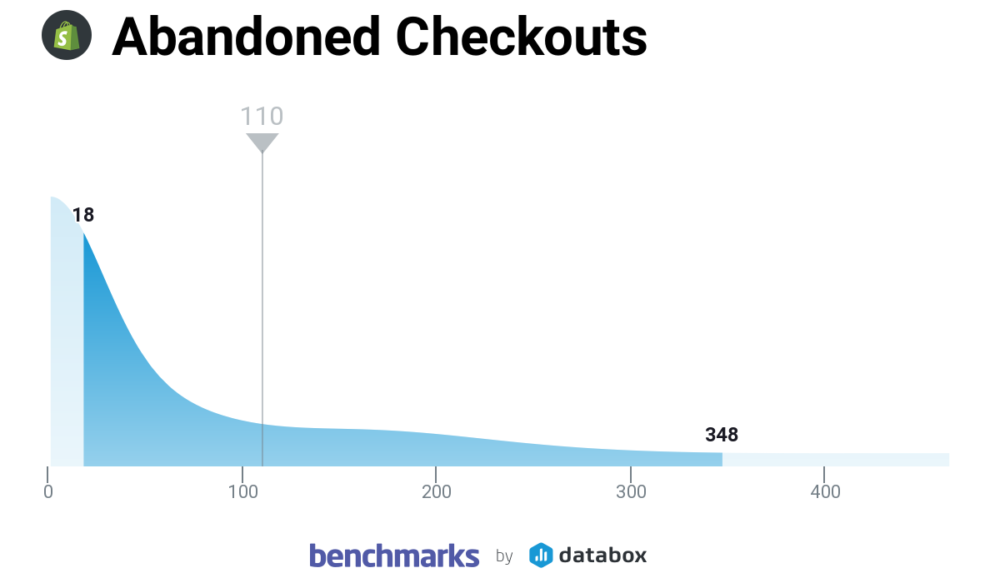
According to data provided by Shopify Benchmark Group for All Companies, companies on average had 110 Abandoned Checkouts (occurs when a customer adds an item to their cart and doesn’t follow through with a purchase) in the previous month (average value sourced from 154 companies).
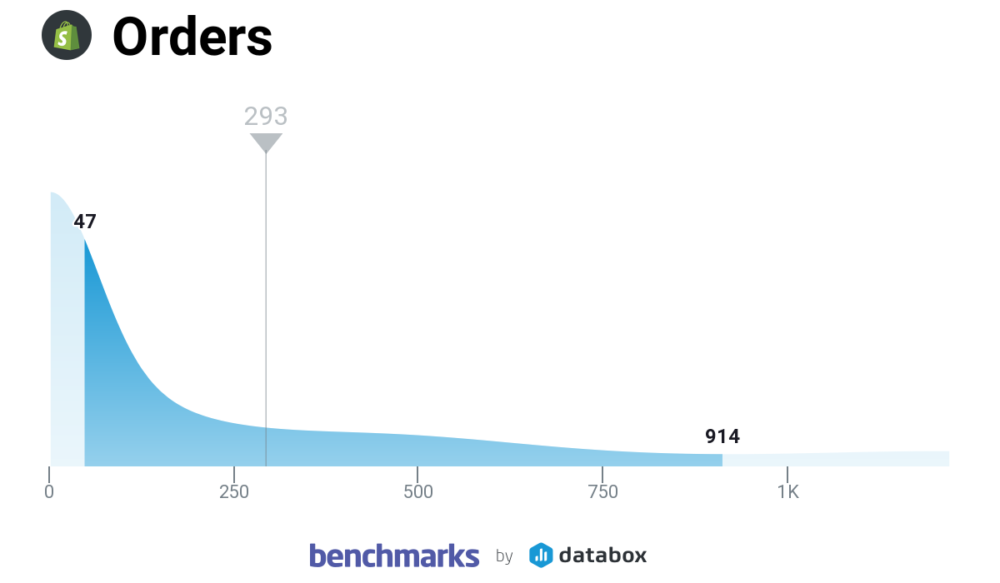
The average number of orders in the previous month was 293 (average value sourced from 353 companies), according to data provided by Benchmark Groups.
Both stats were pulled from the same Shopify Benchmark Group and you can join it and compare your performance for free. We have 100+ available benchmark groups and you can join as many as you want, as long as you meet the group criteria and are willing to connect your data.
Both your and your competitor’s data are anonymized. If you don’t see any group for your specific industry, contact our support and we’ll create one just for you.
Instantly and Anonymously Benchmark Your Company’s Performance Against Others Just Like You
If you ever asked yourself:
- How does our marketing stack up against our competitors?
- Are our salespeople as productive as reps from similar companies?
- Are our profit margins as high as our peers?
Databox Benchmark Groups can finally help you answer these questions and discover how your company measures up against similar companies based on your KPIs.
When you join Benchmark Groups, you will:
- Get instant, up-to-date data on how your company stacks up against similar companies based on the metrics most important to you. Explore benchmarks for dozens of metrics, built on anonymized data from thousands of companies and get a full 360° view of your company’s KPIs across sales, marketing, finance, and more.
- Understand where your business excels and where you may be falling behind so you can shift to what will make the biggest impact. Leverage industry insights to set more effective, competitive business strategies. Explore where exactly you have room for growth within your business based on objective market data.
- Keep your clients happy by using data to back up your expertise. Show your clients where you’re helping them overperform against similar companies. Use the data to show prospects where they really are… and the potential of where they could be.
- Get a valuable asset for improving yearly and quarterly planning. Get valuable insights into areas that need more work. Gain more context for strategic planning.
The best part?
- Benchmark Groups are free to access.
- The data is 100% anonymized. No other company will be able to see your performance, and you won’t be able to see the performance of individual companies either.
When it comes to showing you how your performance compares to others, here is what it might look like for the metric Average Session Duration:

And here is an example of an open group you could join:

And this is just a fraction of what you’ll get. With Databox Benchmarks, you will need only one spot to see how all of your teams stack up — marketing, sales, customer service, product development, finance, and more.
- Choose criteria so that the Benchmark is calculated using only companies like yours
- Narrow the benchmark sample using criteria that describe your company
- Display benchmarks right on your Databox dashboards
Sounds like something you want to try out? Join a Databox Benchmark Group today!
Causes of High Checkout Abandonment Rates
As we mentioned, the reasons why customers abandon your checkout process can greatly vary depending on your industry, the service you provide, or even the platform that you use.
Some of the most common culprits are:
- Obligation to create an account or register – A lot of the time, users will start adding items to the cart and initiate a purchase, only to leave when they find out they have to create an account. Sure, you’ll get some valuable data if they do, but the number of customers you can lose due to this step usually isn’t worth it.
- Complex checkout process – Have you really made the checkout process as simple as possible? Even one step less can have a huge impact on your abandonment rate. The smoother experience, the happier the customers.
- Hidden costs and shipping limitations – Be upfront about all the fees because users might decide to abandon the purchase if you decide to add them at the end of the process. Also, lay out the shipping options beforehand. You don’t want the prospects reaching the end of the funnel only to find out that you don’t provide their preferred delivery option.
- Fast and seamless process – This should go without saying, but make sure you optimize the speed of your platform and funnel. It shouldn’t take longer than a few seconds to move on to the next step.
While these are some of the more popular causes of checkout abandonment rates, the list is not exclusive to them. Other problems include a lack of payment methods, a lack of product information, failed discount codes, and more.
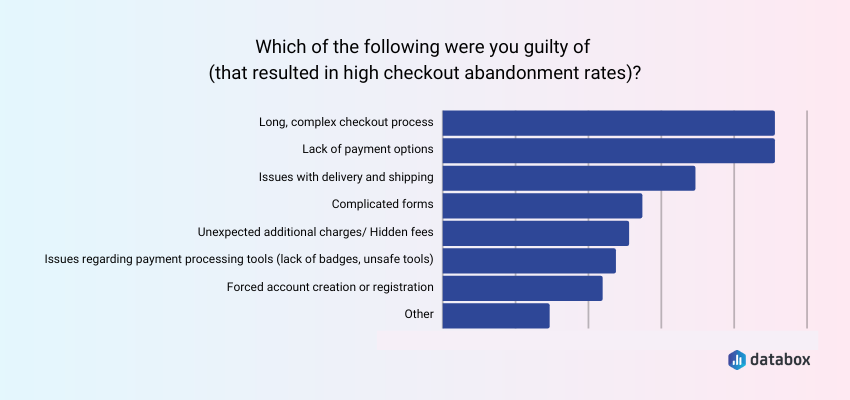
When asked to choose the mistakes they were guilty of (that resulted in high checkout abandonment rates), our surveyed companies chose mostly long, complex checkout process and a lack of payment options.
How to Improve Checkout Abandonment Rate? 7 Expert Tips
So, what can you do to reduce the checkout abandonment rate and get your customers to finish the initiated checkouts?
We asked the experts from our survey to share some of their best tips and strategies. Here’s what we compiled:
- Offer Free Shipping
- Implement a Live Customer Support Chat
- Include Several Payment Options
- Create a One-Step Checkout Process
- Simplify the Checkout Process and Provide a Seamless Experience
- Use Exit-Intent Pop-Ups
- Test Different Pricing Models
PRO TIP: Get Useful, Actionable Data on Your Shopify Store’s Performance
To improve the performance of your online store, it’s vital to have access to useful and actionable data. But, with so many metrics available to track, it may be hard to determine which ones will actually help you move the needle. That’s why we have created a concise Shopify dashboard template that only tracks the most important metrics for analyzing the core elements of your ecommerce store, such as:
- Orders. See the total number of orders that were placed during a specified date range.
- Sales overview. How profitable is your Shopify store? Track the total sales of all products and services through your online store daily, weekly, monthly, yearly, or within a specified date range.
- New customers and repeat customers. How effective is your store at attracting new customers?
- Shopping cart overview. Is your shopping cart set up properly? Monitor trends in the checkout process that result in abandoned carts, unfulfilled orders, and completed orders. Assess the effectiveness of your store at supporting the purchasing decisions of your visitors and repeat customers.
Now you can benefit from the experience of our Shopify experts, who have put together a plug-and-play Databox template showing the most important KPIs for monitoring your online store’s performance. It’s simple to implement and start using as a standalone dashboard or in ecommerce reports, and best of all, it’s free!
You can easily set it up in just a few clicks – no coding required.
To set up the dashboard, follow these 3 simple steps:
Step 1: Get the template
Step 2: Connect your Shopify account with Databox.
Step 3: Watch your dashboard populate in seconds.
Offer Free Shipping
If possible, add some sort of free shipping offer on your website (e.g. when they reach a specific amount).
Not only will this tell them that there aren’t any hidden shipping fees waiting for them at the end of the checkout, but the total purchase amount will seem lower. The customers will feel like they’re getting a good deal.
Nicole Bolton of Iconic Celebrity Outfits is one of the respondents that saw success with this tactic:
“I improved my checkout rate by offering free shipping on a certain amount of shopping. Once a shopper reaches a certain amount, it automatically generates a free shipping coupon. However, free shipping in any form attracts buyers. They hardly reconsider their purchase when they get free shipping after spending a specific amount. It usually works well for impulsive buyers.”
Nicole also warns that you “shouldn’t compromise on your profit, in all cases; it should be a win-win for your business.”
Another thing you can try out in combination with free shipping is letting the customers know how close they are to getting the free shipping.
When you showcase that they’re making progress toward the benefit, it keeps them motivated to continue with the purchase.
Melanie Edwards of OLIPOP uses this segmentation method and throws in one extra tip to secure the sale:
“Once our customers add a product to their bag, we let them know how far away they are from free shipping. We also allow them to make the purchase as a gift. These options have greatly improved our checkout abandonment rate. The more information you give your customers during the checkout process, the better. Who doesn’t want to unlock free shipping? Or, maybe they’re on the fence about purchasing for themselves, but they’re happy to purchase our product as a gift. Don’t give your potential customers a reason to abandon their carts.”
Implement a Live Customer Support Chat
Even if you cover all the relevant details and simplify the steps in the checkout process, some customers will have a few questions before finalizing the purchase.
In this case, it can be extremely helpful to implement a live customer support chat that will get in touch with them immediately and resolve the issue.
Muhammad Tariq of LonleyAXE saw a huge improvement in his abandonment rate when he introduced a 24/7 live chat support system.
He explains that the “chat system allows me to quickly and easily answer any questions customers may have, which helps to keep them engaged and ensures they don’t abandon their checkout process. Additionally, since I have a live chat system available 24/7, I am able to quickly and easily address any issues that customers may have and resolve them as quickly as possible.
This has resulted in a significant decrease in the checkout abandonment rate, as customers are more likely to stay engaged and complete their purchase if they have immediate access to support.”
Include Several Payment Options
Revisit your payment options to make sure you really are providing your customers with enough flexibility.
Also, try to list which payment options you’re offering beforehand. A lot of prospects will leave the sales funnel if they find out that their preferred payment option isn’t available.
Adam Garfield of Hairbro says that offering several payment options helped him “ensure that customers could easily complete their purchase with the method they felt most comfortable using. As a result of these changes, our checkout abandonment rate decreased by 15%. This helped to increase our sales and overall revenue.”
Ai Hiura of FAVERIE mentioned that alongside adding more payment methods, they also reduced the number of steps in the checkout process. These two changes resulted in “an immediate decrease in abandoned checkouts, with approximately 10% fewer customers dropping out before completing their purchase.”
Related: The 11 Best Ecommerce Payment Processing Tools
Create a One-Step Checkout Process
A one-step checkout process means that customers can make a purchase on your website by completing a single form on one page. The idea is to make the process as simple and seamless as possible.
Shipping information, payment details, personal information… everything is immediately accessible on a single page, which has a huge impact on decreasing “rage quits” at the end of the funnel.
Overall, this method reduces friction and improves user experience and efficiency.
Pulkit Bhardwaj of BoutiqueSetup explained that by changing the checkout process from multiple pages to a single one, he helped his eCommerce store “reduce the abandonment rate by 5%”.
Simplify the Checkout Process and Provide a Seamless Experience
While this might sound like an obvious strategy, there are many websites that still make their customers go through a tedious process in order to complete a purchase.
As one of our graphs above showed, a lot of the companies we talked to were guilty of this at one point.
David Zhang of Kate Backdrop says that user experience changes such as reducing loading times and marking out steps had a “huge impact on improving the checkout abandonment rate”.
“This demonstrates that providing customers with an optimal checkout experience is paramount to preventing them from abandoning their shopping carts. I’m confident that our strategies can be applied to other e-commerce businesses, and I would recommend evaluating your checkout page to ensure it is optimized for customer convenience.”
Alan Carr of Webpop Design explains that there are three things that need to be simplified in order to decrease the abandonment rate:
“For us, 30% is a great check-out abandonment rate as we realize it can never be zero, due to factors beyond a seller’s control. The customers will always abandon their carts due to a failed payment process or in their apprehension to buy research completely about a product before they buy. This is especially true for high-value products or services.
We did however identify three factors that were resulting in higher bounce rates – account creation, complex checkout process, and complex fees and charges.
To improve our conversion we simplified all three processes along with improving overall website speed optimization. The checkout process needs to be as smooth as possible for a positive conversion rate. It should be efficient, with website speed optimized to follow the two-second rule, where all pages load within two seconds.
Allowing customers to place an order as a guest, rather than having them create an account with log-in credentials has also helped us improve our checkout abandonment rate.
Furthermore, the option to auto-fill their saved details from their already established Google or Apple accounts has further fastened the process and helped us understand customers’ need to optimize their virtual shopping experience.”
Use Exit-Intent Pop-Ups
Exit-intent pop-ups are the corner notifications that appear when a customer’s mouse movement suggests that they’re about to leave in the middle of checkout.
With them, you can offer customers some sort of compelling reason why they should complete their purchase (e.g. free shipping or discount code).
Dan Sears of Ledask says that this has been one of the most effective ways to improve checkout abandonment rates for his company.
Sears explains that they implemented pop-ups that would appear when a customer “appeared to be navigating away from the checkout page, and offered them a special promotion, such as a discount code or free shipping, to encourage them to complete their purchase. This alone contributed to a 15% decrease in the abandonment rate.”
Another way you can use them is to gather information about the customer that you can later use to retarget them with a personalized email.
This is what Neeraj Arya of PMExperto uses to persuade prospects to complete the purchase:
“We send personalized emails with discounts to those with incomplete transactions. We create their personal coupon code and send them with a limited timeline.”
Test Different Pricing Models
While this strategy isn’t always applicable, it can bring great results if you’re selling higher-end products or services.
For instance, if it’s something in the info-publishing space, you can A/B test fixed pricing and a monthly subscription to see which one brings better results and reduces checkout abandonments.
A subscription model can tackle some common customer pain points and help with:
- Flexibility – A monthly subscription model may be more attractive if they want more flexible payment options.
- Budgeting – It’s easier to plan for subscriptions and it reduces the sticker shock of a high upfront price.
- Value perception – With a subscription model, customers can feel as though they’re receiving more value since it’s tailored for ongoing use.
Daniel Apke of Land Investing Online has been able to reduce his checkout abandonment rate with this method:
“In our case, we offer a high ticket investing program about land flipping, and people need time and resources to decide to get it. What we offer is unique because there are not a lot of real estate investors that get into land flipping. Mostly, it’s house flipping.
And since it’s a high-ticket product, we’ve expected to get a high checkout abandonment rate, which we tried to resolve by strategizing around the pricing. We cut the original cost and added a $99 monthly subscription fee. Now, the sign-up fee costs less, which has helped us drive down the checkout abandonment rate to a better figure.”
Benchmark Your Checkout Abandonment Rate Against Hundreds of Companies Like Yours
Optimizing your checkout process and the overall buying experience is one of the best ways to ensure more sales for your online store.
And while following some general best practices such as simplifying the checkout process, offering free shipping, or adding more payment options can help you reduce the abandonment rate, it’s necessary to also understand how you fare against others in your niche.
This is exactly what you’ll find out by joining our Shopify benchmark group.
Plus, apart from the abandonment rate, the 300+ companies that are currently enrolled also share insightful benchmark metrics such as gross sales, total sales, total customers, and more.
And this is just scratching the surface of what you can find in our Benchmark Groups.
We have 1,000+ metrics that you can start benchmarking immediately against cohorts of similar companies.
The data is updated in real-time and you can zero in on any department you want – from finance to marketing.
You can join any group for free and all you have to do is share some of your data in the cohort – it’s 100% anonymous (both for you and the competitors). Opt-out any time you want, no strings attached.
And to sweeten the deal even further, you also get a free Databox account when you open the account.
Sign up for free and check out how you stack up against the competition in areas that matter the most.


