Uses one-click integrations:
-
 ChartMogul
If you don't use ChartMogul, you can pull data from any of our 130+ one-click, native integrations or from spreadsheets, databases and other APIs.
Try this dashboard for free
ChartMogul metrics included in this template
-
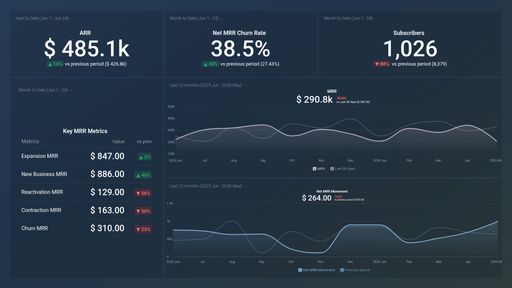
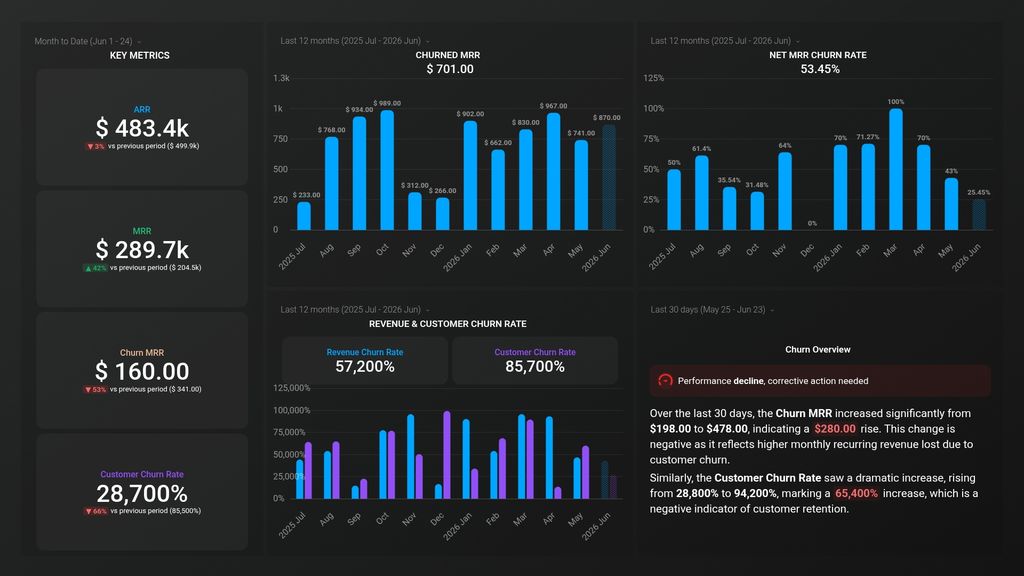
ARR
ARR stands for Annual Recurring Revenue and is a metric that calculates the total predictable revenue a company expects to earn annually from its subscription-based customers. It provides a clear picture of the company's revenue stability and growth potential.
-
Churn MRR
Churn MRR measures the monthly recurring revenue lost from customers canceling their subscriptions or downgrading their plans.
-
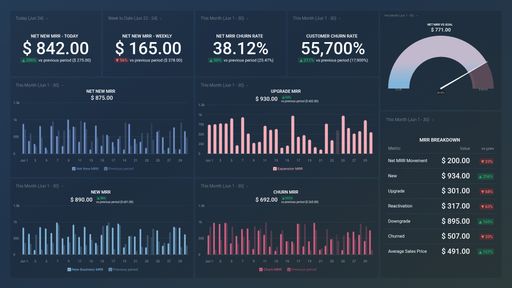
Customer Churn Rate
Customer Churn Rate measures the percentage of customers who cancel or stop subscribing to a product or service over a specific period of time.
-
MRR
MRR (Monthly Recurring Revenue) is a key metric for subscription-based businesses that measures the predictable revenue generated from subscriptions on a monthly basis.
-
Net MRR Churn Rate
Net MRR Churn Rate measures the rate at which recurring revenue is lost due to downgrades, cancellations, and churned customers, accounting for any expansion revenue from upsells or cross-sells.
- Revenue Churn Rate - ChartMogul