


Table of contents
On this episode of Data Snacks, we are going to show you how you can easily track Close Rate by Sales Rep in HubSpot CRM along with some advanced options you might want to consider.
So let’s begin.
If you’re a HubSpot CRM user, you’re probably already tracking things like calls, emails, logged new deals, and deals one all by sales rep.
Now, these are standard metrics for any CRM to track so that sales leaders may track not just their overall pipeline and sales but also to track individual performance.

Close Rate by Sales Rep
There’s one metric that isn’t easily tracked in HubSpot CRM. And that’s close rate by sales rep. It’s a simple enough calculation, right? So you divide the number of new deals created by sales rep by the number of deals won by that rep. Now, this way, you can measure individual performance and even identify areas that may need support.
But many HubSpot CRM users still find themselves having to create manual workarounds in order to track it. So in this episode of data snacks, I’m going to show you a few different ways on how to easily track and visualize close rate by sales rep from HubSpot CRM, no manual workarounds included. So you’ll be able to quickly see which of your sales reps may need help improving.
Let’s dive in.
HubSpot Sales Rep Dashboard
So here’s the finished Databoard, and I’m going to show you how to recreate it. As you can see, it has your team’s overall close rate in the top left close rate by sales rep in the bottom left, and a funnel to show a specific sales reps overall conversion rate, and the number of deals currently in each stage.
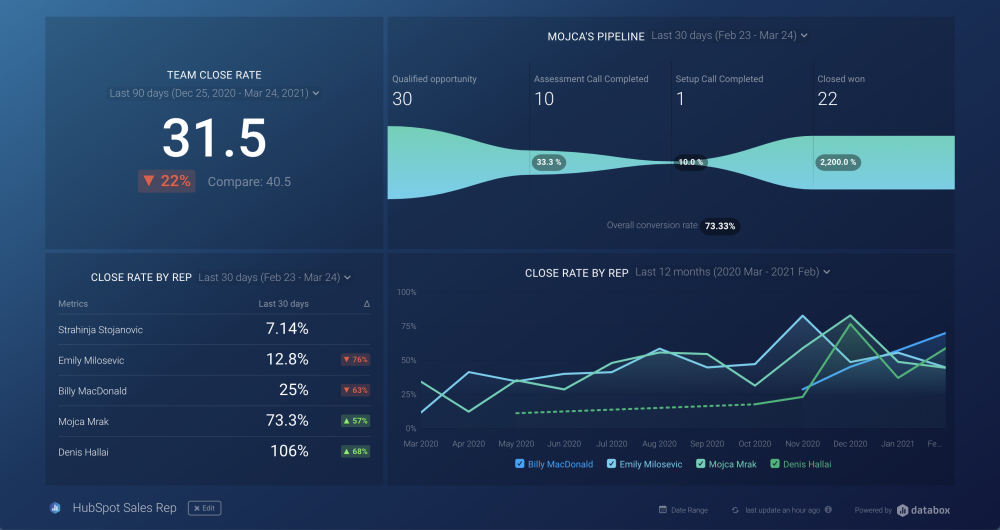
Keep in mind that this is just a snapshot in time, but if you want to see how consistent your sales reps are at closing, you can simply lengthen the time from the last 30 days to something like the last 90 days to see how it varies. Now, let’s talk about how to build this to calculate close rate for your whole team.
Use this sales team activity dashboard to measure and compare your sales team performance and productivity at any given time.
Calculating Close Rate for The Whole Sales Team
You need to divide two metrics deals created by deals closed/won. So to calculate close rate by sales rep, you need the same two metrics, but by owner. The number of deals created by owner in a certain time period and the number of deals closed/won by owner during the same time period. You can see here in the Databox Metrics Library that all four of these metrics are pre-configured for you.
You can just select and add them to your metrics screen, or as I’ll show in a minute, to a data calculation and a databoard. Now, when adding the by owner metric to your metrics screen, you’ll be prompted to select a sales rep as a dimension. Now we’ll calculate close rate and close rate by owner using two different data calculations.
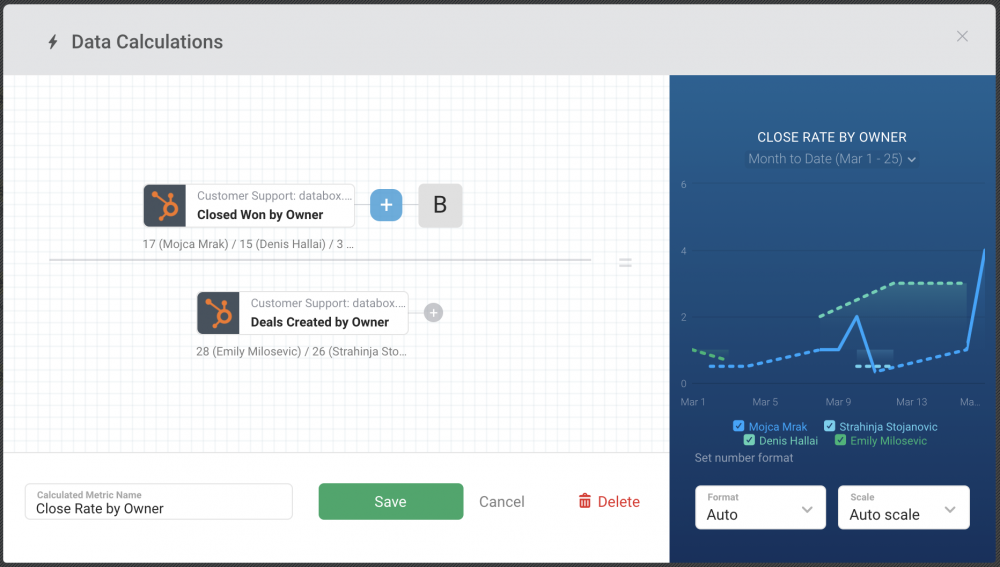
First, I’ll navigate to the data calculation feature, click new calculation, and add closed won deals to the numerator. Then I’ll choose the division sign and add the deals created. Now that’s my overall team’s conversion rate, which I’m showing in my top Datablock. Next, I’ll navigate back to data calculations, click new calculation, and add the closed/won deals by owner.
Once again, I’ll choose the division sign. And then add the new deals by owner metric. Now, at this point, you can select the sales rep as a dimension for both metrics in here already, which means that this metric will always show results just for that specific rep. Or you can leave the dimension blank, and you’ll select the sales rep you want to see the results for whenever you add the metric to the databoard. So, for now, I’m going to leave it blank. Now let’s use the same data calculation to recreate this table here on the left. So for this one, I’ll just grab a blank table visualization, and I’ll drag and drop it to the board.
Then I’ll choose my data calculation for the metric on the right here. Now, since this is a multi-metric metric, I’ll just show all my sales reps in the table. You can even sort them by ascending or descending. You could also create your sales reps’ close rate over time using a line or a bar graph too.
And you’d built it the same way I just built that table Datablock, except that you can quickly choose which reps you want to show. Using a line chart really lets you determine whether your reps are getting better at closing deals.
Some Advanced Sales Metrics to Consider
And, that’s it. Now, before I let you go, let’s talk about two more advanced options that you might need to know about. So first, to diagnose why some reps have a lower or higher close rates, you might want to look more closely at how many deals are in each stage of their funnel. Second, if you have multiple pipelines in your CRM or some other way you are categorizing your deals using custom new properties, you will need to use our Metric Builder functionality to grab a subset of each rep’s created and closed deals.
So, for example, we have multiple pipelines for new and upgrade deals and sell both products and services. So when we want to look at just our new product deals, we have to create a query. Here’s what that looks like. For example, here’s a pipeline visualization, of our sales rep Mojca’s deals in each deal.
So with this visualization, we can look at the conversion rate by deal stage by sales rep to zero in where a rep might need to improve in order to improve their overall conversion rate. So to create this, you simply navigate to custom metrics and click create new custom metric. Name the metric, choose count of deals as the metric, and deal stage as a dimension. Then set date field to create a date. And that way, the system will count all the deals created in that time period owned by the rep. In the advanced settings, set deal owner as property, contains and type in the name of the team member.
Monitor and manage your sales prospects as they move through the different stages of the buyer’s cycle using this sales pipeline dashboard.
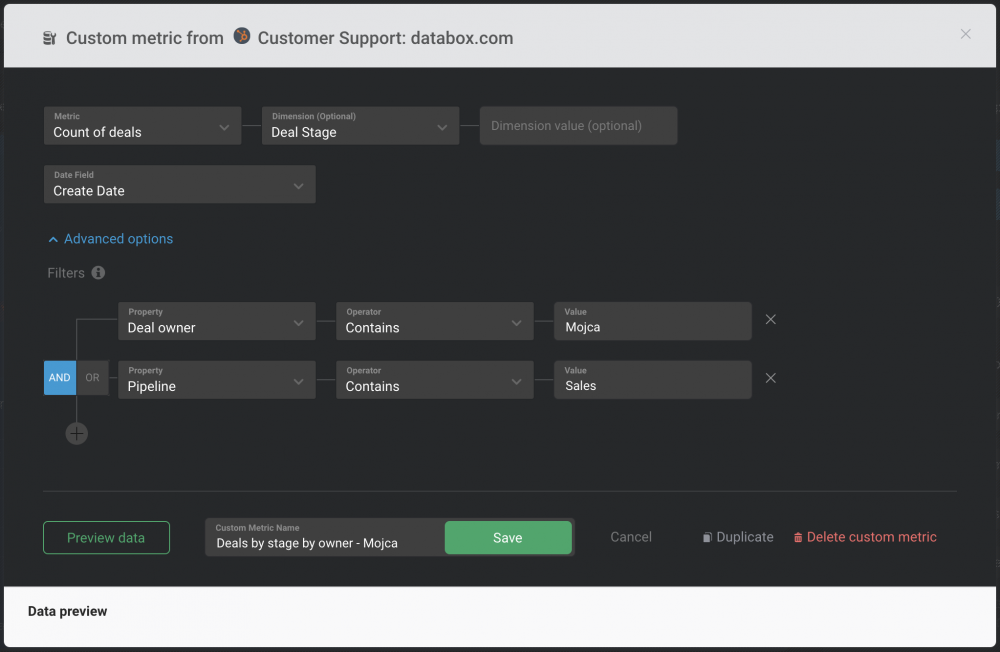
You also need to set the pipeline from which we are tracking the results, and you can set the specific stage you want to track in the metric here, meaning it will always show the results just for this stage. And you can then duplicate the metric to set it to a different stage, or you leave that part out and choose the stage as a dimension every time you add it to the board and just rename the row.
That’s what I’ll do now.
And once you put all the metrics into a pipeline or a funnel visualization, the system automatically calculates the conversion rates between all stages. Now I’ve done this for all the stages in our pipeline. And as you can see with the pipeline or funnel visualization, the system automatically shows the overall conversion rate.
So you can show the ratio between stages too. Just keep in mind that this isn’t a conversion rate since deals move in and out of stages at different times.
So that’s it for today. Once you go through these steps, you’ll be able to easily track and visualize close rate by rep in a few different ways.
Want someone from our team to help build these reports for you at no charge?
Start a chat with one of our dashboards experts, and they’ll build out a full sales dashboard for you that includes metrics like the one I showed you here today.
Not a Databox user yet? Start a free account here.
See you next time.


