
Reports
Share performance reports that drive decisions
Build reports that explain what changed and why, or let your AI Analyst build them for you. Automate the sending, and save hours of work every month.
Trusted by 20,000+ teams worldwide








Everything your team needs to know, in one report
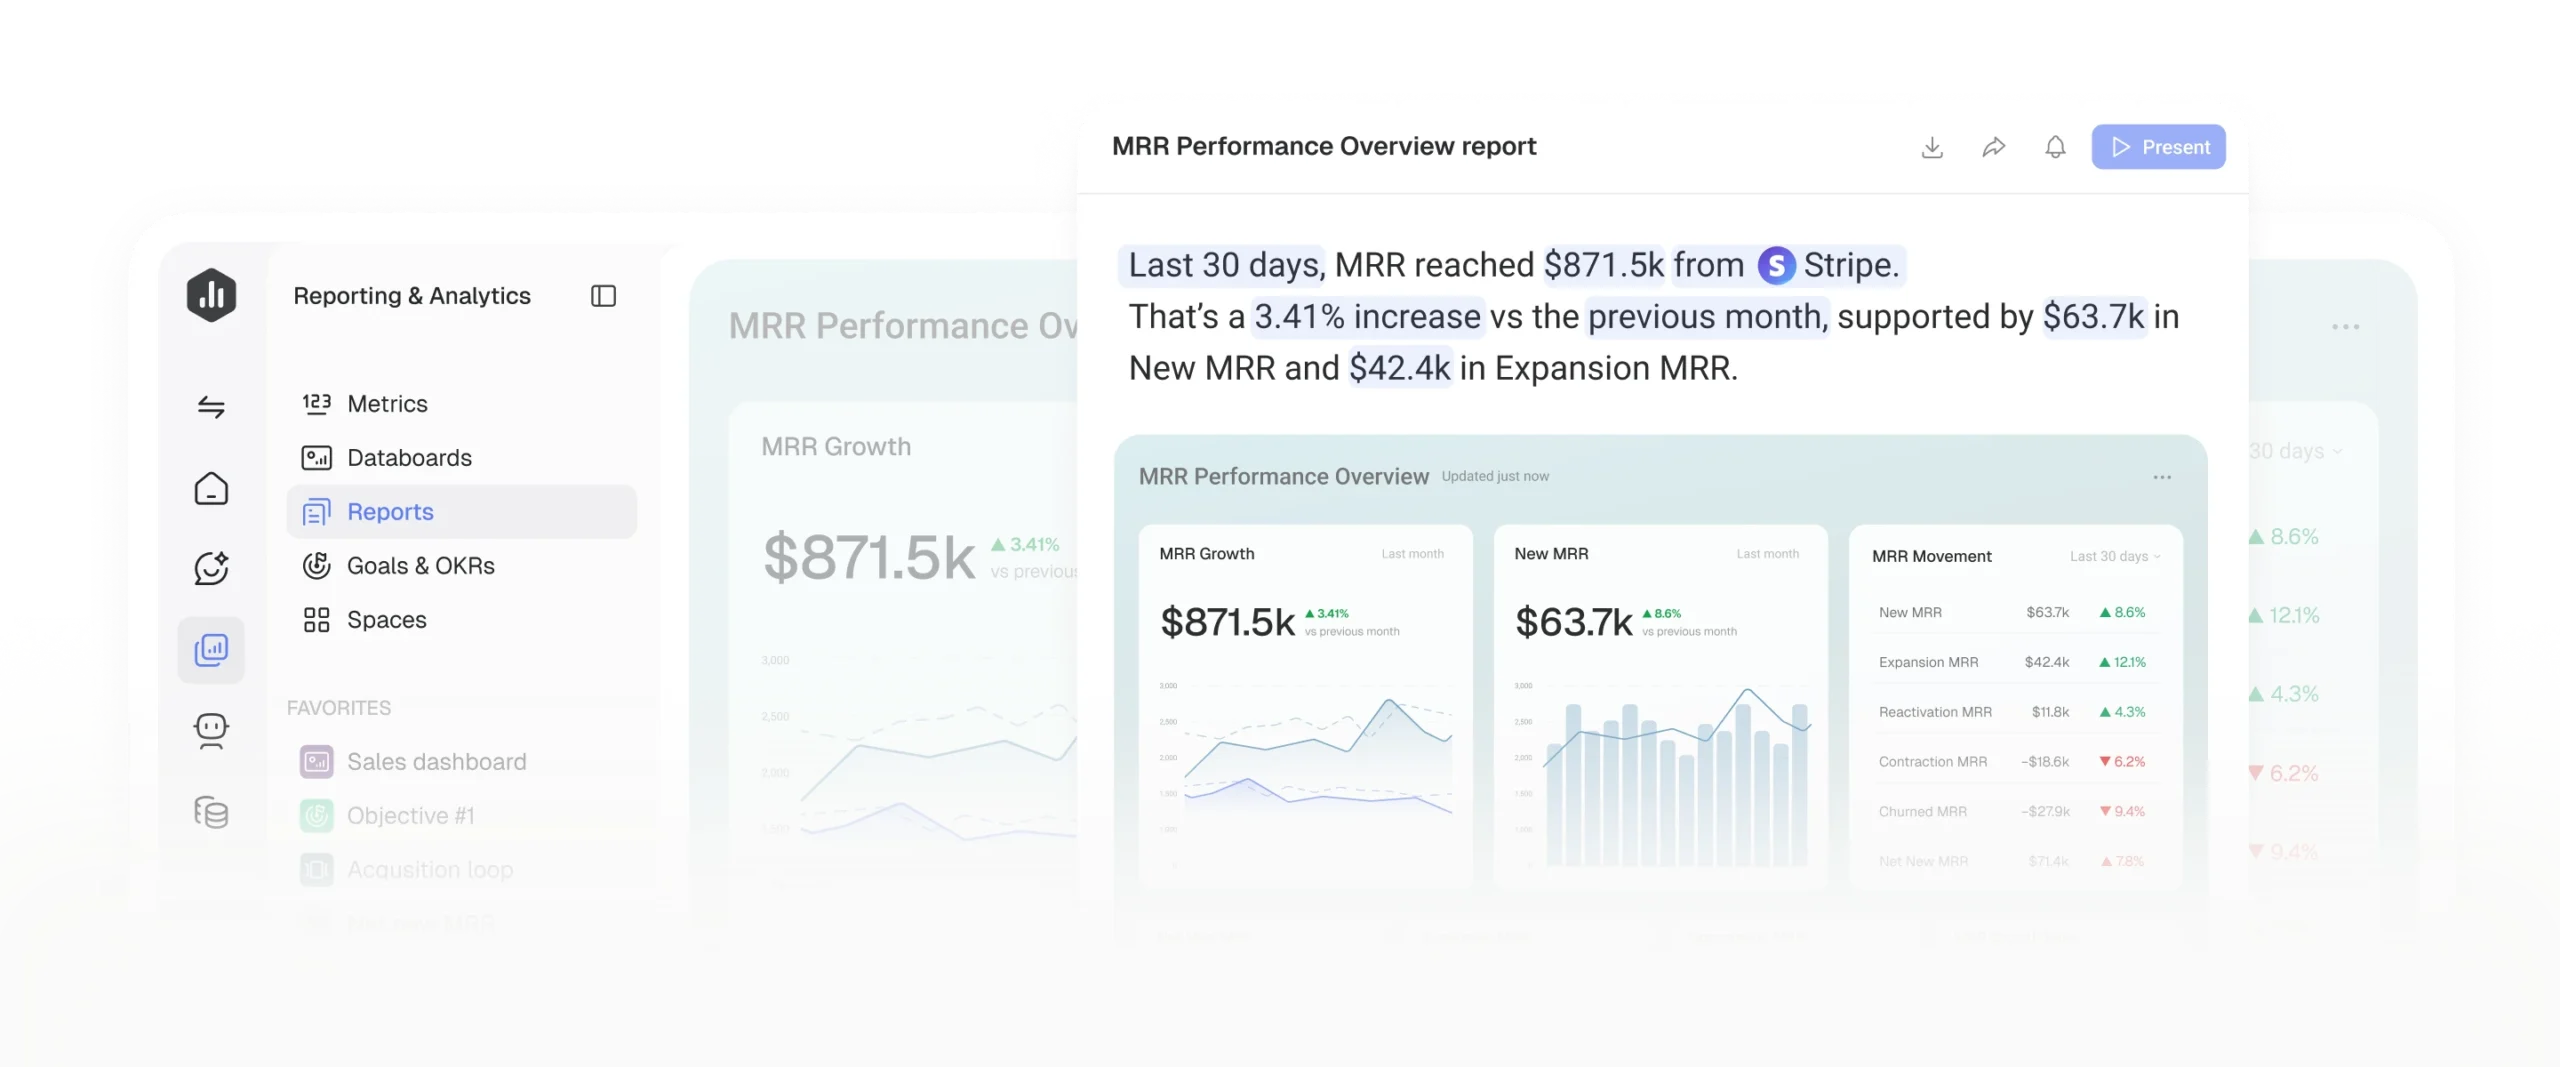
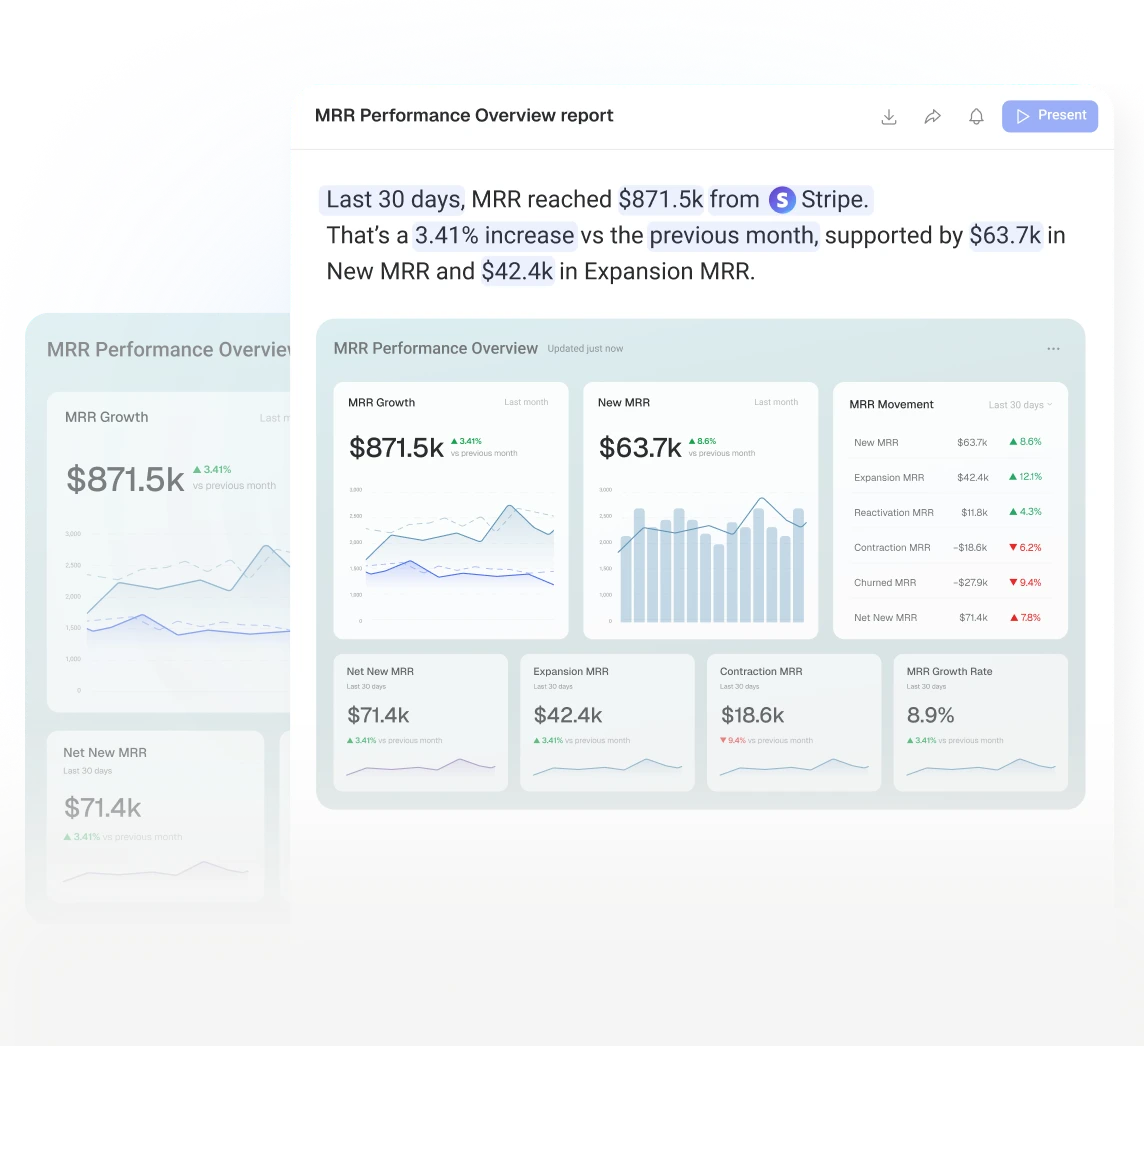
Databox turns your live data into performance reports you can present and share with anyone. Pull in your dashboards and metrics, add written summaries that explain what changed and why, then schedule the report to send on its own.
Build
Build a report in any format
Build a report from the dashboards and metrics you already track, then add the context that explains them.
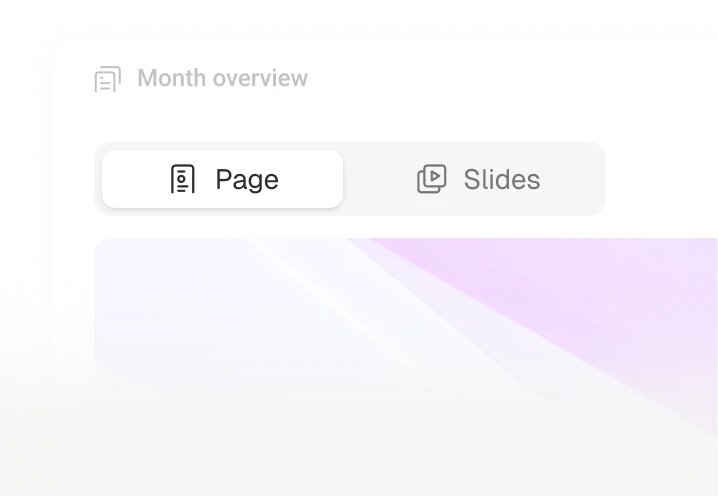
Page or slide deck
Build a scrolling page people read on their own, or a slide deck you present live. Switch between them anytime.
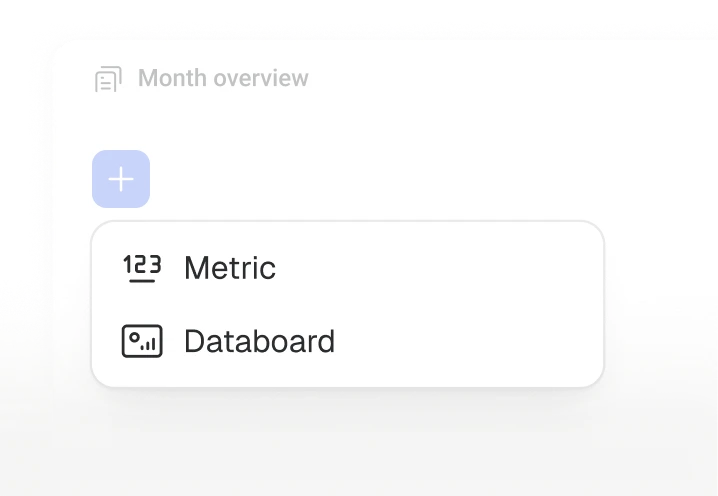
Your dashboards and metrics
Pull in the dashboards and metrics you already track, so you never copy a screenshot into a slide again.
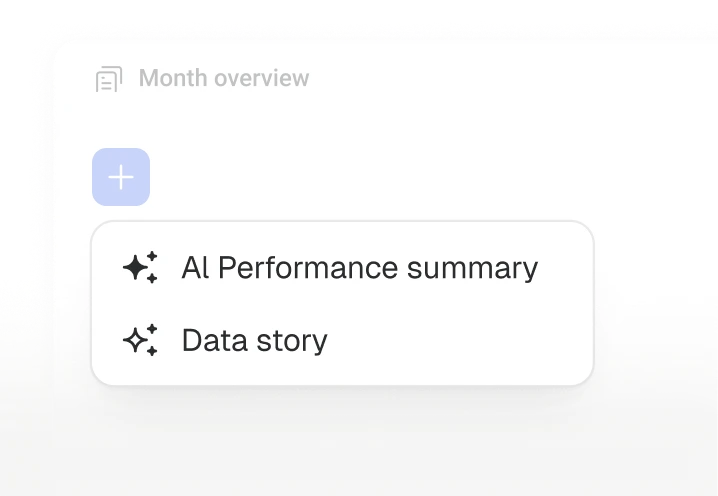
AI summaries and Data Stories
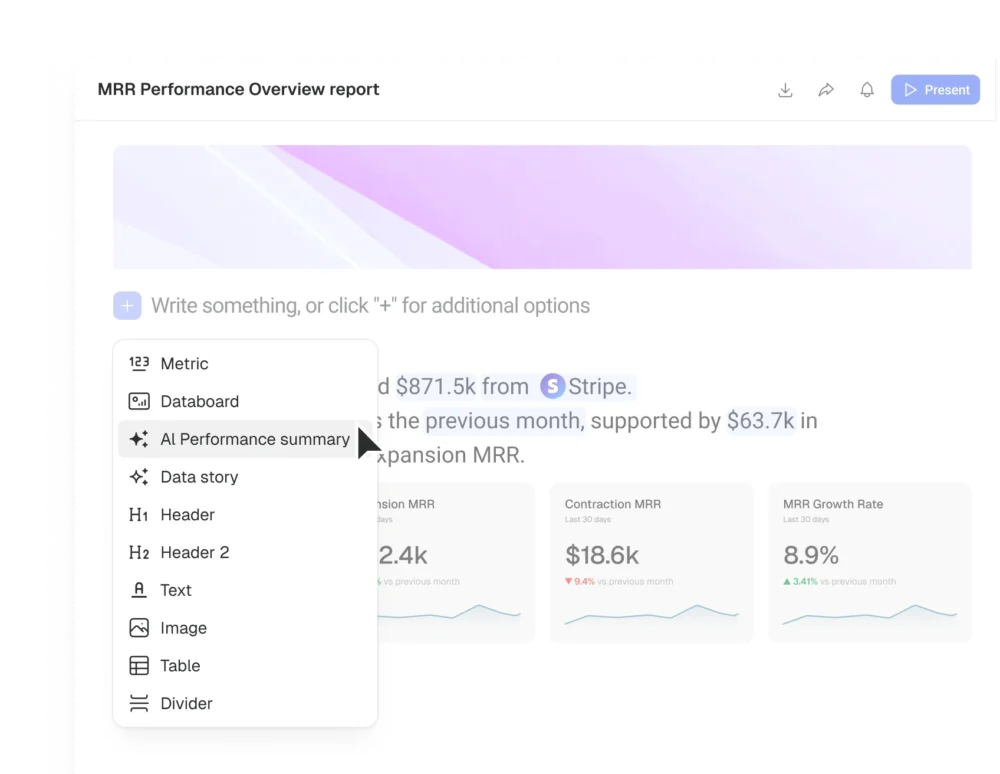
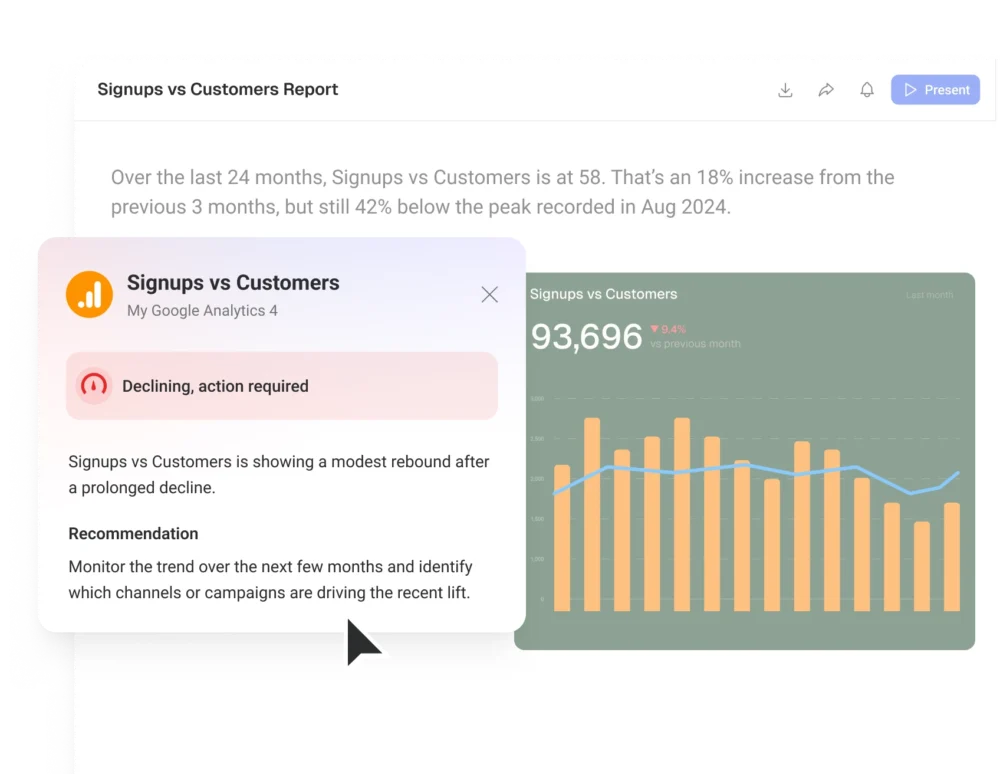
Add an AI-written recap of what changed and why, then edit it. Or a Data Story to pull live figures into your text, updated on every send.
Customize
Customize it to match your brand
Add your cover, colors, fonts, and logo, so every report looks like it came from your company.
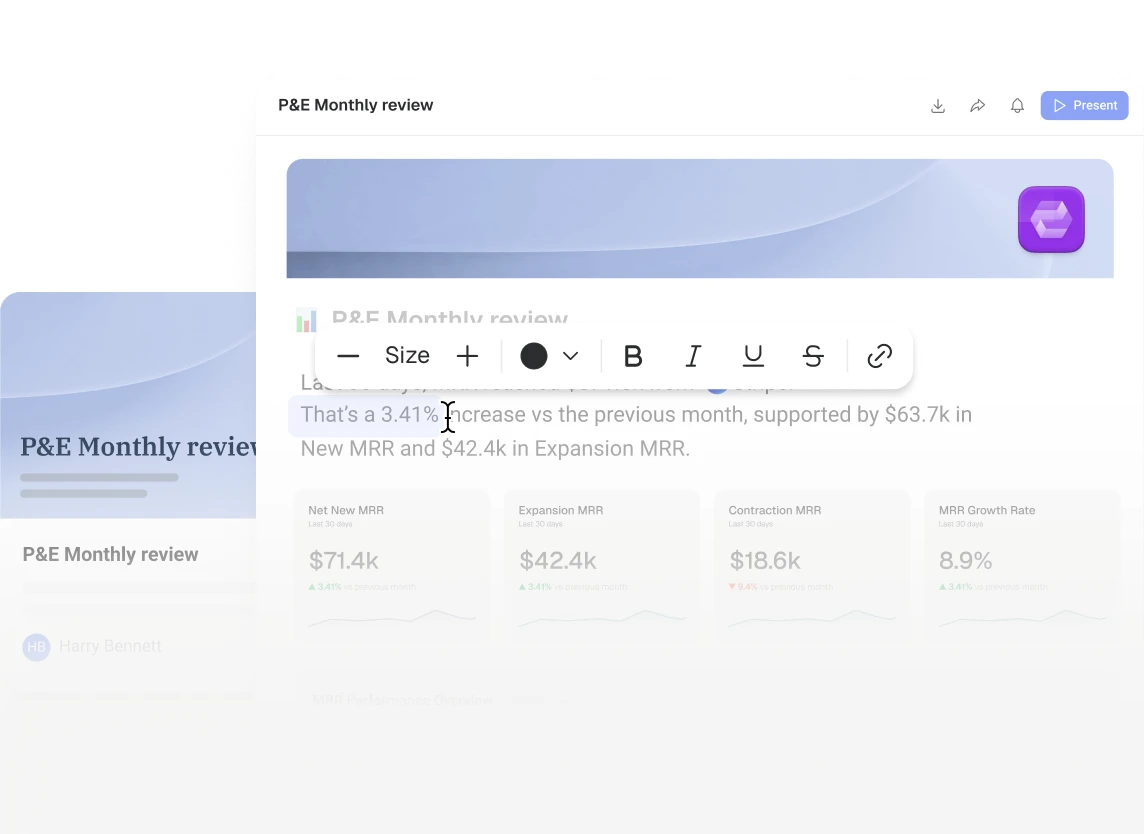
Branded covers
Add a branded cover to your report, so it looks polished and professional from the start.
Fonts, colors and logos
Match the report to your brand with your own fonts, colors, logo, and emoji.
White-label for clients
Send reports under your own brand with our white-label add-on. Add your domain, logo, and login.
Share
Share the report however works best
Get the report to everyone who needs it, the way each one likes to see it.
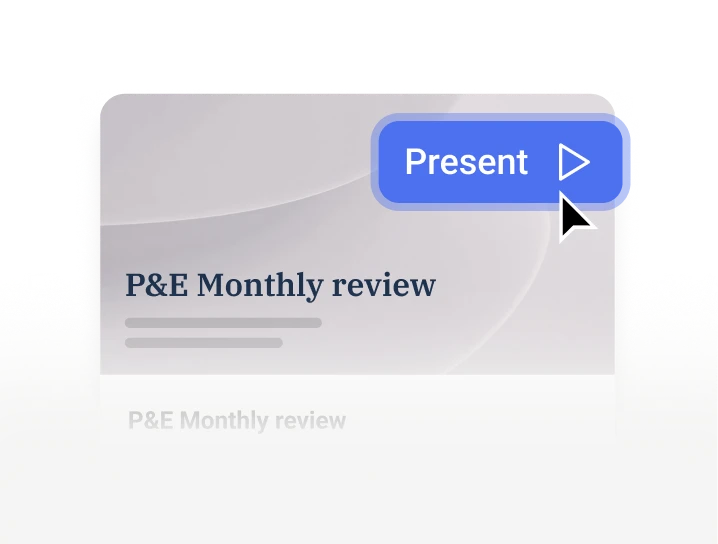
Presentation mode
Go full-screen with speaker notes, and walk the room through performance.
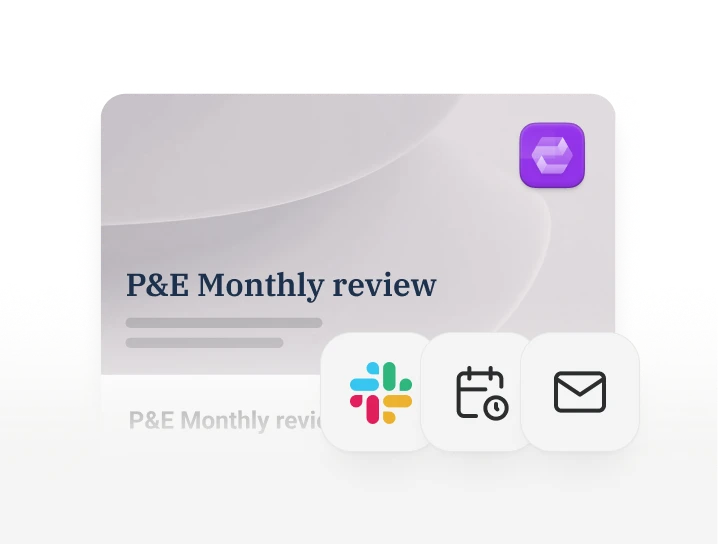
Scheduled delivery
Set it once, and it sends to email or Slack on repeat: daily, weekly, monthly, or quarterly.
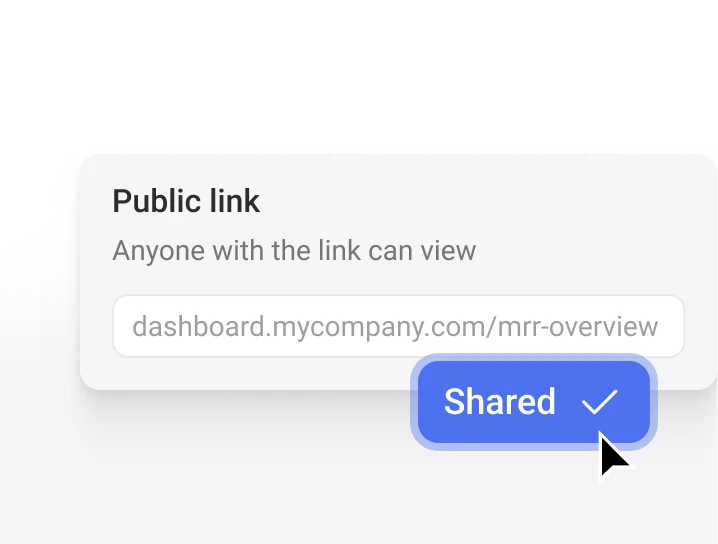
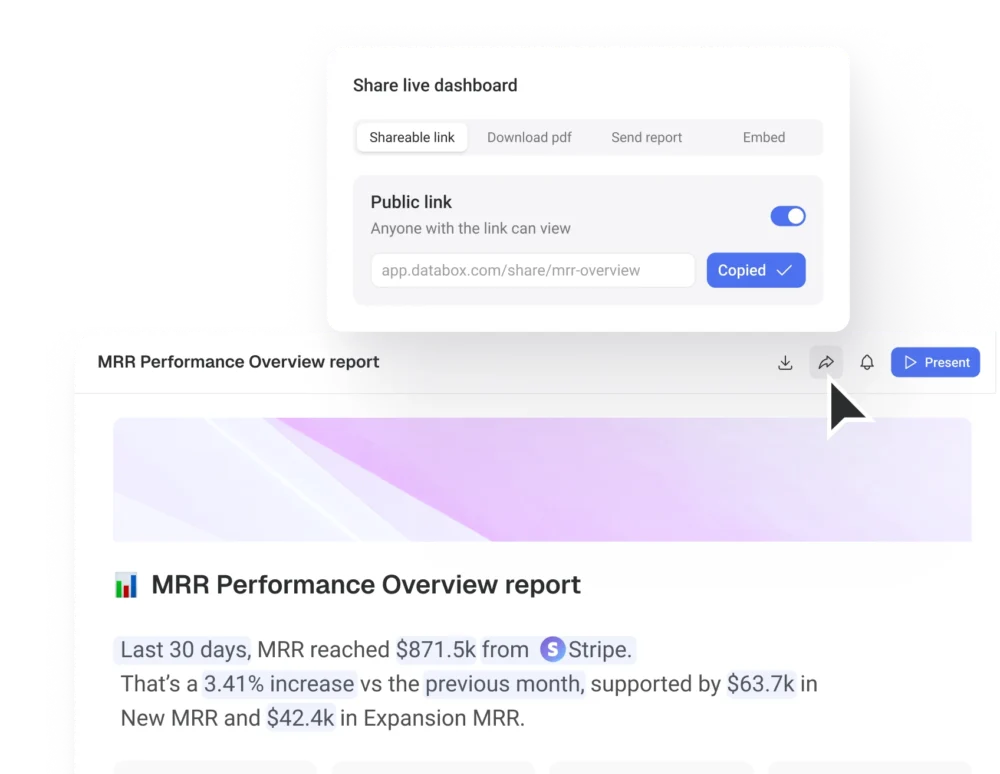
Shareable link
Share a link so recipients can view the full report in their browser, no account needed.
Unlock more insights
Ask your AI Analyst to handle reporting
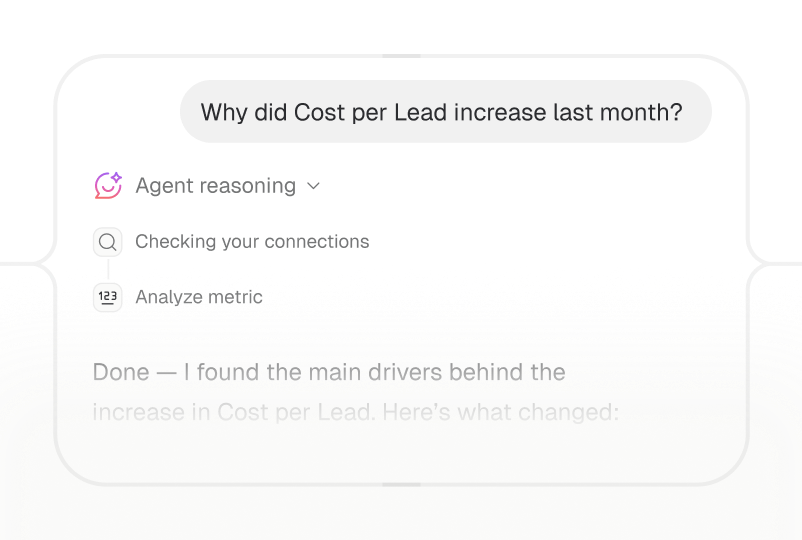
Every Databox plan comes with an AI Analyst built in. Ask it about your performance, get answers in seconds, then turn that whole conversation into a report or slide deck you can send to anyone.
Get answers in seconds
Ask about your performance in plain language and get a clear answer, the moment you need it.
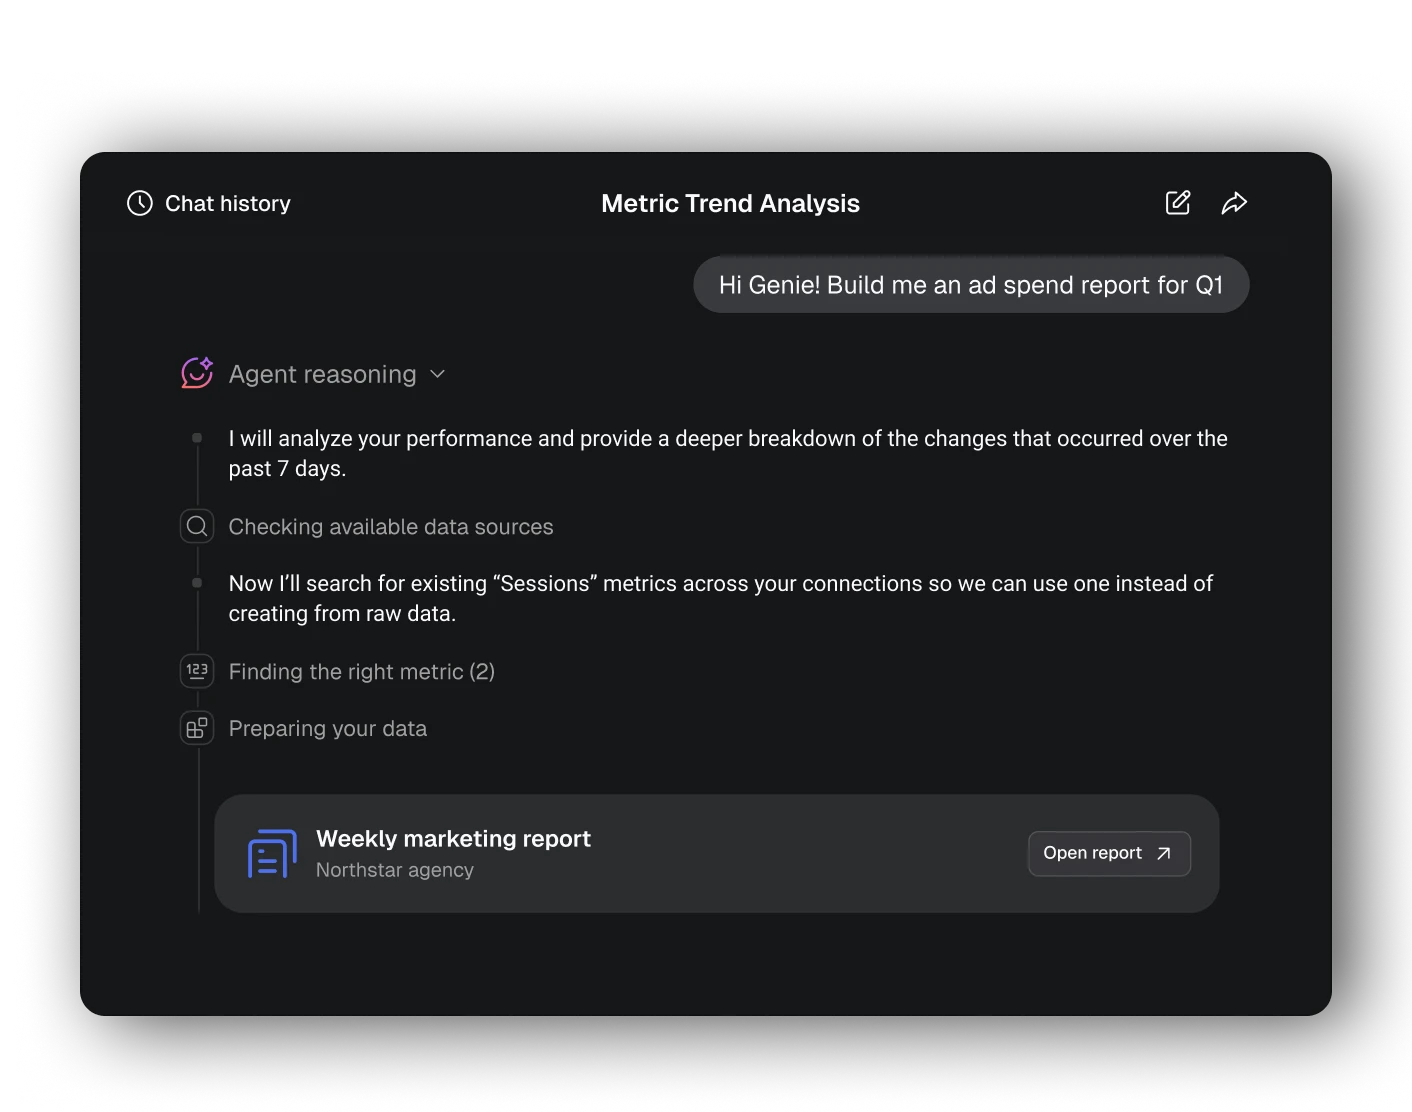
Turn a chat into a report
Turn any conversation with your AI Analyst into a report or slide deck you can send, so you skip building it from scratch.
Answers you can trust
Every answer and report is built from your verified metrics, so you can trust every number you send.

“We’ve grown year on year over the last five years, and I think a big factor in that is business reporting and Databox.”
 Martin Saunders
Rivertrace and Solar Solve
Martin Saunders
Rivertrace and Solar Solve
Every team has a report to send
Spend less time building reports and more time acting on it.
Marketing
Prove campaign ROI to clients and leadership, without spending days exporting from each ad platform.
Sales
Keep leadership current on pipeline and the forecast, without rebuilding the same report every week.
Finance
Send accurate revenue and spend reports to leadership and the board on time, without the manual consolidation.
Operations
Keep everyone posted on performance and flag issues early, without chasing numbers across tools.
Agencies
Cut the hours you spend on client reporting, and send branded recaps that keep clients confident.
Do more with Databox
Explore the rest of the platform.
Learn more
Frequently asked questions
What is reporting software?
Reporting software turns your live performance data into a polished, shareable document that explains what happened over a period and why. Databox lets you build a report from the dashboards and metrics you already track, add an AI-written summary of what changed, and schedule it to send automatically.
What’s the difference between a Report and a Dashboard?
Dashboards track and monitor metrics in real time, best suited to “month-to-date” views. Reports are for deeper analysis of historical performance, typically covering broader periods like last month or last quarter, and are usually sent as a PDF.
Can I download my reports as PDFs instead of scheduling them?
Yes. Every report can be exported as a PDF whenever you need it, without turning on a recurring schedule.
What are Data Stories?
Data Stories are dynamic elements, like a metric’s name, value, and comparison period, that you add to the text of a report. They update automatically with the latest data every time the report sends, so the narrative never goes stale.
Can Databox automate recurring reports for clients or leadership?
Yes. Schedule any report to send automatically to email or Slack daily, weekly, monthly, or quarterly, so recipients get a recap on a fixed cadence without anyone rebuilding it by hand each cycle.
How can I share a report?
Our business reporting tool allows you to share multiple ways:
- download as a PDF to share via email or store as needed;
- send to email immediately or scheduled to any recipient from within the Reports Editor;
- send to Slack channels immediately or on a scheduled date and time;
- or automate it to export daily, weekly, monthly, or quarterly.
Is there an approval process before reports are sent?
Not yet. We will be rolling out a Reports Approval Process for both Growth and Premium plans in the future.
Is Databox reporting software good for client reporting?
Yes. Databox is built for agencies as well as internal teams — pull each client’s dashboards and metrics into a branded, white-labeled report, add an AI-written summary of what changed, and schedule it to send automatically, so client reporting stops being a manual, end-of-month scramble.