Uses one-click integrations:
-
 HubSpot Marketing
If you don't use HubSpot Marketing, you can pull data from any of our 130+ one-click, native integrations or from spreadsheets, databases and other APIs.
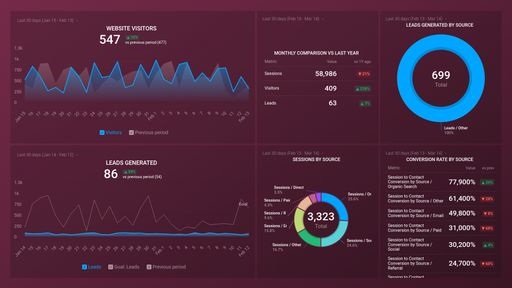
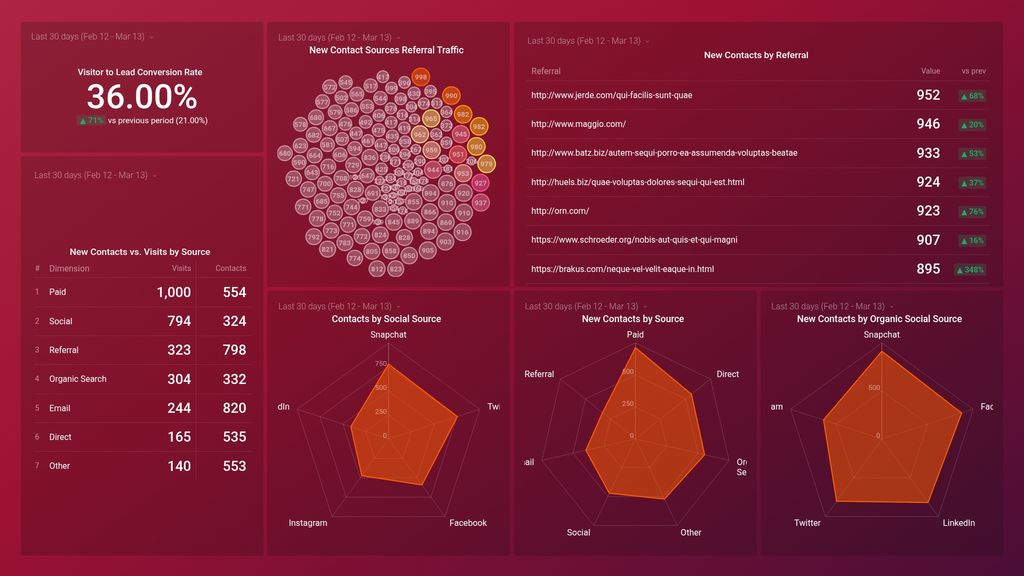
Try this dashboard for freeWhat you’ll learn from this HubSpot (Leads by Source) Dashboard Template:
Connect your HubSpot Marketing account and learn:
- What social sources generate the most leads for my business? See and compare side-by-side the number of leads generated by each social source during a given time period. Use this information to determine what specific social sources to focus your time and efforts on to generate leads further.
- What are the top sources for generating new leads for my business? See which sources drive the highest number of new leads for your business at any given time. Keeping track of your best-performing lead sources makes it easier to prove your marketing ROI and determine what sources to concentrate on to close more deals quickly.
- What percentage of my site visitors convert into leads? Find out what percentage of your website visitors eventually convert into leads during a given time period. Use this metric to measure the effectiveness of your marketing efforts in converting blog/website visitors into customers.
- How do I track and capture lead traffic from referral sources? View the total number of new leads generated from referrals and what percentage of these leads can be attributed to each referral source. It is helpful to learn how your customers are finding you to strengthen your relationship with the website(s), generating the most leads/referral traffic for you.
- Which sources drive the highest quality visits and leads to my website? Track, analyze, and compare side-by-side the total number of visitors each traffic source drives to your website. Also, see how many of these visits convert into leads. Use this data to identify your over and under-performing traffic sources, as well as the traffic sources that drive the highest quality traffic (highest likelihood to convert).
Pull additional data using our deep integration with HubSpot Marketing.
What else can you track and visualize with our deep integration with HubSpot Marketing? When it comes to traffic and conversions, almost anything:
- Website traffic and conversions
- Traffic and lead demographics
- Total conversations
- Landing page performance
- The conversion rate(s) throughout your marketing and sales funnel(s)
- Track and compare the efficiency of your marketing campaigns
- Monitor campaign improvements and growth over time
There are many, many different metrics and metric combinations you can track using HubSpot Marketing. With Databox, you can quickly visualize 100s of HubSpot metrics in various ways, alongside all the important metrics from other data sources you’re using.
Read more about Databox’s HubSpot Marketing integration.
HubSpot Marketing metrics included in this template
- Visitor to Lead Conversion rate (%)
-
New Contacts by Referral
New Contacts by Referral tracks the number of new contacts generated through referrals from existing contacts, helping businesses measure word-of-mouth marketing success.