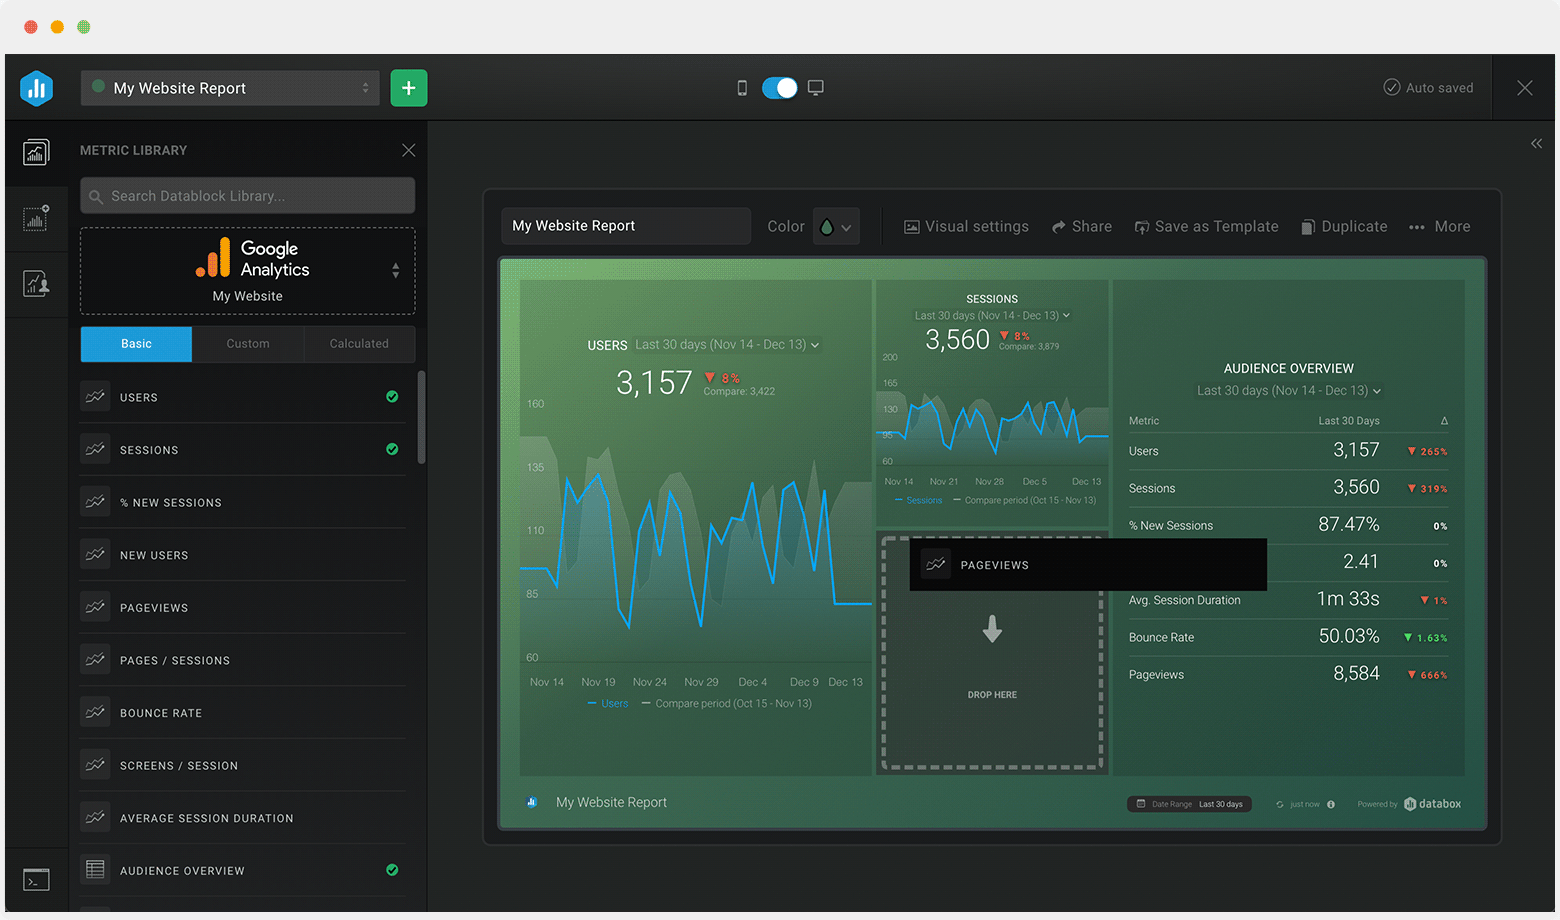
Track some of the most common Sales Pipeline metrics and KPIs and analyze your Sales Pipeline performance with just a few clicks.
You can build a dashboard with any data using Zapier, Make, Google Sheets, or a SQL database.
These sales pipeline dashboards come pre-built with some of the most commonly tracked sales KPIs and metrics from the most popular tools. You can also customize your templates later. To get started, just choose a template, connect your data, and your metric visualizations will populate automatically.
Create your free Databox accountHubSpot CRM dashboard template provides you with insights about deals and sales pipelines which will help you to track, and grow your pipelines.
Sales and marketing funnel performance and conversion rate optimization effectiveness.
HubSpot (Leads by Source) dashboard template gives insights on which sources of traffic drive the most leads or contacts. It explains where to focus marketing effort.
This dashboard shows the value of your company's current sales pipeline with a laser focus on what has closed this quarter. It also includes the expected value of the opportunities likely to close before quarter's end.
Pipedrive CRM dashboard template provides you with insights about opportunities, lost and won deals all to make sales more efficient.
Marketing & Sales dashboard template uses the Hubspot Marketing and Hubspot CRM products to give you a full view of both the top and bottom of your funnel.
This template gives you a complete overview of your leads in Salesforce so you can accurately track your sales progress.
No design or coding skills necessary.
Learn more about Dashboard DesignerText