Table of contents
After consulting on top of funnel metrics for many clients, Gabe Wahhab from Square 2 Marketing loves Google Analytics for one big reason.
Google Analytics gives him more insights than any other tool into the past, present and future of a site.
The biggest mistake that he sees is that digital marketers will stop their analysis at pageviews and site visitors. When marketers optimize for those two metrics, they miss out on the real metrics that determine the success of their site, regardless of whether it is B2c, B2B, ecommerce, SaaS or industrial products. It is kind of like the little hit counter from the 1990s.

It does not help you make data-driven decisions! Instead, you should be tracking the metrics that clearly relate to business goals. Visitor counts alone do not give you an idea of what might happen to your business if you increase traffic to your site.
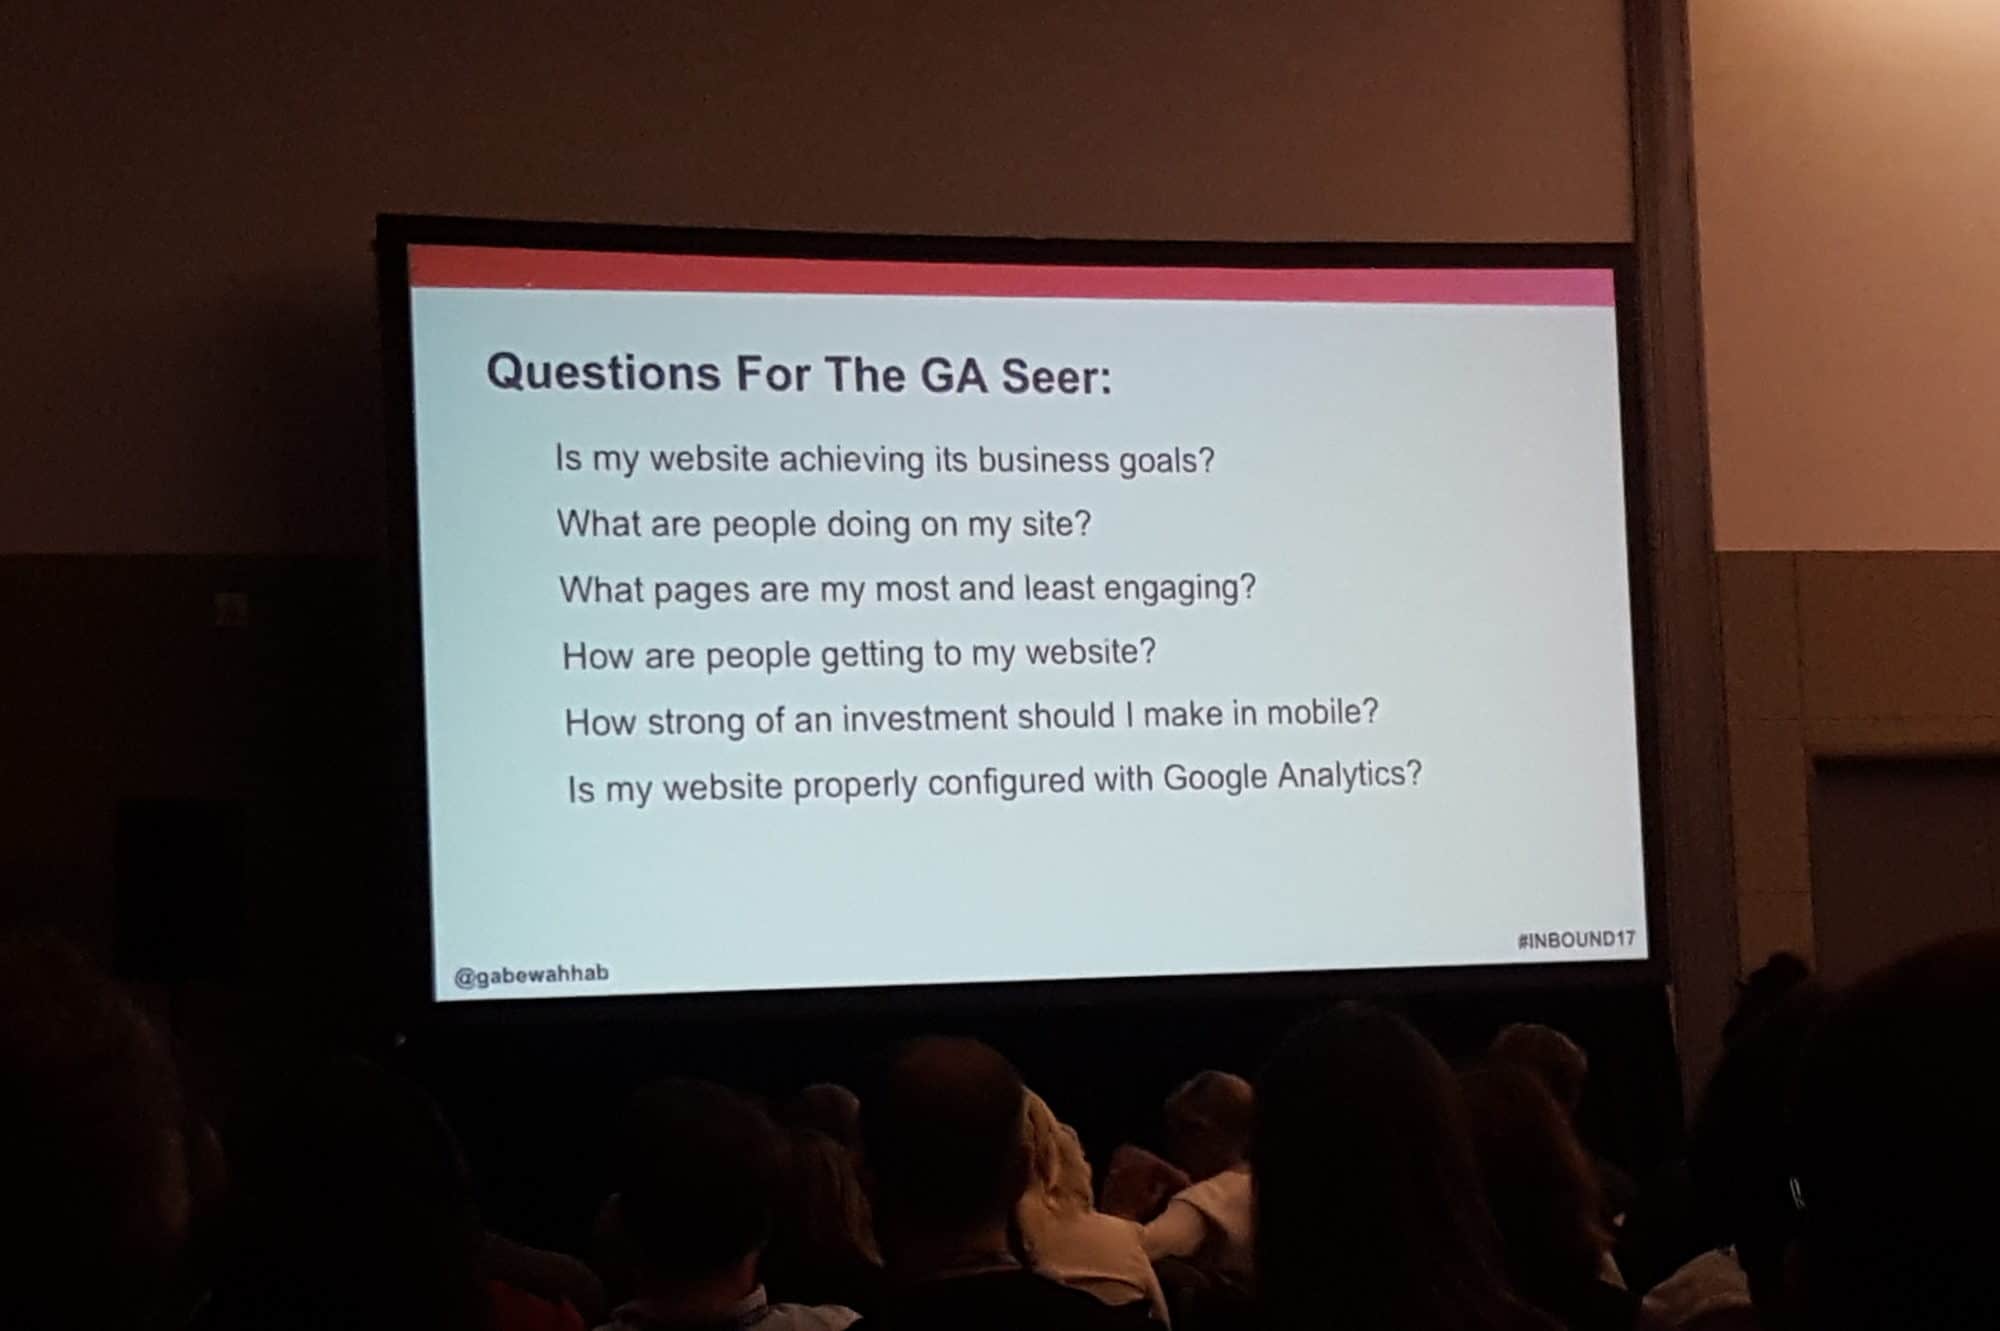
Instead, there are 6 major questions that Gabe recommends.

- Is my website achieving its business goals?
- What are people doing on my site?
- What pages are my most and least engaging?
- How are people getting to my website?
- How strong of an investment should I make in mobile?
- Is my website properly configured with Google Analytics?
Generally speaking, Gabe recommends three major tools in GA for rigorous analysis: Goals, Events and Segments. I wrote a separate guide that explains all 3.
Achieving Business Goals
As you might imagine, Gabe recommends the Goals feature in Google Analytics to represent business goals. Goals are hugely important because they allow you to tie monetary value to specific actions. For example, let’s say every new lead is worth $50 for your business. You can input that value directly into Google Analytics. So, if you drive 1000 visitors to a page and 10% become leads, you can measure the value of either:
- Driving more traffic
- Improving conversion rates.
This makes it easier to communicate with a boss or client.
Actions on Site
After goals, the next big question you should ask is: “What are the actions that people take that are NOT goal conversions?” This is where Events come in. You can tie an Event to an action like watching a video or filling out a quiz. These show quality engagement.
Events are the kind of feature that separates Google Analytics from a web analytics report in HubSpot. Although HubSpot tracks all the important top of funnel metrics, it does not let you drill down and analyze different conversion like Google Analytics can.
Most and Least Engaging Pages
Gabe recommends the Content Behavior Report from GA to determine an overall level of engagement. He specifically reviews Time on Page, Exit Percentage and Bounce Rate to discover his best-performing pages. But, he also makes sure to include goal data in this report. This allows him to answer questions like: “If I lower Bounce Rate by 10%, how will the website become better at generating revenue?”
How People Reach Your Site
You might think this query is as simple as viewing your top sources of traffic. Gabe likes to go a little deeper. He likes to create segments for different types of pages on the site. For example, you want a different report for blog pages versus landing pages. And of course, he ties a goal value to any analysis. In his example, he found that even though referrals generated much less traffic than organic search, referrals were actually 9x more valuable due to the quality of visitor!
Mobile Investment
In the example Gabe shared, 39% of site traffic came from mobile devices… but only 1% of revenue came via mobile purchases. But, you should not draw the conclusion that mobile is a waste of time. Plenty of site visitors may view valuable pages on mobile, then return to make a purchase on desktop. So, he uses Attribution reports to look at conversion assists and last-click attribution. This will give him a spectrum of ways that mobile visitors convert.
Proper GA Configuration
This is the tripwire that will throw a wrench in your entire GA strategy. Gabe sees three common issues with Google Analytics setup:
- Duplicate tracking code: The same tracking code is being used in 2 places, which counts everything twice.
- Tracking code not installed on all pages: This will make it impossible to count important conversions and events.
- Iframes on the site: If you use iframes, Google Analytics will think that a person visited two separate pages when they hit the page that contains the iframe.
Where to Start
Gabe suggested 5 different resources that can get you started.
- Google Analytics Academy: Video courses that teach fundamentals.
- How To Configure a Google Analytics Account: A guide from ConversionXL
- Ultimate Guide to Removing GA Spam: Bots will skew your numbers
- Google Analytics Solutions Gallery: A library of Google Analytics templates from Experts
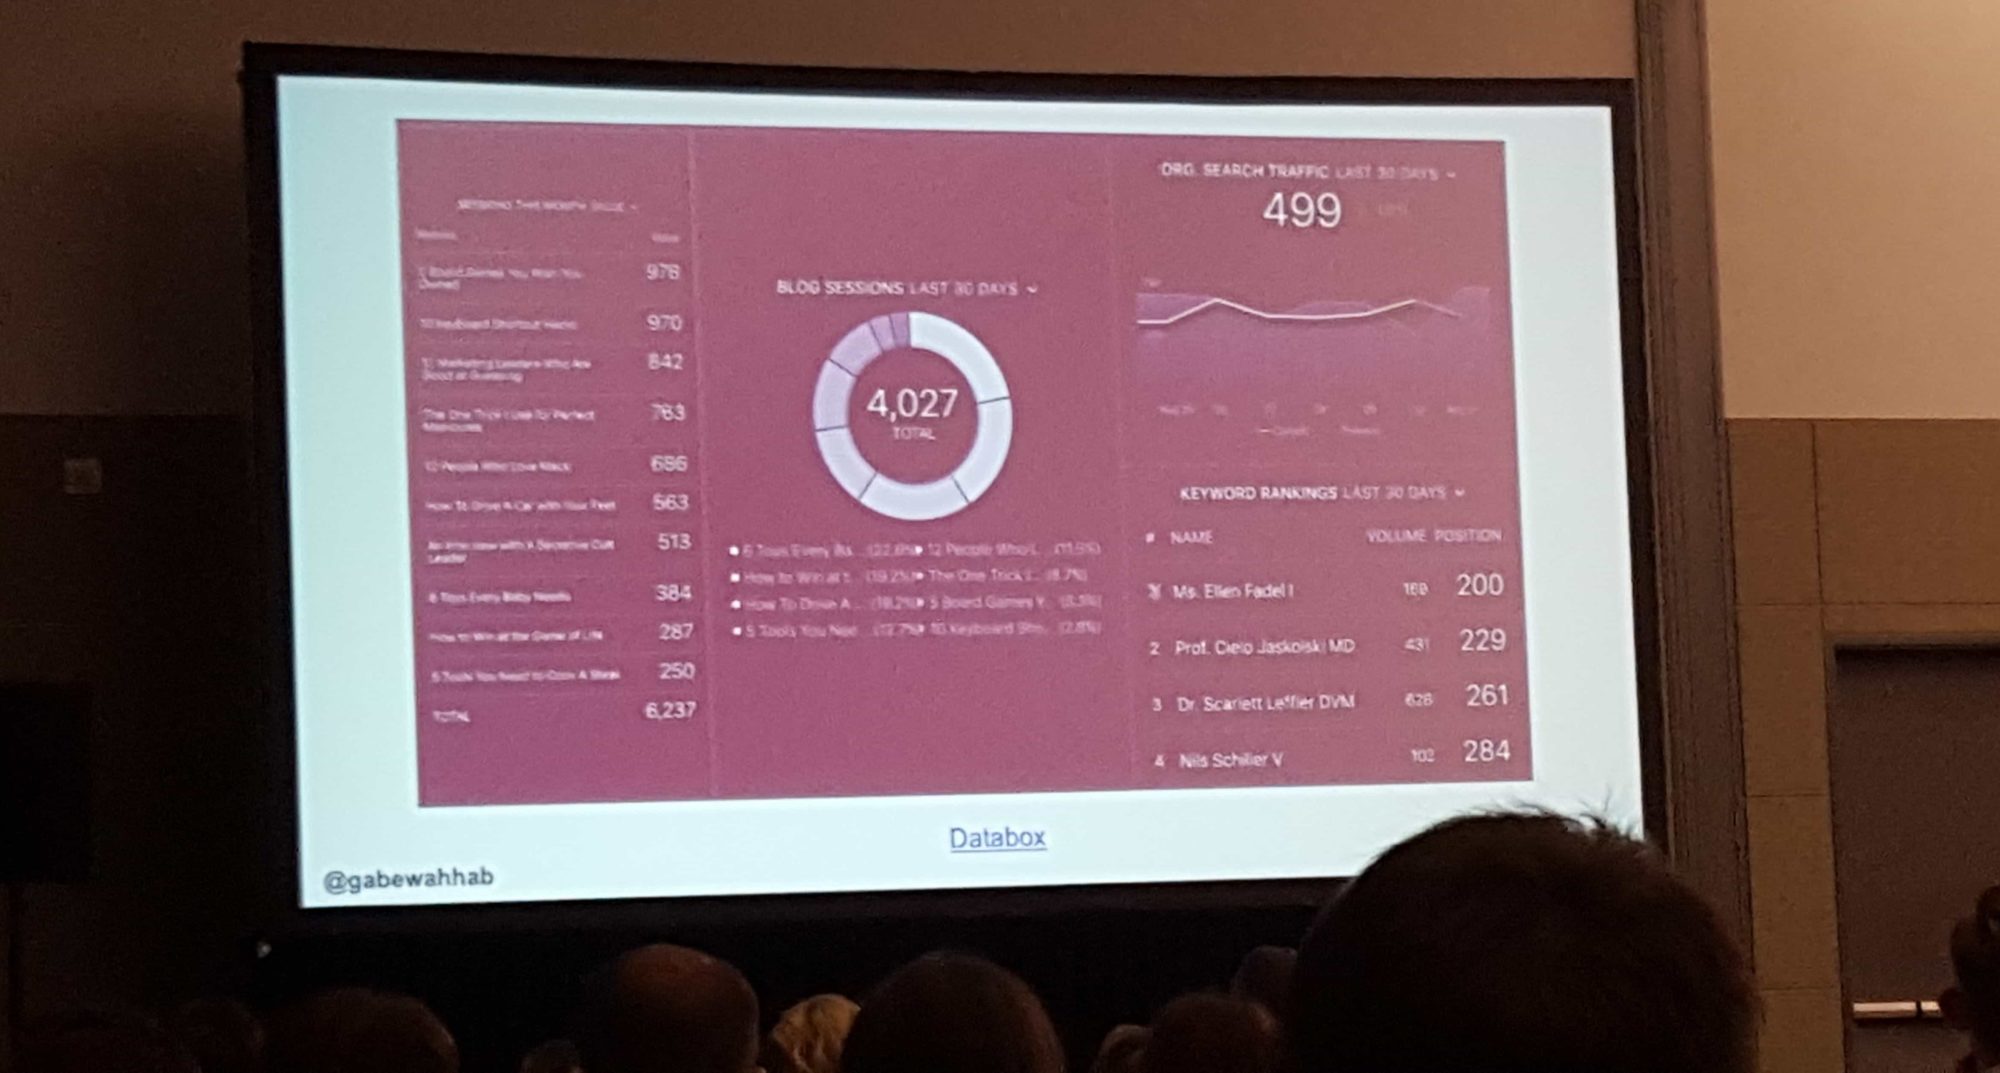
- Databox: Gabe loves it for its simplicity!


