Uses one-click integrations:
-
 HubSpot Marketing
-
 HubSpot CRM
If you don't use HubSpot Marketing or HubSpot CRM, you can pull data from any of our 130+ one-click, native integrations or from spreadsheets, databases and other APIs.
Try this dashboard for freeDetermine what's successful and where there is room for improvement
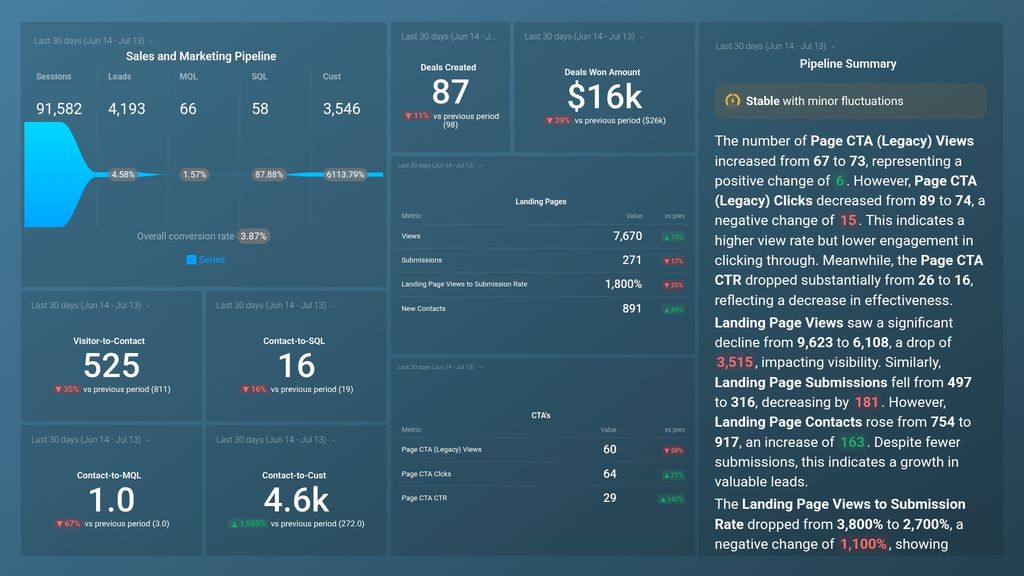
- How healthy is your sales and marketing funnel?
- What are the key conversion rates between lifecycle stages?
- How well are your landing pages and CTAs performing?
Key Metrics
- Lifecycle Stages (funnel)
- Pipeline Conversion Rates
- Landing Page Conversions
- CTA Conversions